| Issue |
Aquat. Living Resour.
Volume 34, 2021
|
|
|---|---|---|
| Article Number | 3 | |
| Number of page(s) | 17 | |
| DOI | https://doi.org/10.1051/alr/2021005 | |
| Published online | 18 March 2021 | |
Research Article
Genetic diversity and population structure of Tarek (Alburnus tarichi), an endemic species to the Lake Van basin, Turkey
1
Faculty of Marine Science, Department of Fisheries Technology Engineering, Ordu University, Fatsa, Ordu 52400, Turkey
2
Central Fisheries Research Institute, Ministry of Agriculture and Forestry, Trabzon, Turkey
3
Faculty of Arts and Sciences, Department of Biology, Recep Tayyip Erdoğan University, Rize, Turkey
* Corresponding author: This email address is being protected from spambots. You need JavaScript enabled to view it.
Handling Editor: Roman Wenne
Received:
16
November
2020
Accepted:
18
February
2021
Abstract
In this study, the genetic relationships of 804 tarek (Alburnus tarichi) samples from a total of 18 populations, including the potamodromus and resident individuals from Lake Van basin in eastern Turkey, were studied by using nine microsatellite loci. A total of 93 alleles was detected, and the average number of alleles per locus was 10.3 ± 3.39. The mean estimated observed and expected heterozygosity were 0.340 ± 0.016 and 0.362 ± 0.015, respectively, which indicated a low level of polymorphism. After Bonferroni correction (P < 0.0027), the multi-locus test applied to each population revealed that 12 out of 18 populations were in Hardy-Weinberg equilibrium (HWE) (P = 0.0120–0.9981). Analysis of molecular variance (AMOVA) showed more than 76% genetic variability within individuals and 19% among populations, which was significantly higher than zero (FST = 0.19), and furthermore, a low level of genetic variation was observed among individuals within populations (4.84%: FIS = 0.06). Bayesian clustering analysis indicated that the total genetic variation grouped into 3 clusters. Additionally, the significance test results revealed that 11 of the 18 populations are threatened with extinction due to recent bottleneck events.We conclude that the tarek populations from the Lake Van basin can be classified into distinct genetic groups, based on microsatellite information. In addition, our results provide essential information for the development of a management plan that conserves the tarek's genetic diversity and achieves a sustainable fishery.
Key words: Tarek / Alburnus tarichi / genetic differentiation / van lake / alkaline lakes / microsatellite
© EDP Sciences 2021
1 Introduction
Alburnus tarichi (Güldenstädt, 1814), commonly called tarek, belongs to the piscine family Cyprinidae. It is endemic to the Lake Van basin in the provinces of Van and Bitlis in the far east of Turkey and is regarded as an economically important species. It lives in lakes, reservoirs and streams in those areas. Tarek has different populations, including those in Van, Erçek, Aygır, Nazik and Koçköprü Lakes (Elp et al., 2014; Şen et al., 2015). However, the largest habitat of the tarek is Lake Van, which is the largest soda lake on earth, with a pH of 9.7–9.8 and a salinity of 22.4‰, receiving water from many small streams that descend from the surrounding mountains. The ratios of chemicals that create the saline environment are 42% NaCl, 34% NaCO3, 16% Na2SO4, 3% KSO4, and 2.5% MgCO3 (Çiftçi et al., 2008; Yiğit et al., 2017). The mature individuals of the tarek living in this lake enter the riversbetween May and June for breeding purposes (Elp et al., 2014).
The total tarek catch in Turkey was around 20 000 tonnes in 1998, while the catch fell to around 9945 tonnes in 2018 (FAO, 2020). The total population size of A. tarichi has exhibited significant decline during recent decades, mainly due to overfishing, environmental degradation and the loss of natural spawning grounds, and it is regarded as a “Near Threatened” species on the IUCN Red List (Freyhof, 2014). Sarı (1997) stated that a large part of the tarek fishing effort is carried out in the period when the fish are migrating from the lake to the rivers for breeding and this situation puts great pressure on the tarek stocks.
A new management strategy is urgently needed to achieve the conservation of the full spectrum of genetic diversity of this species and a sustainable fishery, with habitat protection and strictly limiting or prohibiting fishing during the spawning period being essential. The collection of comprehensive sets of biological and genetic data is needed to support the implementation of that strategy. Characterization of the genetic variation of this fish species is necessary for the conservation of its genetic diversity. Therefore, there is a need for definitive information about the intra specific genetic diversity and population structure of the species.
Despite this need, there have been only a limited number of studies on the species, including reproduction characteristics (Elp and Çetinkaya, 2000), growth, stock assessment and fisheries management (Sarı, 2001), distribution area (Elp et al., 2014; Şen et al., 2015), otolith morphometry, age and growth characteristics (Bostancı and Polat, 2011; Bostanci et al., 2015; Saygın et al., 2017), gonadal abnormalities (Kaptaner et al., 2016), antioxidant responses and DNA damage (Çilingir and Oğuz, 2018) and mitogenome sequencing (Kubanç et al., 2016). Previous molecular studies examining phylogeny and systematic uncertainties of Alburnus species in Turkish inland waters have primarily used mitochondrial DNA (mtDNA) markers (Perea et al., 2010; Keskin and Atar, 2013; Geiger et al., 2014; Mangit and Yerli, 2018; Bektas et al., 2020). Based on molecular data, Mangit and Yerli (2018) reported that there were 21 valid species in freshwaters of Turkey. The latest study on this genus was conducted by Bektaş et al. (2020). This study identified the substantial Alburnus species in Turkey and clarified their interspecific relationships by using the entire cyt b and the coI gene sequences. To date, genetic studies of populations have not been conducted specifically for conservation purposes. Since the loss of genetic diversity and heterozygosity in populations will decrease the potential for the adaptation of the tarek to changing environmental circumstances, including climate change, e.g., through reduced reproductive capacity and resistance to diseases, populations of this species may disappear in the future.
For these reasons, molecular genetic studies are necessary for the determination of different populations of A. tarichi and to support comprehensive conservation strategies. Therefore, this study aimed to genetically characterize the populations of tarek as a cornerstone of efforts to maintain the full spectrum of its genetic diversity and a sustainable fishery.
Neutral molecular markers have been frequently used in genetic studies for conservation purposes, e. g., the mitochondrial genome was used for Alburnus species (Briolay et al., 1998; Ketmaier et al., 2009; Kubanç et al., 2016) and microsatellites have also been used (Longwu et al., 2013). Although the various genetic markers for estimating genetic variation have their advantages, the use of microsatellites is still beneficial because they have several advantages that researchers exploit in a wide variety of applications (Khaefi et al., 2018; Kaczmarczyk, 2019; Yamazaki et al., 2020). Microsatellite DNA markers are extensively used for the estimation of the genetic variation between different fish populations in which there are the high levels of polymorphism due to small locus size, abundant in genomes and the codominant nature of Mendelian inheritance. Also, microsatellites can be a useful tool for studies on endangered and/or protected fish populations to determine the level of genetic diversity.
Therefore, in the present study, the aim was to use nine previously designed microsatellite markers to survey the genetic diversity and population structure of 18 populations of A. tarichi from the Lake Van basin in eastern Turkey. A secondary aim was to determine the degree of population differentiation, which is a direct effect of random genetic drift, mutation and natural selection. This is the first investigation of the genetic structure of A. tarichi populations and it will provide useful baseline data for the development of management strategies and programs that conserve the genetic diversity of the tarek and maintain a sustainable fishing industry.
2 Materials and methods
2.1 Sample collection and DNA isolation
Eight hundred and thirty two individuals from 18 populations of A. tarichi were collected from different localities in the Van Lake Basin, including 7 large rivers (Karasu, Muradiye (Bendi Mahi), Deliçay, Zilan, Karmuç, Güzelsu, Engilsu), 3 lakes (Van, Erçek and Nazik lakes) and 1 dam lake (Koçköprü) between 2010 and 2013. The sampling, which involved both migratory and non-migratory individuals, was done in two different periods. A sampling of migrating fish was conducted in the lower parts of the rivers in May-June when the fish were entering for breeding purposes. In addition, non-migratory fish that had spent all their lives in rivers was carried out in September–October after the migration for reproduction had ended completely. Sampling was also carried out in lakes during the same period (Fig. 1; Tab. 1). The collected tissue samples were preserved in absolute ethanol and kept at −20 °C until the DNA was extracted. Total DNA extraction was performed by using the DNeasy® Tissue Kit (QIAGEN, Hilden, Germany) and following the manufacturer's instructions. DNA concentration and quality were investigated by runninga DNA sample from each fish on 1% agarose gel stained with ethidium bromide, followed by measurement with a UV/visible spectrophotometer (BIO-RAD, The SmartSpec Plus) at 260/280 nm and stored at −20 °C until needed.
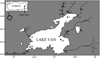 |
Fig. 1 Sampling points for Alburnus tarichi in the Lake Van basin (the numbers of the sampling locations refer to Tab. 1). |
Details of sampling study for tarek in the Lake Van basin; sampling locations, coordinates, altitude (m) and sample numbers.
2.2 PCR amplification and microsatellite DNA genotyping
The individuals were genotyped by referencing nine polymorphic nuclear microsatellite loci, namely Lsou08, Lsou34 andLsou05 (Muenzel et al., 2007), LceD63 and LceC172 and LceDT (Larno et al., 2005), Lco3 (Turner et al., 2004) and BL1-2b and BL1-61 (Dubut et al., 2009). These microsatellite primers were developed by researchers for different cyprinid species, namely Luxilus cornutus (Turner et al., 2004), Leuciscus cephalus (Larno et al., 2005), Leuciscus souffia (Muenzel et al., 2007) and Telestes souffia and Telestes muticellus (Dubut et al., 2009) (Tab. 2). The microsatellite forward primers were labelled with fluorescent dyes (6-FAM, VIC, NED, or PET). The PCRs were carried out in three multiplex sets (SetA: LceD63, Lsou08 and Lsou34; SetB: LceDT, BL1-2b, BL1-61 and Lco3; SetC: LceC172 and Lsou05). The reaction was conducted in a final volume of 10 μl that contained 5 μl of 2XPCR Master Mix (Promega), 5–10 ng template DNA (25–50 ng/μl), 1 μM of each primer (10 pM of each primer) and ddH2O to make up the total volume. PCR amplifications were carried out in a PTC200 gradient thermal cycler (MJ Research, Waltham, Massachusetts, USA) and by using the following protocol: a preliminary denaturation step at 94 °C for 4 min, followed by 35 cycles at 94 °C for 30 s, 58 °C (56 °C for Set C) for 30 s and 72 °C for 45 s, with a final extension at 72 °C for 5 min, followed by cooling to 4 °C. The extension products were electrophoresed by Macrogen Inc. (Seoul, Korea) in a capillary DNA analyser (ABI3730xl; Applied Biosystems). The fragment size of alleles was scored by using the GeneScan-500 LIZ Size Standard (Applied Biosystems) and they were analysed with GeneMapper version 3.7 (Applied Biosystems).
Characteristics of the nine amplified microsatellite loci used in this study for population analysis of the tarek, Alburnus tarichi.
2.3 Data analysis
The Micro-Checker Version 2.2.3 (Van Oosterhout et al., 2004) was used to check the possible occurrence of genotyping errors due to non-amplified alleles (null alleles) and short allele dominance (large allele drop-out) or genotyping errors due to stuttering (Hoffman and Amos, 2005; Roon et al., 2005). The FST values relative to the null alleles, and confidence intervals with and without correction, were estimated by using FREENA software (Chapuis and Estoup, 2007). If the comparison of FST values estimated with and without ENA correction shows a significant difference (P < 0.05), any locus indicating the presence of null alleles should be excluded from further analysis. Deviations from the Hardy-Weinberg equilibrium (HWE) were assessed for each location and each locus with GENEPOP Version 4.7.0 (Rousset, 2008), according to the methodology of Weir and Cockerham (1984), and were tested by means of an exact probability test with a Markov chain algorithm (Guo and Thompson, 1992); P values were estimated from 10 000 dememorization steps, 100 batches and 5000 iterations. Linkage disequilibrium across all pairs of loci was tested with the Markov chain method described earlier. Significance levels for multiple comparisons were adjusted by employing a sequential Bonferroni correction (Rice, 1989). Several alleles per locus (Na), observed heterozygosity (Ho), expected heterozygosity (He) and the polymorphic information content (PIC) per locus were calculated by using GENETIX version 4.05 (Belkhir, 2004) and CERVUS version 3.07 (Kalinowski et al., 2007). An analysis of molecular variance (AMOVA) (Excoffier et al., 1992) was conducted with Arlequin version 3.5 (Excoffier and Lischer, 2010) to determine differences between the clusters generated with the STRUCTURE program (Pritchard et al., 2000), and also by geographic region. AMOVA analysis was used to determine the distribution level of genetic variation within populations and between populations. Additionally, the program Arlequin (Excoffier and Lischer, 2010) was used to quantify the genetic difference between pairs of populations based on gene frequencies and by using pairwise FSTwith significance calculated by using 10 000 permutation tests. With the Arlequin program (Excoffier and Lischer, 2010), Nm values calculated with the equation, Nm = [(1/FST) − 1]/4 (Wright, 1951), were employed to determine the extent of migration between the populations. Long-term estimates of the effective population size (Ne), which is the minimum size of the population having similar genetic characteristics to the actual population, were calculated by using heterozygosity-based methods, with both a step-wise mutation model (SMM) and an infinite alleles model (IAM) applied. The SMM of Ohta and Kimura (1973) predicts that at mutation-drift equilibrium, Ne is represented by [(1/1−HE)2−1]/8 μ. Ne was also estimated under the IAM by using the equation, Ne = H/4 μ(1−H) of Crow (1986). In the present study, the mutation rate was fixed at 5 × 10⁻⁴ for estimations done with both models because it was the most commonly used microsatellite mutation rate in fishes (Estoup and Angers, 1998).
To assess the correlation between pairwise geographical distances and genetic distances, the ‘Isolation by Distance’ value (Rousset, 1997) of all populations was determined by using the Mantel test (Mantel, 1967) in GenAlEx version 6.502, with 10 000 permutations used for the determination of significance. The matrix of the geographical distances between sampling locations was constructed by measuring the distances in Google Earth, version 7.1.7.2606. The Bayesian program STRUCTURE version 2.3.4 (Pritchard et al., 2000) was used to infer the number of genetically differentiated clusters (K) in the multi-locus genotype data. The estimation of K was performed with 10 independent runs with K = 1–10 with 1 000 000 MCMC steps and with a burn-in period of 100 000 iterations for each K value, assuming mixing between populations and using the correlated allele frequencies model. The most probable K value was determined with the ΔK method (Evanno et al., 2005) and using STRUCTURE HARVESTER (Earl and VonHoldt, 2012). The degree of heterozygote excess was determined to detect recent bottleneck events by using BOTTLENECK version 1.2.02 (Piry et al., 1999) with Sign and the Wilcoxon's test under the Two-Phased Mutation Model (TPM) (Cornuet and Luikart, 1996). Di Rienzo et al. (1994) and Piry et al. (1999) stated that the Wilcoxon's test is the most appropriate and powerful test for low numbers (<20) of polymorphic loci, and when using microsatellites, they recommended the TPM, with 95% single-step mutations and 5% multiple-step mutations and variance among multiple steps of approximately 30.
3 Results
In this study, all nine examined primer pairs of the eighteen populations of Alburnus tarichi were successfully amplified and all showed a polymorphic pattern. Genotyping of the 804 collected individuals at nine loci revealed a total of 93 alleles. The observed allele sizes ranged from 92 to 263 bp and the number of alleles varied from 6 (Lsou08 and LceDT) to 15 (Lce172), with a mean of 10.3 ± 3.39 alleles per locus. The highest and lowest numbers of alleles were observed in the Mrd1 (48) and Vnsk (29) populations, respectively. The meannumber of alleles per locus was slightly higher in Mrd1 (5.33 ± 0.577) than in the other populations (Tab. 3).
In addition, allelic richness (AR) varied from 2.789 (BL12b) to 7.156 (Lsou34), with a mean of 4.578 perlocus. The exact test for linkage disequilibrium revealed no evidence of linkage between loci for any population after Bonferroni correction. This confirmed that all microsatellite loci were not linked and were assorted independently. The average observed and expected heterozygosity values for populations ranged from 0.2497 (Erck) to 0.4613 (Krs2) for Hoand from 0.2465 (Erck) to 0.5300 (Krs2) for He, respectively, while for loci they ranged from 0.188 (LceD63) to 0.625 (LceDT) for Ho and from 0.204 (BL12b) to 0.537 (Lco3) for He, respectively (Tab. 3). Within sampling locations, the mean He values were consistently higher than the Ho values across all loci, which revealed a deficiency of heterozygosity among the samples. Moreover, the polymorphic information content (PIC) ranged from 0.2416 (BL12b) to 0.566 (Lsou05) and averaged 0.414 across the 9 microsatellite loci.
The probability values for the observed samples were used to define departure from the Hardy-Weinberg equilibrium (HWE). The results are shown in Table 3. Of the 162 HWE tests across all nine loci, only six deviated from the HWE within each sampling locations after sequential Bonferroni corrections (P < 0.00031) (Tab. 3) (Rice, 1989). The composite population, which included all the studied populations, is also shown in Table 3. All the composite populations (multi-sample) showed positive FIS values, except for LceDT. When the multilocus test was performed for each population, there was a departure from HWE in some of the populations (Dlc1, Engs, Kckp, Krmc, Krs2 and Mrd1) (P < 0.0027). The Micro-Checker analysis suggested the presence of possible null alleles at a few loci in different populations. The FST values, relative to the null alleles and confidence intervals, with and without correction, were estimated with FREENA software (Chapuis and Estoup, 2007). The Student-t-test showed no significant difference (P > 0.05) between the FST values when null alleles were considered (FST = 0.180940) and not considered (FST = 0.187739).
The original data were then directly used for further analysis. Analysis of molecular variance between different groups was performed by using the genetic structure analysis results reported in this study. Results of AMOVA analysis for the whole dataset explained 76.38% of the total variation within all individuals and 18.78% among populations, which was significant (FST = 0.18782) (P < 0.05). Furthermore, a low level of genetic variation was observed among individuals within populations (4.84%, FIS = 0.05954) (Tab. 4). The second grouping of sampling localities was justified by the F values for three groups: migratory, non-migratory, and peripheral populations, which are close to but have no connection with Lake Van. This grouping revealed high and significant variation within populations (74.07%; P = 0.00000) and a low but significant percentage of variation among groups (8.43%; P = 0.00000) (Tab. 4).
Genetic differences across all eighteen populations were analysed using the Pairwise FST and Nei's genetic distance values and results are presented in Table 5. In the pair-wise matrix, FST values varied from −0.0078 (Ttvn–Krmc) to 0.5654 (Nzk–Mrd2), while pair-wise Nei genetic distance values varied from 0.0030 (Krmc-Krs1 and Krmc-Gzls) to 1.2220 (Nzk-Mrd2) (Tab. 5). Pairwise comparisons revealed that although the Nei's distance values between populations were consistently larger than those for FST, both sets of values showed similar patterns across the 18 populations.
An unrooted NJ phylogenetic tree was also constructed from the genetic distance matrix generated from microsatellite data (Fig. 2). The Krmc and Zln1 populations, together with the non-migrating river populations (Mrd2, Dlc2, Zln2 and Krs2) and dam lake populations (Kckp and Hsnb), constituted one subcluster, while the migrating populations from Lake Van formed another cluster, with the Nzk and Dlc1 populations situated basal to all other populations of A. tarichi.
Bayesian clustering analysis using STRUCTURE version 2.3.4 (Pritchard et al., 2000) was performed on all eighteen populations in this study. This analysis showed that the most likely value of K with the highest ΔK was 3, indicating that the overall genetic variation grouped into 3 clusters (Fig. 3). In other words, Figure 3 represents the clustering pattern of the 18 populations when using K = 3. In Figure 3, he first cluster includes 10 populations (Gzls, Engs, Erck, Ercs, Krmc, Krs1, Mrd1, Ttvn, Vnsk and Zln1). The second cluster includes 6 populations (Mrd2, Dlc2, Hsnb, Kckp, Krs2 and Zln2), and the third cluster includes the Dlc1 and Nzk populations.
The recent declines of populations of A. tarichi were confirmed by using the Wilcoxon and Sign tests in BOTTLENECK under Two-Phase Model (TPM) for microsatellite evolution (Tab. 6). The Wilcoxon and Sign tests under Two-Phase Model (TPM) generated significant values (P < 0.05) for the Ttvn, Vnsk. Zln2, Zln1, Engs, Erck, Ercs, Kckp, Krmc, Krs1, Mrd1 and Gzls populations for the values for the Dlc1 and Mrd2 populations were only significant for the Wilcoxon test under TPM (P < 0.05). The remaining populations (Nzk, Dlc2, Dlc1, Hsnb, Krs2 and Mrd2) showed no significant excess of heterozygosity, with the probability values determined by bottleneck testing all above 0.05.
Statistics for genetic variation in 18 populations of A. tarichi with the use of 9 microsatellite loci.
Results of analysis of molecular variance (AMOVA) among different groups ineighteen A. tarichi populations.
Estimates of pairwise FST values (below diagonal) and Nei's Genetic Distance (above diagonal) between eighteen populations of A. tarichi detected in 9 microsatellite loci.
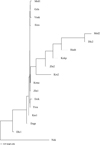 |
Fig. 2 Neighbor Joining tree of eighteen populations of A. tarichi in the Lake Van basin, based on Nei's genetic distance. |
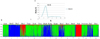 |
Fig. 3 Genetic assignment of the eighteen populations of A. tarichi. (a) Delta-K values; (b) population structure analysis as inferred when K = 3, based on microsatellite data. The genotype of each individual is represented by a vertical line divided into coloured segments and each population is separated by a black line. The abbreviations correspond to the defined populations. |
Heterozygosity excess/deficiency under the Two Phase Model (TPM) and all populations and respective Sign and Wilcoxon tests.
4 Discussion
The tarek, Alburnus tarichi, which is endemic to the Lake Van basin in eastern Turkey, has a limited distribution and there are relatively high concerns for its conservation future. This study is the first population genetics study on populations of the tarek. Moreover, it has generated fundamentally important information for the conservation and management of this fish species and the associated fishing industry.
In this study, the overall aim was to determine the genetic similarities and differences among 18 populations of A. tarichi from seven major rivers (Karasu, Muradiye, Deliçay, Zilan, Karmuç, Güzelsu and Engilsu), including migrating and non-migratory individuals, three lakes (Van, Erçek and Nazik) and one dam lake (Koçköprü) in the Lake Van basin. The microsatellite analysis method, one of the DNA polymorphism techniques, was employed for the differentiation process. Nine different microsatellite loci (Lsou08, LceD63, Lsou34, Lce172, LceDT, Lco3, Lsou05, BL12b and BL161) were used.
Microsatellite markers are widely used to study genetic variation in populations characterised by high allelic diversity resulting from parental inheritance, codominance, genomic distribution, high polymorphism and high mutation rates (Tautz, 1989; O'connell and Wright, 1997). The selected loci were initially been designed for Leuciscus cephalus, Luxilus cornutus, Telestes muticellus and Telestes souffia and were reported to be polymorphic and highly informative (Turner et al., 2004; Larno et al., 2005; Muenzel et al., 2007; Dubut et al., 2009). The polymorphic information content (PIC) value indicates the suitability of the markers and primers used in a study for the analysis of the genetic differences within a population and is determined by heterozygosity and the number of alleles (Aljumaah et al., 2012). The PIC value is considered reasonably informative when it is between 0.25 and 0.5 (Sheriff and Alemayehu, 2018). Values above or below this range are considered informative and polymorphic or less informative, respectively (Marshall et al., 1998). On that basis, the values for two of the microsatellite loci, Lco3 and Lsou05 of >0.5 showed high polymorphism, while the other loci were reasonably informative. This finding provides more evidence that microsatellite markers are the correct choice for genetic characterization and diversity studies.
Through the use of these loci, the intra- and inter population genetic diversity was studied. Based on this information, the objectives were to determine the genetic diversity levels of 18 defined tarek populations, and more specifically, the non-migratory individuals permanently resident in the rivers in the lake basin, the individuals with migratory behaviour for spawning and the differences between lakes that are not connected with Lake Van, and finally to analyse and interpret the generated genetic data.
4.1 Genetic diversity of populations
For the 18 tarek populations, the average number of alleles per locus, which is a general indicator of genetic diversity, as well as the expected and observed average heterozygosity values, polymorphic information content (PIC), and deviations from the Hardy-Weinberg Equilibrium (HWE) for each population, were primarily examined. When the results for the alleles of different microsatellite loci used in this study were compared with the results of the microsatellite studies performed on some other cyprinid species (Le. cephalus, Lu. cornutus, T. muticellus and T. souffia) for which the same loci were used (Tab. 7), the average number of alleles per locus was 10.3 ± 3.39 (range 6–15 alleles/locus) which is very close to the mean number of alleles (9.1 alleles/locus) reported for the other four species. The microsatellite loci Lco3, Lsou05, Lsou34, Lce172 and Lsou08 had a higher number of alleles than reported in the literature (Turner et al., 2004; Larno et al., 2005; Muenzel et al., 2007), while LceD63, LceDT, BL1-2b and BL1-61 had lower numbers of alleles than reported in the literature (Larno et al., 2005; Dubut et al., 2009).
In the present study, the loci with the highest and lowest polymorphism levels, together with the average number of alleles, were in line with the results of studies on other cyprinid species (Turner et al., 2004; Larno et al., 2005; Muenzel et al., 2007; Dubut et al., 2009). The high number of alleles observed in most of the studied loci indicates that the selected loci are suitable for analysing the differences between A. tarichi populations. However, although the loci used in the present study contained a high number of alleles and were polymorphic, the mean number of the multilocus alleles (4.15) in the studied populations was low. It can therefore be stated that the tarek populations in the Lake Van basin have low overall genetic diversity in terms of the loci studied. On the other hand, a total of 26 unique alleles (private alleles) were identified across all populations, and the incidence of these alleles was low (0.032 ± 0.006) (Tab. 7).
When the private allele results were evaluated on the basis of populations, the most distinct allele was detected in the Lake Nazik (5) and Koçköprü Dam lake (6) samples. Brookes et al. (1997) stated that low frequency alleles can be easily become extinct. The amount of an allele is very important for the maintenance of populations of a species as it provides the genotypic range required for adaptive response to changing environmental circumstances (Beardmore et al., 1997). Moreover, some rare specific alleles seen in populations may also reflect differences in habitat characteristics as a result of natural and anthropogenic effects that have caused specific selection pressures or different mutation rates. One of the important means of estimating genetic diversity is the determination of population heterozygosity which is defined as the average proportion of heterozygous loci in individuals. In this study, the average values for observed and expected heterozygosity that were obtained from data for nine microsatellite loci in 18 tarek populations in Turkey were 0.340 ± 0.016 and 0.362 ± 0.015, respectively (Tab. 8). When compared with the results of microsatellite studies on other cyprinid populations, for example, the >0.55 reported by both Muenzel et al. (2007) and Dubut et al. (2009), the observed and expected heterozygosity values reflected a low level of polymorphism in tarek (Tab. 8). In addition, the observed and expected heterozygosity values were much lower than those for the Alburnus species, A. caeruleus (0.81, 0.83) and A. mossulensis (0.81, 0.84), from the two major rivers of the Tigris-Euphrates basin in Iran (Dorafshan et al., 2014) (Tab. 8). Dávila et al. (2009) and Dorji et al. (2012) stated that heterozygosity estimates of more than 0.5 are suitable for genetic diversity studies whereas Takezaki and Nei (1996) stated that the mean heterozygosity value across populations should be between 0.3 and 0.8 for the marker to be useful in measuring genetic variation.
In the present study, estimates of observed heterozygosity across all 18 tarek populations were below 0.5 (Tab. 8), and the Erck, Krmc, Krs1, Ttvn and Vnsk populations were below or near the lower limit of 0.3 reported by Takezaki and Nei (1996). Low values for heterozygosity can be due to the effects of small population size, high selection pressure in a closed population, inbreeding and little or no flow of genetic material to the population (Araújo et al., 2006; Canon et al., 2006). In addition, it is possible that the low heterozygosity in the Erck population may be a consequence of the deliberate transfer and release of fish from other populations by a government agency. In the present study, the observed heterozygosity values for all populations, except Mrd2, Dlc2 and Erck, were lower than the expected values. Conversely, if the heterozygosity value is higher than expected, two populations previously considered isolated may be considered mixed.
The FIS value is used to determine whether a population is in Hardy-Weinberg equilibrium and whether it is homozygous. In the present study, the values calculated for all loci varied from −0.1102 to 0.1655 across all 18 populations. A high positive FIS shows a high degree of homozygosity while negative values indicate a low level of inbreeding (Dorji et al., 2012). After Bonferroni correction for each population and composite population (α = 0.05/18 = 0.0027) (Rice, 1989), the Dlc1, Engs, Kckp, Krmc, Krs2 and Mrd1 populations deviated from the Hardy-Weinberg expectation when multiple-locus tests were applied to each population. At the Lsou08 locus, which deviated from the HWE, excessive homozygosity was observed in the Dlc1 population which had the highest FIS value of 0.613. This type of deviation from expectation may indicate inbreeding, assortative mating and subdivision of the population (Wahlund effect) or selection (Dharmarajan et al., 2013).
Also, because there is no historical data on the genetic diversity and heterozygosity of A. tarichi populations, there may be several explanations for the deviation from the expectations of HWE. In this context, association between genetic diversity and variables like altitude, lake characteristics, human activities and drainage pattern has been reported for varied species in different studies (Angers et al., 1999; Castric et al., 2001; Leprieur et al., 2008; Clavero et al., 2013). These studies revealed that genetic diversity of fish species may be positively correlated with the area and anthropogenic impacts (e.g., flow modifications) and negatively correlated with altitude. In our study, we tested the hypothesis that correlates of fish diversity differ according to varying altitudes. The level of genetic diversity was evaluated within and among 18 populations at altitudes varied between 1647 and 1844 m in and around the Lake Van, using nine microsatellite markers. The values of genetic diversity as represented by the expected heterozygosity (He) and Allelic richness (AR) varied from 0.2465 to 0.5300 and 2.90 to 4.47 for A. tarichi populations, respectively. As a general pattern, genetic diversity increased gradually with the increase in altitudes from lowest sampling sites (1647 m), the values of genetic diversity reached the highest level at the altitude of 1669 m, and then started to decrease with the increase in altitudes (Tab. 3). The regression analyses demonstrated a weak and statistically insignificant relationship (correlation coefficient: R2 = 0.1572, P = 0.249 for He; R2 = 0.1717, P = 0.274 for AR) between genetic diversity and altitudes for Tarek populations. Secondly, the formation of Null alleles may be one of the causes of deficiencies in the level of heterozygosity (Tab. 3). Possible Null alleles in this study were not taken into account in subsequent analyses because their effect on genetic difference was not significant after the Student-t-test was applied (P > 0.05). Finally, overfishing is likely to be one of the most important causes. Şen et al. (2015) reported that overfishing has been a serious problem in the Lake Van basin in recent years. This can lead to a reduction in effective population size and ultimately the loss of genetic diversity and population.
Sample number, allele size range and allele numbers of all populations and nine loci.
Summary of microsatellite allele diversity in some Alburnus species and cyprinid fish populations which used the same loci with this study.
4.2 Genetic differentiation
When the test for allele distribution between populations for all loci was applied, the null hypothesis was rejected (P < 0.001), which showed that alleles are heterogeneously distributed in the 18 populations. Wright's F-statistics and especially FST, which are among the most widely used descriptive statistics in population and evolutionary genetics, provide important insights into evolutionary processes that affect the nature of genetic variation within and between diploid populations. Their most common use is to make inferences about demographic processes occurring within and between populations, such as colonization, migration, genetic drift and extinction (Ryman and Leimar, 2008).
In the current study, the finding that the multi-sample and multi-locus FST values were significantly higher than zero (FST = 0.1877) confirmed the genetic heterogeneity of the 18 tarek populations. The FST values, which ranged from −0.0013 to 0.5654, were greater than zero for most of the population pairs, and it was confirmed that there are genetic differences between populations. However, with the exception of the Mrd1 and Dlc1 populations located in the north-east of Lake Van,the genetic difference values between all the migratory populations (Zln1, Gzls, Krmc, Ttvn and Vnsk) associated with Lake Van were negative.
For the interpretation of FST values, a value between 0.05 and 0.15 indicates moderate differentiation, whilst a value between 0.15 and 0.25 indicates large genetic differentiation (Wright, 1978; Hartl and Clark, 1997). Negative FST values indicate that genetic differences within populations are greater than between populations. On the other hand, a large positive value means that there is no diversity within the populations and that at least two of the sampled populations have different fixed alleles.
In particular, the Nzk population had a high genetic difference from all other populations (FST > 0.3497), and the Mrd2, Dlc1, Dlc2, Kckp and Hsnb populations also had genetic differences with all other populations. The values for genetic differences between the non-migratory and migratory populations of Muradiye, Karasu and Deliçay rivers were 0.2927, 0.1268 and 0.3858, respectively. These values indicate that the genetic differences between the three river populations in question is high and that there is no or very low gene flow between the populations sharing the same river. The most important reasons for this may be the isolation of breeding populations in the rivers, which is attributable to dams and natural features on the rivers.
Analysis of molecular variance (AMOVA) among different groups was performed (Tab. 4) to verify the clusters generated by the STRUCTURE program (Pritchard et al., 2000) and to observe how the variation is distributed among and within populations. In the first grouping, which was for sampling localities, each of the populations was considered a separate group. The high and significant pairwise FST values in the present study indicated that A. tarichi populations are genetically differentiated, and that more than 73.34% of the total genetic variation was among individuals within populations (Tab. 4).
In addition, the percentage of variance components between sampling locations (18.78%) was greater than the percentage of variance components between samples (4.89%) within sampling locations. That means that the geographical diversity between sampling locations was greater than the habitat differences within the locations at which the samples were collected. Similarly, considering three groups, namely the migratory populations in Lake Van and rivers flowing into the lake, non-migratory populations and peripheral populations, the variation within individuals was 74.07% which means that most of the variation is due to differences between samples within the sampling sites. Also, the variations between groups and within groups were 8.43% and 12.81%, respectively, possibly due to the relatively low gene flow (Nm < 1) between groups and within group populations. Additionally, the variance components were found to be statistically significant for the comparisons (P < 0.001).
The level of genetic variation between populations can be explained by using the gene flow values calculated from the FST values for the amount of fish migrating between populations. Generally, it means that alleles not originally in the recipient population are transferred by migrating individuals. In this study, the FST value was significantly higher than zero among the 18 populations which indicates that gene flow between the populations is very low.
In Wright's (1951) “island model” hypothesis, the average migration number (Nm) calculated from the multi-locus FST value (0.1878) for each generation was 1.08. Based on the gene flow levels calculated for population pairs when the same assumption was applied, the Koçköprü, Hasanabdal, Nazik populations and river populations (Muradiye, Karasu, Deliçay and Zilan) with non-lake resident individuals had very low gene flows with other populations in each generation. For core locus populations, isolation and strong differentiation may occur if the migrating fish exchange (female and male) between populations in each generation is less than 1 (Wright, 1931). However, the effective population size for mitochondrial DNA is 1/4 the effective population size for core genes (Birky et al., 1983). This means that if the effective migration is less than four individuals in each generation, the probability of genetic differentiation is high.
The effective population size (Ne) is the minimum size of the population having similar genetic characteristics to the actual population. The Ne value is calculated by first using the infinite allele model (IAM) (Crow, 1986), and then the stepwise mutation model (SMM) (Ohta and Kimura, 1973). In the present study, the IAM produced values between 58 and 417, and the SMM generated effective population size values ranging between 65 and 764. Values for both models combined ranged between 58 and 764, with an average of 411. Therefore, the proportion of migrating fish was small in comparison to the average effective population size (Nm/Ne = 1.08/411 = 0.26%).
The Ne for freshwater fish was estimated to be between 30 and 3000 (DeWoody and Avise, 2000), with the upper value well above the value obtained in our study. Several factors influence the effective size of a population; they include fluctuations in the size of the breeding population, variance in fecundity, sex ratio and degree of coincidence of generations (Crow and Kimura, 1970). Theoretically, while a Ne value of 50 would be sufficient to preserve genetic diversity in the short-term, a value of 500 individuals is required to maintain longer term stability (Van Dyke, 2003). The current Ne for the tarek still appears to be large enough to maintain the necessary variation. However, this conclusion should be treated with caution as a very recent bottleneck would not yet have caused a detectable reduction in diversity. Besides, Miller and Kapuscinski (1997) reported that genetic variation is determined by the history of the population, and in comparisons between genetic variation and population dynamics, the Ne estimate for a single generation can be misleading.
For the genetic distance values calculated with the DS standard genetic distance method of Nei (1972), the highest values among the studied populations were between the Nzk and Mrd2 (1.222) and Nzk and Dlc2 (1.070) populations. Conversely, the lowest genetic distance values between populations were between the Krmc and Gzls (0.003), Krmc and Ttvn (0.004) and Zln1 and Gzls (0.004) populations (Tab. 5). When the non-migratory populations and migratory populations were evaluated as individuals, the Karasu, Muradiye and Deliçay populations were genetically distant, except for the populations of the Zilan River. The correlations between the Nei's standard genetic distance (Ds) matrix values of population pairs and the geographic distances between the samples collected was investigated by using the MANTEL test (Mantel, 1967), which detected no relationship between geographical distance and genetic distance, as manifested by the values for genetic differences (y = 0.0008x + 0.0833, R2 = 0.0381, P = 0.120).
Takezaki and Nei (1996) showed that Nei's Ds genetic distance method is the most appropriate method for obtaining the correct phylogenetic tree topology in microsatellite analysis when the variation in the population is high and the genetic distances between population pairs are used to construct neighbour-joining (NJ) trees. In the present study, the phylogenetic tree was created by employing the NJ method, as applied in the standard genetic distance method of Nei (1972). Its application allocated the non-migratory populations, Zln2, Krs2, Mrd2, Dlc2, Kckp and Hsnb, to the same group, and the migratory and non-migratory populations that use the same river for spawning, except for the Zln1 population, to different groups. Within the Lake Van samples, the Ttvn population was close to the Erck population, whereas the Erciş and Vnsk samples were close to the Mrd1 and Gzls populations. In addition, the population closest to the genetically most distant Nzk population was the Dlc1 population.
The “Structure” analysis method developed by Pritchard et al. (2000) was used to examine the subject of which group the individuals in populations belong to in terms of the microsatellite loci studied. In agreement with the FST values, the clustering methods tended to generate congruent results across the range of K values examined. As seen in Figure 3, the Delta K value was determined to be 3. In other words, this result allows us to interpret the similarities and mixing ratios of the clusters visually, by assuming three ancestral populations. Every individual is included in a population represented by a certain colour. Colour clusters created with individuals next to each other visually show how genetically similar individuals are in a population and how similar the genotypic compositions of multiple populations are, making it easier to understand relationships. Among these clusters, the Lake Van (Ttvn, Ercs and Vnsk) populations, together with populations that display migratory behaviour for reproduction (green) are distinct from the non-migratory populations (Krs2, Mrd2, Dlc2 and Zln2), Koçköprü dam lake (Kckp) population, and Hasanabdal (Hsnb) populations taken from different points of the same dam lake (blue). In addition, the Nzk population, which is an isolated group, and particularly the Dlc1 population, differ from the other groups so are represented by a different colour (red).
The bottleneck analysis was performed by using two significance tests under the “Two-Phase Mutation Model” (TPM). In selecting the TPM, the proposition of Piry et al. (1999) and Di Rienzo et al. (1994) that the two-phase model gives better results for microsatellite data was accepted. This model uses both of the other two models (Infinite Allele Model (IAM) and Stepwise Mutation Model (SPM)), and these models are used at different ratesin different simulations. In addition, the sign test results showed that the loci in only two populations (Dlc2 and Hsnb) had more heterozygote excess than expected. Moreover, the significance test results revealed that 11 of the 18 populations in the Lake Van basin, namely Gzls, Engs, Erck, Ercs, Kckp, Krmc, Krs1, Mrd1, Ttvn, Zln2 and Zln1, are threatened with extinction.
Considering that the Erck population consists of fish transported from Lake Van, heterozygosity deficiency in loci can be explained by the founder effect. However, looking at the other populations, the most important cause of the genetic bottlenecks is that all of them are exposed to excessive fishing pressure during migration from the lake to the rivers, especially during the spawning period; Sarı (2008) reported that the stock of this species decreased through illegal fishing during spawning migration. The same author stated that sand and gravel quarries and domestic and contamination of rivers with industrial waste also substantially decreases stocks. The results obtained in this study justify the serious concerns held for the future of the tarek, which is an endemic species that was regarded asin danger of extinction at the level of “Data Deficient” as far back as 1996, and “Near Threatened” in 2014 (Freyhof, 2014), and since 2014 has been on the IUCN Red List.
5 Conclusions
This study marks the first attempt to evaluate the genetic diversity of the endemic tarek populations in eastern Turkey by using microsatellite markers. The high polymorphic information content and the high number of alleles showed that the selected markers could be used for future population studies on the tarek. The population structure analysis identified three main groups that can be considered different conservation units when applying a management plan. The genetic differentiation between populations and the non-significance of correlation for geographical distance indicate that habitat conditions are responsible for genetic variations in the tarek populations and may be the primary factor affecting population genetic structure. In addition, when the differences in the percentages of variance components between sampling locations were determined, the geographical diversity between sampling locations was greater than the habitat difference in the sampling locations. Most of the studied populations (11 of 18; Gzls, Engs, Erck, Ercs, Kckp, Krmc, Krs1, Mrd1, Ttvn, Zln2 and Zln1) are threatened with extinction, and the Erck, Krmc, Krs1, Ttvn and Vnsk populations have low genetic diversity. It is therefore imperative that urgent action be taken to address this dire threat to the tarek.
A sustainable fisheries management plan was prepared for the tarek in 1996 and implemented in several stages, but it has not been sufficiently respected and properly enforced. If the current management regime and harmful activities continue, the tarek, which is an iconic local species of great economic and cultural importance, will continue its slide towards extinction through the loss of abundance and the erosion of its genetic diversity. Therefore, an updated management plan that includes an enforcement strategy that prevents or at least minimizes illegal fishing practices and activities that modify river beds and otherwise damage tarek habitat, and that increases the cooperation of people living near the rivers, which have a major impact on fish during the spawning period, is essential.
Funding
This scientific research was funded by a government grant from The Scientific and Technological Research Council of Turkey (TUBITAK), Directorate of Academic Research Funding Programmes (ARDEB), (Project No: TBAG-209T029).
Acknowledgement
The authors thank Dr Gregory. T. Sullivan for proofreading earlier versions of this manuscript.
References
- Aljumaah RS, Musthafa MM, Al-Shaikh MA, Badri OM, Hussein MF. 2012. Genetic diversity of Ardi goat based on microsatellite analysis. Afr J Biotechnol 11: 16539–16545. [Google Scholar]
- Angers B, Magnan P, Plante M, Bernatchez L. 1999. Canonical correspondence analysis for estimating spatial and environmental effects on microsatellite gene diversity in brook charr (Salvelinus fontinalis). Mol Ecol 8: 1043–1053. [Google Scholar]
- Araújo AMD, Guimarães SEF, Machado TMM, Lopes PS, Pereira CS, Silva FLRD, Rodrigues MT, Columbiano VDS, Fonseca CGD. 2006. Genetic diversity between herds of Alpine and Saanen dairy goats and the naturalized Brazilian Moxotó breed. Genet Mol Biol 29: 67–74. [Google Scholar]
- Beardmore JA, Mair GC, Lewis RI. 1997. Biodiversity in aquatic systems in relation to aquaculture. Aquac Res 28: 829–839. [Google Scholar]
- Bektaş Y, Aksu I, Kaya C, Baycelebi E, Küçük F, Turan D. 2020. Molecular systematics and phylogeography of the genus Alburnus Rafinesque, 1820 (Teleostei, Leuciscidae) in Turkey. Mitochondrial DNA A DNA Mapp Seq Anal 31: 273–284. [PubMed] [Google Scholar]
- Belkhir K. 2004. GENETIX 4.05, logiciel sous Windows TM pour la génétique des populations. http://www.genetix.univ-montp2.fr/genetix/genetix.htm. [Google Scholar]
- Birky CW, Maruyama T, Fuerst P. 1983. An approach to population and evolutionary genetic theory for genes in mitochondria and chloroplasts, and some results. Genetics 103: 513–527. [PubMed] [Google Scholar]
- Bostancı D, Polat N. 2011. Age and growth of Alburnus tarichi (Güldenstädt, 1814): an endemic fish species of Lake Van (Turkey). J Appl Ichthyol 27: 1346–1349. [Google Scholar]
- Bostanci D, Polat N, Kurucu G, Yedier S, Kontaş S, Darçin M. 2015. Using otolith shape and morphometry to identify four Alburnus species (A. chalcoides, A. escherichii, A. mossulensis and A. tarichi) in Turkish inland waters. J Appl Ichthyol 31: 1013–1022. [Google Scholar]
- Briolay J, Galtier N, Brito RM, Bouvet Y. 1998. Molecular phylogeny of cyprinidae inferred from cytochrome b DNA Sequences. Mol Phylogenet Evol 9: 100–108. [Google Scholar]
- Brookes MI, Graneau YA, King P, Rose OC, Thomas CD, Mallet JLB. 1997. Genetic analysis of founder bottlenecks in the rare British butterfly Plebejus argus . Conserv Biol 11: 648–661. [Google Scholar]
- Canon J, García D, García‐Atance MA, Obexer‐Ruff G, Lenstra JA, Ajmone‐Marsan P, Dunner S, Econogene Consortium. 2006. Geographical partitioning of goat diversity in Europe and the Middle East. Anim Genet 37: 327–334. [PubMed] [Google Scholar]
- Castric V, Bonney F, Bernatchez L. 2001. Landscape structure and hierarchical genetic diversity in the brook charr, Salvelinus fontinalis. Evol 55: 1016–1028. [Google Scholar]
- Chapuis MP, Estoup A. 2007. Microsatellite null alleles and estimation of population differentiation. Mol Biol Evol 24: 621–631. [CrossRef] [PubMed] [Google Scholar]
- Çiftçi Y, Isik MA, Alkevli T, Yeşilova Ç. 2008. Van Gölü Havzasının Çevre Jeolojisi (Environmental Geology of lake Van Basin). Jeol Müh Derg 32: 45–77 (in Turkish). [Google Scholar]
- Çilingir Yeltekin A, Oğuz AR. 2018. Antioxidant responses and DNA damage in primary hepatocytes of Van fish (Alburnus tarichi, Güldenstadt 1814) exposed to nonylphenol or octylphenol. Drug Chem Toxicol 41: 415–423. [PubMed] [Google Scholar]
- Clavero M, Hermoso V, Aparicio E, Godinho FN. 2013. Biodiversity in heavily modified waterbodies: native and introduced fish in Iberian reservoirs. Freshw Biol 58: 1190–1201. [Google Scholar]
- Crow JF, Kimura M. 1970. An Introduction to Population Genetics Theory, New York, Harper and Row. pp. xiv+591 pp. [Google Scholar]
- Crow JF. 1986. Basic concepts in population, quantitative, and evolutionary genetics. WH Freeman and Company. [Google Scholar]
- Dávila SG, Gil MG, Resino-Talaván P, Campo JL. 2009. Evaluation of diversity between different Spanish chicken breeds, a tester line, and a White Leghorn population based on microsatellite markers. Poult Sci 88: 2518–2525. [Google Scholar]
- DeWoody JA, Avise JC. 2000. Microsatellite variation in marine, freshwater and anadromous fishes compared with other animals. J Fish Biol 56: 461–473. [Google Scholar]
- Dharmarajan G, Beatty WS, Rhodes Jr OE. 2013. Heterozygote deficiencies caused by a Wahlund effect: dispelling unfounded expectations. J Wildl Manage 77: 226–234. [Google Scholar]
- Di Rienzo A, Peterson AC, Garza JC, Valdes AM, Slatkin M, Freimer NB. 1994. Mutational processes of simple-sequence repeat loci in human populations. PNAS 91: 3166–3170. [Google Scholar]
- Dorafshan S, Shafee Z, Keivany Y. 2014. A study on genetic differentiation in two species of Iranian bleaks, (Alburnus mossulensis) and (Alburnus caeruleus) (Teleostei, Cyprinidae) using simple sequence repeats. Casp J Environ Sci 12: 197–204. [Google Scholar]
- Dorji N, Duangjinda M, Phasuk Y. 2012. Genetic characterization of Bhutanese native chickens based on an analysis of Red Junglefowl (Gallus gallus gallus and Gallus gallus spadecieus), domestic Southeast Asian and commercial chicken lines (Gallus gallus domesticus). Genet Mol Biol 35: 603–609. [PubMed] [Google Scholar]
- Dubut V, Martin JF, Costedoat C, Chappaz R, Gilles A. 2009. Isolation and characterization of polymorphic microsatellite loci in the freshwater fishes Telestes souffia and Telestes muticellus (Teleostei: Cyprinidae). Mol Ecol Resour 9: 1001–1005. [Google Scholar]
- Elp M, Çetinkaya O. 2000. İnci Kefali (Chalcalburnus tarichi Pallas, 1811)'nin üreme biyolojisi üzerine bir araştırma. IV. Doğu Anadolu Su Ürünleri Sempozyumu, Erzurum, Turkey, pp. 51– 66. [Google Scholar]
- Elp M, Şen F, Atıcı AA. 2014. The Distribution Area of Tarek (Alburnus tarichi (Guldenstaedtii, 1814)) in the Van Lake Basin. YYU J Agr Sci 24: 228–232. [Google Scholar]
- Estoup A, Angers B. 1998. Microsatellites and minisatellites for molecular ecology: theoretical and empirical considerations, in: G. Carvalho (Ed.), Advances in Molecular Ecology, IOS Press, Amsterdam, pp. 55– 86. [Google Scholar]
- Evanno G, Regnaut S, Goudet J. 2005. Detecting the number of clusters of individuals using the software STRUCTURE: a simulation study Mol Ecol 14: 2611–2620. [CrossRef] [PubMed] [Google Scholar]
- Excoffier L, Smouse PE, Quattro JM. 1992. Analysis of molecular variance inferred from metric distances among DNA haplotypes: application to human mitochondrial DNA restriction data. Genetics 131: 479–491. [PubMed] [Google Scholar]
- Excoffier L, Lischer HE. 2010. Arlequin suite ver 3.5: a new series of programs to perform population genetics analyses under Linux and Windows. Mol Ecol Resour 10: 564–567. [Google Scholar]
- FAO. 2020. Fishery and Aquaculture Statistics. Global capture production 1950–2018 (FishstatJ). In: FAO Fisheries Division, Rome. www.fao.org/fishery/statisticssoftware/fishstatj/en (accessed October, 2020). [Google Scholar]
- Freyhof J. 2014. Alburnus tarichi. The IUCN Red List of Threatened Species 2014: e.T4375 A19222678. http://dx.doi.org/10.2305/IUCN.UK20141.RLTS.T4375A19222678.en [Google Scholar]
- Geiger MF, Herder F. Monaghan MT, Almada V, Barbieri R, Bariche M, Berrebi P, Bohlen J, CasalLopez M, Delmastro GB, et al. 2014. Spatial heterogeneity in the Mediterranean Biodiversity Hotspot affects barcoding accuracy of its freshwater fishes. Mol Ecol Resour 14: 1210–1221. [Google Scholar]
- Guo SW, Thompson EA. 1992. Performing the exact test of Hardy-Weinberg proportion for multiple alleles. Biometrics 361–372. [Google Scholar]
- Hartl DL, Clark AG. 1997. Principles of population genetics (Vol. 116) Sinauer Associates, Sunderland, MA. [Google Scholar]
- Hoffman JI, Amos W. 2005. Microsatellite genotyping errors: detection approaches, common sources and consequences for paternal exclusion. Mol Ecol 14: 599–612. [PubMed] [Google Scholar]
- Kaczmarczyk D. 2019. Techniques based on the polymorphism of microsatellite DNA as tools for conservation of endangered populations. Appl Ecol Environ Res 17: 1599–1615. [Google Scholar]
- Kalinowski ST, Taper ML, Marshall TC. 2007. Revising how the computer program CERVUS accommodates genotyping error increases success in paternity assignment. Mol Ecol 16: 1099–1106. [CrossRef] [PubMed] [Google Scholar]
- Kaptaner B, Kankaya E, Dogan A, Durmuş A. 2016. Alterations in histology and antioxidant defense system in the testes of the lake Van fish (Alburnus tarichi Güldenstädt, 1814). Environ Monit Assess 188: 474. [PubMed] [Google Scholar]
- Keskin E, Atar HH. 2013. DNA barcoding commercially important fish species of Turkey Mol Ecol Resour 13: 788–797. [Google Scholar]
- Ketmaier V, Finamore F, Largiader C, Milone M, Bianco PG. 2009. Phylogeography of bleaks Alburnus spp. (Cyprinidae) in Italy, based on cytochrome b data. J Fish Biol 75: 997–1017. [PubMed] [Google Scholar]
- Khaefi R, Esmaeili HR, Ansari MH, Ebrahimi M. 2018. Genetic diversification and population structure of Barbus cyri De Filippi, 1865 (Teleostei: Cyprinidae) in northern Iran inferred from the mitochondrial D-loop gene sequence. Environ Biol Fishes 101: 181–192. [Google Scholar]
- Kubanç N, Eldem V, Kubanç C. 2016. The complete mitochondrial genome of Alburnus tarichi (Teleostei, Cyprinidae). Mitochondrial DNA A DNA Mapp Seq Anal 27: 1243–1244. [PubMed] [Google Scholar]
- Larno V, Launey S, Devaux A, Laroche J. 2005. Isolation and characterization of microsatellite loci from chub Leuciscus cephalus (Pisces: Cyprinidae). Mol Ecol Notes 5: 752–754. [Google Scholar]
- Leprieur F, Beauchard O, Blanchet S, Oberdorff T, Brosse S. 2008. Fish invasions in the world's river systems: when natural processes are blurred by human activities. PLoS Biol 6: e28. [PubMed] [Google Scholar]
- Longwu G, Haifeng J, Guangxiang T, Cuiyun L, Chao L, Wei X. 2013. Isolation and characterization of twenty microsatellite markers for the endangered fish Alburnus chalcoides . Conserv Genet Resour 5: 849–851. [Google Scholar]
- Mangit F, Yerli SV. 2018. Systematic evaluation of the genus Alburnus (Cyprinidae) with description of a new species. Hydrobiologia 807: 297–312. [Google Scholar]
- Mantel N. 1967. The detection of disease clustering and a generalized regression approach. Cancer Res 27: 209–220. [Google Scholar]
- Marshall TC, Slate JBKE, Kruuk LEB, Pemberton JM. 1998. Statistical confidence for likelihood‐based paternity inference in natural populations. Mol Ecol 7: 639–655. [CrossRef] [PubMed] [Google Scholar]
- Miller LM, Kapuscinski AR. 1997. Historical analysis of genetic variation reveals low effective population size in a northern pike (Esox lucius) population. Genetics 147: 1249–1258. [PubMed] [Google Scholar]
- Muenzel FM, Sanetra M, Salzburger W, Meyer A. 2007. Microsatellites from the vairone Leuciscus souffia (Pisces: Cyprinidae) and their application to closely related species. Mol Ecol Notes 7: 1048–1050. [Google Scholar]
- Nei M. 1972. Genetic distance between populations. Am Nat 106: 283–292. [Google Scholar]
- O'connell M, Wright JM. 1997. Microsatellite DNA in fishes. Rev. Fish Biol Fish . 7: 331–363. [Google Scholar]
- Ohta T, Kimura M. 1973. A model of mutation appropriate to estimate the number of electrophoretically detectable alleles in a finite population. Genet Res 22: 201–204. [PubMed] [Google Scholar]
- Perea S, Böhme M, Zupančič P, Freyhof J, Šanda R, Özuluğ M, Abdoli A, Doadrio I. 2010. Phylogenetic relationships and biogeographical patterns in Circum-Mediterranean subfamily Leuciscinae (Teleostei, Cyprinidae) inferred from both mitochondrial and nuclear data. BMC Evol Biol 10: 1–27. [PubMed] [Google Scholar]
- Piry S, Luikart G, Cornuet JM. 1999. Computer note. BOTTLENECK: a computer program for detecting recent reductions in the effective size using allele frequency data. J Hered 90: 502–503. [Google Scholar]
- Pritchard JK, Stephens M, Donnelly P. 2000. Inference of population structure using multilocus genotype data. Genetics 155: 945–959. [Google Scholar]
- Rice WR. 1989. Analyzing tables of statistical tests. Evolution 43: 223–225. [CrossRef] [PubMed] [Google Scholar]
- Roon DA, Thomas ME, Kendall KC, Waits LP. 2005. Evaluating mixed samples as a source of error in non‐invasive genetic studies using microsatellites. Mol Ecol 14: 195–201. [PubMed] [Google Scholar]
- Rousset F. 1997. Genetic differentiation and estimation of gene flow from F-statistics under isolation by distance. Genetics 145: 1219–1228. [PubMed] [Google Scholar]
- Ryman N, Leimar O. 2008. Effect of mutation on genetic differentiation among nonequilibrium populations. Evolution 62: 2250–2259. [PubMed] [Google Scholar]
- Sarı M. 1997. Selectivity of Nets Used in Pearl Mullet (Chalcalburnus tarichi, Pallas 1811) Fishing, Mediterranean Fisheries Congress, 9–11 April 1997, İzmir. pp. 93– 102. [Google Scholar]
- Sarı M. 2008. Threatened fishes of the world: Chalcalburnus tarichi (Pallas 1811) (Cyprinidae) living in the highly alkaline Lake Van, Turkey. Environ Biol Fishes 81: 21–23. [Google Scholar]
- Sarı M. 2001. Van Gölü İnci Kefalı (Chalcalburnus tarichi, Pallas 1811) Stok Miktarının Tahmini ve Balıkçılık Yönetim Esaslarının Belirlenmesi. (The stock assessment of Chalcalburnus tarichi (Pallas 1811) in the Lake Van and the determination of the basis of fishery management). Istanbul, Çekul Scientific series. pp. 150. [Google Scholar]
- Saygın S, Özpiçak M, Mahmut ELP, Polat N, Atıcı AA, Ödün NA. 2017. Comparative analysis of otolith features of Tarek (Alburnus tarichi (Güldenstädt, 1814)) from different lakes across Van basin (Van, Erçek, Nazik, Aygır) (Turkey). J limnol Freshw Fisheries Res 3: 91–99. [Google Scholar]
- Şen F, Paruğ ŞŞ, Elp M. 2015. Projections on Past, Present and Future of Tarek (Alburnus tarichi, Güldenstädt, 1814). YYU J Agric Sci 25: 347–356. [Google Scholar]
- Sheriff O, Alemayehu K. 2018. Genetic diversity studies using microsatellite markers and their contribution in supporting sustainable sheep breeding programs. Asian J Agric Res 1: 46–51. [Google Scholar]
- Takezaki N, Nei M. 1996. Genetic distances and reconstruction of phylogenetic trees from microsatellite DNA. Genetics 144: 389–399. [PubMed] [Google Scholar]
- Tautz D. 1989. Hypervariability of simple sequences as a general source for polymorphic DNA markers. Nucleic Acids Res 17: 6463–6471. [PubMed] [Google Scholar]
- Turner TF, Dowling TE, Broughton RE, Gold JR. 2004. Variable microsatellite markers amplify across divergent lineages of cyprinid fishes (subfamily Leusicinae). Conserv Genet 5: 279–281. [Google Scholar]
- Van Dyke F. 2003. Conservation Biology: Foundations, Concepts, Applications, McGraw-Hill, Boston, MA [Google Scholar]
- Van Oosterhout C, Hutchinson WF, Wills DP, Shipley P. 2004. MICRO‐CHECKER: software for identifying and correcting genotyping errors in microsatellite data. Mol Ecol Notes 4: 535–538. [Google Scholar]
- Weir BS, Cockerham CC. 1984. Estimating F-statistics for the analysis of population structure. Evolution 1358–1370. [Google Scholar]
- Wright S. 1931. Evolution in Mendelian populations. Genetics 16: 97–159. [PubMed] [Google Scholar]
- Wright S. 1951. The genetical structure of populations. Ann Eugen 15: 323–354. [CrossRef] [MathSciNet] [Google Scholar]
- Wright S. 1978. Evolution and the genetics of populations, vol. 4, Variability within and among natural populations, University of Chicago Press, Chicago. [Google Scholar]
- Yamazaki Y, Uehara K, Ikeya K, Nishio M. 2020. Interpopulational and intrapopulational genetic diversity of the endangered Itasenpara bitterling (Acheilognathus longipinnis) with reference to its demographic history. Conserv Genet 21: 55–64. [Google Scholar]
- Yiğit A, İrak ZT, Öztürk D, Öztürk E, Alpaslan D, Şahan T, Aktaş N. 2017. Determination of water quality by ion characterization of van lake water. Iğdır Univ J Inst Sci Tech 7: 169–179. [Google Scholar]
Cite this article as: Çiftci Y, Eroğlu O, Firidin Ş, Savaş H, Bektaş Y. 2021. Genetic diversity and population structure of Tarek (Alburnus tarichi), an endemic species to the Lake Van basin, Turkey. Aquat. Living Resour. 34: 3
All Tables
Details of sampling study for tarek in the Lake Van basin; sampling locations, coordinates, altitude (m) and sample numbers.
Characteristics of the nine amplified microsatellite loci used in this study for population analysis of the tarek, Alburnus tarichi.
Statistics for genetic variation in 18 populations of A. tarichi with the use of 9 microsatellite loci.
Results of analysis of molecular variance (AMOVA) among different groups ineighteen A. tarichi populations.
Estimates of pairwise FST values (below diagonal) and Nei's Genetic Distance (above diagonal) between eighteen populations of A. tarichi detected in 9 microsatellite loci.
Heterozygosity excess/deficiency under the Two Phase Model (TPM) and all populations and respective Sign and Wilcoxon tests.
Sample number, allele size range and allele numbers of all populations and nine loci.
Summary of microsatellite allele diversity in some Alburnus species and cyprinid fish populations which used the same loci with this study.
All Figures
|
Fig. 1 Sampling points for Alburnus tarichi in the Lake Van basin (the numbers of the sampling locations refer to Tab. 1). |
| In the text | |
|
Fig. 2 Neighbor Joining tree of eighteen populations of A. tarichi in the Lake Van basin, based on Nei's genetic distance. |
| In the text | |
|
Fig. 3 Genetic assignment of the eighteen populations of A. tarichi. (a) Delta-K values; (b) population structure analysis as inferred when K = 3, based on microsatellite data. The genotype of each individual is represented by a vertical line divided into coloured segments and each population is separated by a black line. The abbreviations correspond to the defined populations. |
| In the text | |
Current usage metrics show cumulative count of Article Views (full-text article views including HTML views, PDF and ePub downloads, according to the available data) and Abstracts Views on Vision4Press platform.
Data correspond to usage on the plateform after 2015. The current usage metrics is available 48-96 hours after online publication and is updated daily on week days.
Initial download of the metrics may take a while.