Fig. 3
Download original image
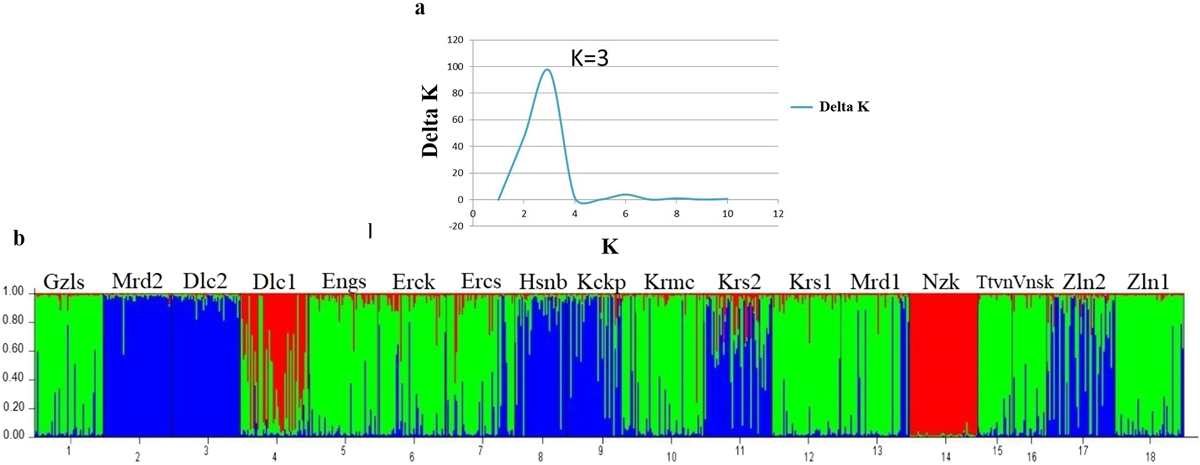
Genetic assignment of the eighteen populations of A. tarichi. (a) Delta-K values; (b) population structure analysis as inferred when K = 3, based on microsatellite data. The genotype of each individual is represented by a vertical line divided into coloured segments and each population is separated by a black line. The abbreviations correspond to the defined populations.
Current usage metrics show cumulative count of Article Views (full-text article views including HTML views, PDF and ePub downloads, according to the available data) and Abstracts Views on Vision4Press platform.
Data correspond to usage on the plateform after 2015. The current usage metrics is available 48-96 hours after online publication and is updated daily on week days.
Initial download of the metrics may take a while.