


| Issue |
Aquat. Living Resour.
Volume 39, 2026
Special Issue - Small pelagic fish in changing social-ecological systems
|
|
|---|---|---|
| Article Number | 13 | |
| Number of page(s) | 16 | |
| DOI | https://doi.org/10.1051/alr/2026006 | |
| Published online | 29 May 2026 | |
Research Article
Fish quality jeopardises the French small pelagic social-ecological system
1
DECOD, L’Institut Agro, Ifremer, INRAE, Plouzané, France
2
Ifremer, University of Brest, CNRS, UMR 6308, AMURE, Unité d’Économie Maritime, IUEM, Plouzané, France
3
DECOD, L’Institut Agro, Ifremer, INRAE, Lorient, France
4
MARBEC, Univ Montpellier, CNRS, Ifremer, IRD, Avenue Jean Monnet, Sète, France
5
DECOD, L’Institut Agro, Ifremer, INRAE, Nantes, France
6
Parc Naturel Marin d’Iroise – Office Français de la Biodiversité, Pointe des Renards, Le Conquet, France
* Corresponding author: This email address is being protected from spambots. You need JavaScript enabled to view it.
Received:
12
December
2025
Accepted:
30
April
2026
Abstract
Fish quantity has long been the most needed information for stock management as the main source of uncertainty for the fishing sector. However, as the rate of global environmental change accelerates, degradation of fish quality has become a new source of concern. Indeed, evidence is accumulating on a general decrease in fish size and fat content and on the increase of the occurrence of various contaminants. Small pelagic fishes (SPFs) are valuable food rich in fatty acids but, for this reason, are also prone to the accumulation of organic pollutants. While environmental impacts on fish quality are increasingly documented, knowledge on how these propagate to the fishing industry is still very limited. In our study we explored how the various components of the SPF French social-ecological system, from plankton to fish to fishers to the canning industry and the market, interact in their response to global change. First, by analysing the national catches of sardine and anchovy from 2000 to 2024 across the three French maritime regions, we highlighted the strong seasonal dynamics of both fisheries and the strong interannual trends over the period. Second, focusing on Bay of Biscay sardines, we revealed that on both seasonal and interannual scales, the fishing sector was caught between a bottom-up environmental control through its effects on fish quality, namely fat content and size, and a top-down control resulting from canning industry strategies in provisioning and marketing, ultimately mediated by the preferences of consumers. The fishing fleets appeared as the most vulnerable component in the system, while the processing industry appeared more flexible. Our results indicate that a decrease in fish quality can threaten an entire fishing industry. We recommend collaborative efforts between scientists and stakeholders to co-construct adaptation strategies aiming at strengthening the resilience of fisheries social-ecological systems in the face of global change.
Key words: Sardine / anchovy / fat content / size / Bay of Biscay / supply network
Handling Editor: Satoshi Yamazaki
© M. Huret et al., Published by EDP Sciences, 2026
 This is an Open Access article distributed under the terms of the Creative Commons Attribution License (https://creativecommons.org/licenses/by/4.0), which permits unrestricted use, distribution, and reproduction in any medium, provided the original work is properly cited.
1 Introduction
Evidence is growing on the impact of global change on the productivity of food systems, their economic sectors, and, consequently, food security (Myers et al., 2017; Wheeler and von Braun, 2013; IPCC, 2023). So far, evaluation of these impacts has focused primarily on food quantity, i.e., the yield of food systems, rather than on food quality and safety, although the evidence has long been available that agriculture and fisheries may suffer from a reduction in protein or lipid content and an increase in contaminants (Shalders et al., 2022; Vermeulen et al., 2012).
Natural food resources, mostly represented nowadays by seafood, are particularly sensitive to climate change through the modification in the structure and functioning of marine ecosystems. One noticeable trend is towards a reduced productivity (Atkinson et al., 2024) and shrinking size of many organisms (Gardner et al., 2011; Sheridan and Bickford, 2011), among them fish (Cheung et al., 2013; Daufresne et al., 2009; Lindmark et al., 2022). Projections also alert to a reduction in omega-3 fatty acids in marine food webs and, thus, for human populations through fish consumption (Colombo et al., 2020). In addition, there are more and more concerns about the safety of seafood from various threats, among them harmful algae, heavy metals (Shalders et al., 2022), or organic pollutants (Suominen et al., 2011). While seafood constitutes an important source of fatty acids and micronutrients for the human population, there is an urgent need to better understand how the effects of global changes propagate through, or disrupt, the fisheries’ social-ecological systems (Perry et al., 2010; Salgueiro-Otero and Ojea, 2020) so that we can build solutions for its resilience and sustainability (Mason et al., 2022; Subramaniam et al., 2023) and guarantee food security. In this paper, our definition of the fisheries social-ecological systems encompasses the fish, its environment, the fishing industry, and the final consumers. The fishing industry encompasses the fishing sector (the activity of fishing itself) but also the fish processing sector as a major intermediate actor between fishers and final consumers.
Small pelagic fish (hereafter SPF) make up ∼25% of total fish landings globally (FAO, 2022) and, being fatty fish, are considered a key source of essential fatty acids for both direct consumption and fish oil/meal production (Robinson et al., 2022). As short-lived and planktivorous species, they are highly sensitive to environmental variability, both on the seasonal and interannual scales. This has driven a long-standing research effort to understand the impact of climate variability on their dynamics (Peck et al., 2021) and, more recently, on their fisheries and related industries through social-ecological integrated approaches (Quezada-Escalona et al., 2025). However, as in other food systems, much less effort has been devoted to analysing the impact of SPF quality on fishing industries when compared with studies on SPF quantity. In their recent review of the socio-economic impacts of changes in SPF abundance, distribution, and quality across 13 case studies, Quezada-Escalona et al. (2025) described only three cases relating to quality and more specifically to anchovy size in the Tyrrhenian Sea (Italy), the Bay of Biscay, and offshore Peru.
Yet, evidence of decreasing SPF quality is spreading worldwide with social and economic consequences. Body condition and/or size at age has decreased in many Mediterranean stocks of sardine and anchovy (Brosset et al., 2017), in anchoveta of the Humboldt system (Canales et al., 2018), in sardine of the Benguela system (Jarre et al., 2015), in herring of the northern Baltic Sea (Rajasilta et al., 2019), and in anchovy and sardine in the Bay of Biscay (Doray et al., 2018a; Taboada et al., 2024; Véron et al., 2020). This had impacts on the fishery industries, from the fisheries sectors to the processing companies. In the Gulf of Lion, the pelagic trawlers have shifted to more profitable demersal species (Saraux et al., 2019), and the supply to the canning industry consequently stopped. In the Tyrrhenian Sea, purse-seiners now have to remain close to harbour to limit fuel consumption while being in competition with imports from the Adriatic (Quezada-Escalona et al., 2025). In the Humboldt system, increased mixing of anchoveta with juveniles complicated the management of the fishery and destabilised the processing industry (Quezada-Escalona et al., 2025). In the Bay of Biscay, despite a recovery of the anchovy biomass in the early 2010s, low fish size combined with the restructuring of the Spanish market during the anchovy fishery closure did not allow the French fishing sector to recover (Beckensteiner et al., 2024).
There is a long history of SPF fishery in France, both along the Mediterranean (Beveren et al., 2016) and the Atlantic (Le Floc’h et al., 2023) coasts (Fig. 1), with some market interactions reported between these regions (Le Floc’h et al., 2020). SPF are targeted by pelagic trawlers in the Mediterranean Sea (Beveren et al., 2016) and in the English Channel (including the extreme south of the North Sea in our study), and by both trawlers and purse seiners in the Bay of Biscay (Lahellec et al., 2024), mostly for provisioning the canning industry (Le Floc’h et al., 2020) and, to a lesser extent, for the fresh market, with a strong heritage value in several regions. Sardines are the first fish species landed in quantity in France in 2024, complemented by important imports that feed a large proportion of consumers, with 48% of the French population buying them canned and 8% fresh (FranceAgriMer, 2025). Anchovy is mostly exported to Spain (Beckensteiner et al., 2024).
In our study, we aimed to explore the temporal dynamics of the social-ecological system (SES) of the French SPF fishing industry, the role of fish quality in its structuring, and the evolution of its vulnerability over the last 25 years (2000–2024), which were some of the objectives of a national project DEFIPEL. This required gathering data and knowledge across various components of the system at multiple temporal and spatial scales. To reach that goal, our project involved scientists from different disciplines spanning from oceanography to fisheries science and economy, as well as stakeholders representing the fishing sector and canning industries. To identify the most important events that structured the fisheries over the period and across the three French maritime regions, we first explored the space-time variability of sardine and anchovy catches by French fisheries at the national scale to extract the main patterns of variability characterising their dynamics. We then focused our analysis on sardines of the Bay of Biscay, for which a more comprehensive and interdisciplinary dataset was available through all components of the SES, the fishing industry being more developed in France than for anchovy. More specifically, we explored the variability of time series of indicators of the whole sardine SES on both the seasonal and interannual scales and the links between them, with a special interest in the constraint imposed by fish quality on the industry. In the discussion, the temporal dynamics and controlling drivers within the SES and their potential impacts on its resilience were compared in terms of similarities and specific features with the described past dynamics of Bay of Biscay anchovy (Bueno-Pardo et al., 2020; Taboada and Anadón, 2016) and its consequences on markets (Beckensteiner et al., 2024), as well as with what was highlighted on the dynamics of both species in the Gulf of Lion (Saraux et al., 2019).
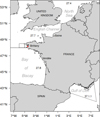 |
Fig. 1 Map of the studied area with the 3 maritime regions where the French small pelagic fishery operates. Statistical rectangles 25E4 and 25E5 drawn at the tip of Brittany are included in the Bay of Biscay when considering sardine catches (see text). The PNMI Marine Protected Area is also located at the tip of Brittany and operates a seasonal egg sampling in the Bay of Douarnenez (red dot). |
2 Materials and methods
2.1 Data description
We built a set of indices to characterise the evolution of all the components of the SPF SES in France, which we introduced in specific sub-sections below and in Table 1. Most indices are annual to describe the evolution of the SES over the years; others were computed with a monthly resolution to describe its seasonal dynamics.
List of the indices used in the analyses of the small pelagic social-ecological system, together with their period of availability, source and reference, region of interest and type of analysis conducted. The latter refers to the statistical subsection of the ‘Materials and methods’ section. The slopes of the annual linear trends are provided only when significant (p < 0.05*, p < 0.01**, p < 0.001***), otherwise only unit is indicated.
2.1.1 Environment
Environmental seasonality was characterised by analysing temperature and zooplankton, which constitute the primary prey of small pelagic fish. We used ecosystem model outputs as the only data available at the scale of the Bay of Biscay and covering the vertical dimension. The Seapodym reanalysis product (https://doi.org/10.48670/moi-00020) from the E.U. Copernicus Marine Service was the only such modelling product providing zooplankton over the time series 2000–2024. We built monthly climatologies of both temperature and zooplankton from this daily product, using values averaged over the depth of the euphotic zone.
For the interannual analysis, we have chosen size-resolved zooplankton collected during the PELGAS integrated survey occurring each year in May in the Bay of Biscay (Doray et al., 2018b). Mesozooplankton were sampled each year between 2006 and 2024 at approximately 60 stations with a WP2 net (180 μm mesh size) hauled vertically from 100 m (or bottom) to the surface. Size fractionation was performed onboard by successive wet sieving, then filtered samples were frozen before dry weight was measured in the lab on the following fractions: 200–500 μm, 500–1000 μm, 1000–2000 μm, and above 2000 μm. In order to perform simple statistics based on a comparable amount of data between years, we processed on-station zooplankton data with the block averaging method, a simple spatial smoothing procedure, using a 0.25° grid resolution (Doray et al., 2018b).
2.1.2 Fish
Following Kenyon et al. (2022), we collected datasets on sardine fat content from three major canning factories along the French Atlantic coast. These factories measure the water content of each batch of sardine they receive. We only kept in the analysis the batches provisioned from fishing in the Bay of Biscay, excluding those imported. At reception, the fillets of 20 fish taken randomly are grinded, from which 5 g are set in an infrared dryer at 130°C until stabilisation of the sample weight. Then the water content is converted into fat content using the following linear relationship: Fat% = a − b × Water% (R2 > 0.95). This relationship is consolidated with new data every year by a certified laboratory (Labexia, Quimper, France) using the official methodology to measure fat content, i.e., hydrolysis and extraction by a solvent. The linear relationship between water content and energy density is well known for many species across taxa (Weil et al., 2019), including SPF (Gatti et al., 2018). Since lipids make most of the reserves of SPF, they explain most of its energy density variations. Thus, water content is also a very good predictor of the lipid content (Favreau et al., 2025a). Being based on species proximal composition, the relationship is stable through time when established with sufficient data, and only the relative content of water and fat may vary over seasons or years (Favreau et al., 2025b). The most recently calculated coefficients provided by the canning industry (a = 84.987, b = 1.08526; 2023 estimates) were applied to the whole time series of sardine water content measurements to ensure comparability over time. Factories provided datasets covering various periods, 2007–2024 for the longest and 2014–2024 for the shortest. The whole dataset was exploited to explore the seasonal variability of fat content. Only data from the months July to October were averaged to build an annual indicator, as they were in sufficient numbers for a robust comparison between years and revealed the most interesting inter-annual variability.
The sardine mean length-at-age, weight-at-age, mean population weight and length, and age distribution (expressed as the percentage of individuals at each age relative to total population abundance) for the Bay of Biscay stock were estimated as described in Doray et al. (2021) from the PELGAS survey between 2000 and 2024. Spawning stock biomass and fishing mortality and their associated uncertainties were taken from the stock assessment (ICES, 2025).
The spawning activity of sardines was monitored in a representative area of the Bay of Biscay, the Parc Naturel Marin d’Iroise (PNMI), a marine protected area located at the tip of Brittany where a large part of the activity of purse-seiners exploiting the Bay of Biscay stock takes place. Every month the PNMI sampled meso-zooplankton through vertical hauls with a WP2 net in the Bay of Douarnenez. Samples were processed with the ZooScan; fish eggs were then sorted and counted, and concentration was calculated after correcting for the sampled volume.
2.1.3 Fishing
We used the SACROIS dataset (Demaneche et al., 2022) to describe the georeferenced catches of sardine and anchovy by the French fishery between 2000 and 2024. The SACROIS application combines fishers’ declarative data with geolocation data of vessels longer than 12 m (vessel monitoring system) and with sales note data from the auction market to build a reference fishing activity dataset. More specifically, it compiles all the fishing trips of the French vessels (registered in the EU Fishing Fleet Register and >12 m), informing spatial catches by species and fishing effort data series that are validated, consolidated, and qualified. As such, the SACROIS values refer to landings, i.e., the catches without the potential discards, that are estimated as negligible from directed fisheries (ICES, 2025). However, to avoid any confusion, and because we emphasise in our study the spatial location where fishing occurs and not where fish are landed, we prefer referring to catches hereafter. The spatial resolution is provided at the scale of the ICES (International Council for the Exploration of the Sea) statistical rectangles (1° in longitude × 0.5° in latitude) in the Atlantic and on the irregular GFCM (General Fisheries Commission for the Mediterranean) geographical sub-areas (GSA) grid in the Mediterranean Sea. GSAs are not very accurate to describe fishing activity in space, especially in the coastal areas, where the SACROIS product breaks down space within the Gulf of Lion depending on distance to the coast (<6 and <12 nautical miles) and on the French administrative spatial entities called Prud’homies. The sardine catches from the statistical rectangles 25E4 and 25E5, which are part of 27.7 administratively, were included in the Bay of Biscay catches, as they are assessed together with the Bay of Biscay stock and are targeted by its fishery (ICES, 2025).
We further used the SACROIS dataset to extract the vessels with significant sardine catches in the Bay of Biscay, i.e., at least 10 tons a year, and separated two fleets with different gear, behaviour and strategies, namely, the purse seiners operating mostly in Brittany on one hand, and the trawlers made of pelagic and polyvalent trawlers on the other hand that operate on a larger scale from Vendée to Brittany. We then calculated 3 indicators on a yearly basis and for each fleet: (i) the number of vessels targeting sardine, (ii) the dependency on sardine as the percentage of annual revenue made from sardine, and (iii) the share of sardine annual income on sardine realised during the traditionally low fishing season (December to May).
2.1.4 The canning industry, market, and consumption
To analyse the seasonal strategy of the canning industry, we used the same dataset as for fish fat content, compiled from data provided by three major canning industries. As fish can be received frozen, reception dates in the factory could differ from fishing dates by days to months, but both fishing and reception dates were provided. To characterise seasonal provisioning strategies with regard to fish quality that largely depend on the season, we have added by month the number of batches received based on their fishing dates. Unfortunately, the volume of each batch was not made available. We only know it can range from a few hundred kilograms to several tons of fish, and usually the volume is higher during the peak season of fishing (see result section). Fish can originate from various regions, but we only kept sardines from the Bay of Biscay in our analysis.
We built several indicators and followed their trends throughout the period. First, the sardine prices both at first sale in the auction market and at import were compiled from monthly values available from the auction market and from the Eurostat-Comext database (https://ec.europa.eu/eurostat/comext/newxtweb/), respectively. Second, the volume of imported sardines, either fresh or canned for final consumption or frozen for the canning industry, was extracted from the Eurostat-Comext database. Third, the domestic consumption by species and type of products (fresh or canned) was made available by FranceAgriMer based on Kantar Worldpanel, while we did not have access to catering consumption, which can also be important. These market data were available over the 2000–2021 time series.
2.2 Statistical analysis
2.2.1 Space-time analysis of the catches on the national scale
In order to define objectively when and where major events occurred within the SPF fisheries, we explored the space-time patterns of variability of the fishing activity targeting anchovy and sardine in the three French maritime regions by applying empirical orthogonal functions (EOF; Preisendorfer, 1988) analysis to the dataset of georeferenced catches. EOF is a space-time principal component analysis (PCA) decomposing anomalies relative to a mean map into hierarchical spatial modes and their associated temporal amplitude series. Spatial modes, or EOF maps, characterise the hierarchised patterns of spatial variability in the anomalies. EOF amplitude time series describe the variations of spatial modes over time. Furthermore, the local explained variance is the proportion of variance across time explained by a given EOF for each grid cell. That is, when the values are high, or low, in some locations of an EOF map, and the local explained variance is high, then the space-time variability is dynamically relevant to interpret in these locations.
2.2.2 Seasonality in the Bay of Biscay sardine SES
To investigate the seasonal dynamics of the sardine SES in the Bay of Biscay, we built monthly climatologies (i.e., monthly averages computed over years) of selected indices (see Tab. 1). We then used matrices of Pearson correlation coefficients computed on the monthly values of the various indicators to highlight the potential drivers and the interactions between the components of the SES.
2.2.3 Trends in the Bay of Biscay sardine SES
Time series of annual indices were presented over the period 2000–2024 or a shorter period when years were missing (see Tab. 1). Trends were computed based on linear models and were presented only when significant at P < 0.05.
2.3 Consensus elicitation on the SES dynamic and its drivers
Because correlation does not imply causation, most of our exploration and conclusions, especially on the interannual scale, were drawn from visual interpretation of the evolution of indicators based on the expertise of scientists from various disciplines (3 biological oceanographers, 4 fisheries scientists, and 2 fisheries economists). Stakeholders also provided an important contribution to understanding the complex interactions within the industry by sharing their empirical knowledge during the bi-annual meetings of the 4-year-long project DEFIPEL. Furthermore, dedicated inquiries were conducted, during which individual fishers or their representatives were formally questioned on their fishing strategies and canning factories on their provisioning and marketing strategies. These regular exchanges progressively built trust between the project partners so that we reached a consensus on the identification of the factors underlying the observed trends within the SES.
3 Results
3.1 Spatio-temporal patterns of variation in the French catches over 2000–2024
At the national scale, catches were first analysed by main fishing region over the time series (Fig. 2). During the period under analysis, sardines were fished in the 3 areas considered in this study, while anchovies were fished only in the Bay of Biscay and the Gulf of Lion. For sardines, catches from the Gulf of Lion regularly reached more than 10000 tons between 2000 and 2007 before strongly decreasing to values below 1500 tons in the 2010s and becoming negligible after 2020. In the Bay of Biscay, they have been relatively constant in the range of 15000–20000 tons from 2000 to 2006 and in the range of 20000–30000 tons from 2007 to 2023, although there seems to be a decreasing trend over the last few years, with a minimum around 15000 tons in 2024 after a maximum at 29000 tons in 2020. Catches fluctuated between 5000 and 13000 tons in the English Channel from 2000 to 2009, when they suddenly dropped down to an average of 1000 tons in the 2010s and finally increased again over the last 5 years to reach 3000 tons in 2024. The latter increase also occurred in the North Sea, with catches of up to 1500 tons in 2022, while it was negligible before 2020. For anchovies in the Gulf of Lion, catches have regularly decreased from more than 5000 tons in the early 2000s to less than 1500 tons after 2015. In the Bay of Biscay, catches also reached a maximum value of 25000 tons at the beginning of the time series, became negligible between 2005 and 2010 during the closure of the fishery, and never reached the high levels of the early 2000s after the reopening of the fishery in 2010. They even reached a minimum below 100 tons in the early 2020s.
In complement to the simple temporal description of the catches, EOF analysis was performed on the spatially explicit monthly catches to identify areas with the highest space-time variability. For sardines, the first two EOFs explained 28% and 25% of the total space-time variability (Fig. 3 and Fig. A1). The first EOF characterised the interannual variability and revealed a strong, synchronous decrease of catches between 2008 and 2010 in the Gulf of Lion (Mediterranean Sea) and in the Bay of Seine (English Channel). In these areas, the EOF values were positive in the spatial pattern, meaning that the local variation in time correlated positively with the time amplitude (Fig. 3, upper panels). Furthermore, in these 2 areas, the local explained variance was high, meaning that most of the temporal variation could be explained by the amplitude of this first EOF. The second sardine EOF described the strong seasonal variation of the catches along the northern coast of the Bay of Biscay, with high local explained variances (Fig. 3, bottom panels). Catches were low during the first semester and high during the second one.
For anchovy, the space-time patterns of variability of the catches were not as clear as for sardine, with a mix of interannual and seasonal variability in the first two EOFs. Nonetheless, the first EOF explained a large part of the variability (34%) and was driven by the Bay of Biscay alone (Fig. 4 and Fig. A1). It showed high catches before 2005 with strong seasonal variability, followed by negligible catches between 2005 and 2010 during the fishery closure and decreasing catches from 2010 to 2024 by successive periods of 5 years, again with seasonal variability. The second EOF explained 18% of the variability and was mostly driven by an increase of the catches south of the tip of Brittany from before 2005 to after 2010 and a decrease in the Gulf of Lion after 2009, although not highly consistent over time (local variance below 50%).
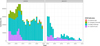 |
Fig. 2 Annual catches of sardine (left) and anchovy (right) by the French fishery based on the SACROIS product. The Bay of Biscay includes the sardine catches from the statistical rectangles 25E4 and 25E5 located in 27.7 but considered part of the Bay of Biscay stock. The English Channel and North Sea catches are considered together when discussed in the text, given the spatial continuity of the French fishing activity in the eastern Channel–southern North Sea area (see Fig. 3). |
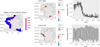 |
Fig. 3 Sardine mean annual catches over 2000–2024 (left panel) with their first 2 EOFs calculated on the catches by month. Spatial patterns of the EOFs are represented (middle panels) together with their temporal amplitudes (right panels). The local explained variance is plotted on the modes of the EOFs, with crosshatches if above 50%, where results are considered reliable for interpretation. |
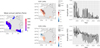 |
Fig. 4 Anchovy mean annual catches (left panel) with their first 2 EOFs calculated on the monthly catches by month. Spatial patterns of the EOFs are represented (middle panels) together with their temporal amplitudes (right panels). The local explained variance is plotted on the modes of the EOFs, with crosshatches if above 50%, where results are considered reliable for interpretation. |
3.2 Seasonal variability in the social-ecological system of sardine in the Bay of Biscay
The variability of the Bay of Biscay sardine SES showed a clear seasonal pattern in all its dimensions (Fig. 5), with the highest values during the second semester and peaks between July and October for most of the represented variables, except for zooplankton and spawning activity. The zooplankton bloom occurred in spring, like sardine spawning, which also showed a secondary, weaker peak in October. Conversely, the minimum values of temperature, fat content, and catches occurred in March. The provisioning of the industry was negligible for the first three months of the year and became significant from June to November. The seasonal correlogram (Fig. A2) between all the variables confirmed the high and significant correlations (R2 > 0.8) between temperature, fat content, catches, and cannery provisioning. Zooplankton was only significantly correlated with the number of eggs spawned (R2 = 0.65).
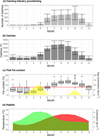 |
Fig. 5 Seasonality in the different dimensions of the sardine social-ecological system of the Bay of Biscay from habitat to fish to the fishery and to the canning industry. (a) Monthly climatology of the number of batches of sardine processed by 3 major canning industries in Brittany. The batches are affected by their fishing month and not their reception month (see text). (b) Monthly climatology of the total catches in the Bay of Biscay. Error bars represent ±1 standard deviation computed on the interannual variability. (c) Monthly climatology of the sardine fat content, with variability calculated from the monthly average values obtained from the different years and 3 canning industries. The red horizontal line draws the limit above which fish can be sold with a quality label in France (‘Label rouge’). The yellow curve represents seasonality in the number of sardine eggs from PNMI sampling. (d) Monthly climatology of the Bay of Biscay temperature (red) and zooplankton (green) concentration (2000–2024). Error bars represent ±1 standard deviation computed from the monthly averaged values obtained from the different years. |
3.3 Interannual trend in the social-ecological system of sardine in the Bay of Biscay
The average concentrations of mesozooplankton per size class in the Bay of Biscay had opposite trends from 2006 to 2024. The biomass of small (0.2–0.5 mm) organisms increased (Fig. 6a and Tab. 1), and large ones (1–2 mm) decreased but not significantly (Fig. 6b), while the biomass of the intermediate size class (not shown) and of the whole mesozooplankton were stable (Fig. 6c), although with large interannual variability. The relative changes in mesozooplankton concentration occurred at a rate equal to 3% per year for small and large size classes.
The length at age has strongly decreased at all ages (Fig. 6d). The mean length of a sardine within the population lost 5 cm (more than 20 cm to less than 15 cm), while its mean weight was divided almost by 3 (70 to 25 g) between 2000 and 2024 (Fig. 6e). This was due to a combination of a decrease in size or weight at all ages (Figs. 6d and 6e) and an increase in the proportion of young sardines, while the oldest sardines tend to disappear (Fig. 6f). The fat content, averaged over the months from July to October when it is highest, has strongly declined (Fig. 6g) from more than 15% of muscle wet weight in the late 2000s to just above 10% after 2020.
The spawning stock biomass has decreased over the time period (Fig. 6h), especially between 2010 and 2012, when the fishing mortality has strongly increased from below 0.3 to above 0.5 (Fig. 6i), and then again after 2018, after which the stock has been considered overfished and overexploited for most of the years.
The number of vessels involved in the sardine catches has strongly declined for the trawlers from 55 in the early 2000s to less than 25 in 2024 (Fig. 6j). The decrease was strongest during the anchovy fishery closure between 2006 and 2010 and then after 2017. The number of purse seiners was relatively stable between 25 and 30 but with a constant decrease after 2018, reaching its lowest value in 2024. The dependency on sardines in terms of annual revenue has increased over the time series for the two fleets, from 50 to more than 75% for the purse seiners and from 25 to more than 50% for the trawlers (Fig. 6k). In the meantime, the share of the annual revenue relying on the ‘low sardine season’ (December to May), i.e., when catches are lowest (see previous section), has increased for the purse seiners (Fig. 6l), highlighting an increased dependency throughout the year. For the trawlers, the share of the annual revenue during the ‘low season’ has decreased (Fig. 6l), so the increase in their annual dependency (Fig. 6k) is mostly due to an increased dependency in the second semester.
The price of frozen imported sardines for the canning industry has strongly fluctuated around 1 €/kg (Fig. 6m). The price of sardines at their first sale in France has generally increased, with strong variations throughout the time series, from an average value close to 0.8 €/kg in 2001 to low values from 2005 to 2010 (<0.6 €/kg) and values higher than 0.8 €/kg between 2015 and 2019, when they reached similar prices to imported sardines. The imported volumes have fluctuated between 2000 and 2021 (Fig. 6n), either as fresh (below 6000T), frozen (between 5000T and 10000T), or canned for consumption (between 12000T and 18000T), the latter being the only one with a slight increasing trend. Finally, consumption patterns showed clear significant trends with a decrease in fresh consumption from 6000T to 3000T, largely compensated by an increase in canned consumption from 12500T to 17500T (Fig. 6o).
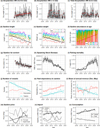 |
Fig. 6 Time series of indices of the sardine social-ecological system in the Bay of Biscay between 2000 and 2024. Mesozooplankton dry weight in May in the range of (a) 0.2–0.5 mm, (b) 1–2 mm, and (c) 0.2–2 mm. Boxplots are produced based on block data after spatial smoothing of the raw data from survey stations. (d) Sardine mean length at age and mean individual length (black); (e) sardine mean weight at age and mean individual weight (black); and (f) sardine proportion at age based on the abundance in May during the PELGAS survey, a linear trend is plotted for age 1 only. (g) Sardine fat content as measured by the canning industry averaged over the months July to October. (h) Spawning stock biomass and (i) fishing mortality from stock assessment. (j) Number of vessels targeting sardine by fleet, (k) income dependency to sardine with respect to the total annual income, and (l) share of sardine income generated in the ‘low’ season (December to May). (m) Price of sardines (in constant 2015 euros) at first sale in auction market or when imported frozen, (n) national import of sardines canned, frozen, or fresh; and (o) French consumption of fresh or canned sardines. Linear trends are plotted when significant at the threshold p-value = 0.05, with slope provided in Table 1. Note that in 2020 PELGAS could not occur because of COVID. |
4 Discussion
In our paper, we have first identified the major patterns of space-time variability in the fishing activity of sardine and anchovy over the three French maritime regions. Considering potential interactions at the national scale, we showed that the activity has concentrated in the Bay of Biscay since 2010 and that variability of the catches at seasonal and interannual scales was of similar magnitude, especially for sardines in the Bay of Biscay. In that region, by thoroughly exploring the different dimensions of the SPF SES based on relevant time series, their covariations in time, and by confronting them with the expert knowledge from scientists and stakeholders, we were able to provide a preliminary, integrated, and credible cause and effect understanding of the evolution of the SES seasonally and over the period 2000–2024.
4.1 Major events over 25 years at the national scale
The decrease of sardine catches occurred almost simultaneously in the Gulf of Lion and in the English Channel between 2008 and 2010, reducing the national catches by approximately 30% between the 2000s and the 2010s. The drivers of these changes in the Gulf of Lion were detailed in Saraux et al. (2019). They were largely caused by the strong and rapid decrease of sardine size that led to a loss of market value, particularly to the canning industry. In the English Channel, the sardine fishery was suddenly closed in 2010 after measurements of high concentrations of polychlorinated biphenils (PCBs) in the Bay of Seine (A. n°10-20, 2020), from where most of the catches of this maritime region occurred. Other regions like the Baltic Sea also contained high concentrations of various persistent organic pollutants (POPs), requiring regulations of fish, especially fatty small pelagics, consumption in the surrounding countries (Airaksinen et al., 2014; Suominen et al., 2011). The progressive restrictions on the use of these compounds in the EU have paid off (Airaksinen et al., 2014), which also seems to be the case in France, since the Bay of Seine fishery has reopened since 2022 (A. n°050-2022, 2022). However, catches are only allowed in spring when fat and thus PCBs remain low, which has limited so far the amount of annual catches.
The decrease in the anchovy catches in the Mediterranean Sea was not as rapid and strong as for sardines but has been continuous between 2007 and 2015. It was also caused by decreasing fish size that reduced market opportunities (Saraux et al., 2019). When analysed over all French maritime regions, dynamics of anchovy catches were mostly driven by the major changes that occurred within the Bay of Biscay. High catches of this species were observed when regulatory constraints were low from 2000 to 2005, which led to the collapse and then fishery closure from 2005 to 2010. The reason for the collapse was described as a combination of both overfishing and bad recruitment under low food availability before 2005 (Bueno-Pardo et al., 2020; Taboada and Anadón, 2016). Despite the biological recovery of the anchovy stock after 2010 (ICES, 2025), the restructuring of the market during the closure (Beckensteiner et al., 2024), especially for provisioning in Spain, exacerbated by the decrease of anchovy size from the late 2010s (Doray et al., 2018a; Taboada et al., 2024), has strongly reduced anchovy marketing options and then catches of the French fishing fleets, especially after 2015.
At the national scale, the decline in catches for both species in the Gulf of Lion and for sardine in the English Channel has gradually left the Bay of Biscay as the only provider of sardine in France. Le Floc’h et al. (2020) analysed the concentration of the landings between 1900 and 2017 in the fishing harbours along the Atlantic and English Channel French coasts and found they were much more concentrated after 1980, relying mostly on catches from southwest Brittany and Vendée. This landing’s concentration was accompanied by a concentration and specialisation of the canning industry. Indeed, the number of canning factories has dropped from 204 in 1930, spread along the coast even if a majority of them were already located along the Bay of Biscay, to 6 in 2010, located only in Brittany and Vendée (Le Floc’h et al., 2020). Thus, the concentration of the fishing in the Bay of Biscay, as illustrated in our study under the constraint of the decrease in fish quality, both in terms of size and contamination, appears to be a continuation of this long history of geographic concentration of the fishing and fish processing sectors.
4.2 The bottom-up control of the small pelagic fishing sector through fish quality at both the seasonal and interannual scales
The seasonal dynamics of the sardine fishery in the Bay of Biscay highlights the strong influence of the fat content on the timing and intensity of fishing effort, as observed with the catches. Fishers never reported other factors related to the resource that may explain the seasonality in the catches such as availability or catchability (Lahellec et al., 2025). The seasonal evolution of the sardine fat content is itself under the bottom-up control of the fish environment. The lack of correlation between zooplankton concentration and fat content only reflects the fact that reserve building is cumulative over the productive season from April to August, which explains the lag between zooplankton and fat seasonality. Reserves are then depleted during winter when food concentration is at its lowest; thus, fat content reaches its lowest value in March. One could expect a larger increase of the fat content in spring during the peak of zooplankton concentration, but the reproductive season then likely limits reserve building. Seasonal correlation of temperature with fat content is high but cannot in itself contribute to increasing the fat content, except by accelerating the fish metabolism during the planktonic productive season. A similar seasonal variability of fish condition was already described in the Bay of Biscay, looking at other indices than fat content in the muscle, namely energy density or lipid content in the whole body (Favreau et al., 2025b; Gatti et al., 2018). In the northwestern Mediterranean Sea, Albo-Puigserver et al. (2017, 2020) also explained the seasonal dynamics of body condition and lipid content of sardine and anchovy by food availability in interaction with their reproduction cycle. A similar mechanism was proposed for herring in the North Sea (Kenyon et al., 2022).
The bottom-up driving forces of the seasonal dynamics of the SES may also partly explain the interannual dynamics observed between 2000 and 2024 in the Gulf of Lion and in the Bay of Biscay. Indeed, the most likely explanation for the decrease in anchovy and sardine size and condition in these regions over the years is changes that occurred in the plankton compartment. While at the seasonal scale variations of zooplankton quantity alone can explain the variability in fish quality, mesozooplankton biomass has not changed significantly over the years, as confirmed by a more detailed study based on image analysis (Grandremy et al., 2023). A decrease of mesozooplankton mean size in spring is more likely the main driver of SPF size. This hypothesis is supported by experimental studies showing that food of smaller size was less profitable for SPF (Queiros et al., 2019), as well as by bioenergetics modelling (Menu et al., 2023). In the North Sea, the trends within the mesozooplankton community have followed different trajectories in response to the reduction of the primary production (Capuzzo et al., 2018). This study showed that small copepod abundance has declined over 25 years (1988–2013), while large copepods have fluctuated without a significant trend, with potentially adverse consequences on higher trophic levels.
The decrease of zooplankton and fish quality may propagate to eventually impact the fishing sector and the market, as illustrated in the Gulf of Lion, where the decrease of fish size was the main cause of the decline of the whole fishing industry (Saraux et al., 2019). In the English Channel, the contamination of sardine led to the fishery closure in the Bay of Seine. This was another example of a fish quality constraint on the fishing industry, imposed by the top-down governmental decision to close an area to fishing. Regarding anchovies in the Bay of Biscay, the decrease in fish size and the loss of market after closure were the main cause of the decline of the French fishery (Beckensteiner et al., 2024). Beyond SPF fishing fleets, those targeting higher trophic levels may also be impacted, as the decrease of organisms’ quality may propagate throughout marine ecosystems while altering their biomass and productivity (Atkinson et al., 2024; Lefort et al., 2015).
4.3 A top-down control of the fishing activity by the canning sector
The downstream sector of the SPF fishing industry is characterised by an important fish processing sector, mostly represented by the canning companies. Sardine factories in France have their own spatial and temporal provisioning strategies; however, their interests converge on the required level of fat, aligning with the consumers and general interest of maximising the supply of essential nutrients such as essential fatty acids (Robinson et al., 2022). For example, a French food label (‘label rouge’) requires a threshold of 8% of fat, which justifies that the factories systematically control this quantity. The canning sector also reported fish size as a constraint, as a smaller size means manual handling of a larger number of fish to fill cans. As the age-1 proportion has increased and now represents the majority of the population, and because these fish are still small during the first semester, especially in a context of body size shrinking, they only become valuable after they have grown during summer. For age-1 fish, even if sufficient fat content is reached at the beginning of summer, size may remain as an additional limiting factor until late summer or autumn. This was the case in 2021 as reported by the fishers and canning companies. We illustrated in the previous section how the sardine SES could be bottom-up controlled by the environment’s seasonality through fish quality. This actually combines with the processing industry’s quality and technical obligations that exert a top-down constraint by imposing their seasonal provisioning strategy. The fishers’ representatives confirmed that market opportunities in the canning sector were lower during the first semester, encouraging them to regulate the catches by communicating daily with the members of their organisation on market opportunities, despite the accessibility of fish all year round. Note that the seasonal variability also observed in anchovy catches, especially in the Bay of Biscay, was not due to fish fat content but rather to the successive bilateral agreements between Spain and France (Beckensteiner et al., 2024) that have forbided trawlers, such as the main French anchovy fleet (Lahellec et al., 2024), to catch anchovy for part of the first semester. Anchovy has a similar fat seasonal pattern to sardine (Favreau et al., 2025b; Gatti et al., 2018), but various processing techniques (canned, semi-preserved, fresh) make it more valuable throughout the year.
We can also measure the top-down control of the canning sector on the fishery over the period 2000–2024. In the Gulf of Lion, the canning industry halted its provisioning when quality thresholds in terms of size and fat content were not met anymore (Saraux et al., 2019). The sector is also increasingly accounting for contamination risks, avoiding provisioning from regions where pollutant levels may jeopardize product safety or marketability, which was the case for the whole English Channel in the 2010s even if only the Bay of Seine was close to fishing. As consumers’ choices have shifted progressively towards canned sardines at the expense of fresh sardines, the sale opportunities for fishers have decreased, strengthening further the control by the canning sector. The situation is even more bitter for the fishers who have seen their other fishing opportunities dwindle with time in the Bay of Biscay, mostly due to the poor state of the stocks of alternative target species (sea bass, mackerel, and horse mackerel) and associated regulatory constraints (Lahellec et al., 2024). Therefore, dependency on sardines, which are not under quota regulation, and consequently on the canning sector, has increased for all fleets. The market, more generally, can be considered the main control of the SPF fishing activity, as illustrated by the anchovy French fishery that has been strongly regulated by the Spanish market (Beckensteiner et al., 2024).
The sardine canning sector has some flexibility advantages relative to the fishing sector. First, seasonally, their activity is maintained during the first semester by provisioning from the wholesalers that deep-froze fish during the second semester, ensuring a rather continuous quality of their products. Second, some of the canning factories also provision abroad. On average between 2000 and 2024, 8000 tons of frozen sardines have been imported for processing in the largest French factories. Since the first sale price in France has strongly increased after 2008, even reaching temporarily the price of sardines imported frozen in 2017, the latter provisioning has become more competitive at the expense of local fishers. Third, the volume of imported canned sardines is also important and has increased, a trade in which the canning sector itself has a role and interest, as some of the canning factories are located abroad. This provisioning flexibility creates an asymmetric relationship between processors and fishing fleets, as the former are able to mitigate local fluctuations in availability and quality, while the latter remain highly dependent on environmental variability and market constraints.
4.4 Concentration and specialisation do not promote resilience
The long history of concentration of the landings and canning companies in a few fishing harbours (Le Floc’h et al., 2020) has been accentuated by the impact of fish quality in the recent history of the fishery. Indeed, the canning sector in Brittany reported some provisioning from the English Channel during the 2000s that suddenly stopped in 2010. Their national provisioning now only relies on the Bay of Biscay sardine stock, which is a source of vulnerability for the whole SES. Although the stock has been assessed as repeatedly over-exploited since the mid-2010s, there is no existing precautionary management plan (ICES, 2025).
Despite the observed decline in sardine quality, fat content has remained above 10% during the second semester. Furthermore, the decreasing trend in both fat content and size of the youngest has slowed down after the mid-2010s as compared with the 2005–2015 period. Consequently, and unlike the Gulf of Lion, where current fish size prevents any profitable sale, the sardine fishing industry has so far resisted in the Bay of Biscay. However, the fishing and canning sectors report being impacted by the increasing difficulty to find big enough fish or purchase them for the latter as well as by the unpredictability of fish fat content. Although the decrease of the number of trawlers in the late 2010s was mostly due to the anchovy crisis (Beckensteiner et al., 2024; Lahellec et al., 2024), the recent decreasing trend after 2018 for both fleets is most likely related to the lack of long-term visibility on whether or not the decreasing trend of sardine quality continues. The crisis is further accentuated by the recent poor state of the stocks of alternative target species, which explains the increased dependency of the fleets on sardines in terms of annual income for both trawlers and seiners and throughout the year for seiners.
The entire SES is the relevant scale to explore adaptation options to increase the resilience of the sector (Salgueiro-Otero and Ojea, 2020). Global change, namely accelerating global warming, is ongoing, and its consequences, such as fish shrinking body size (Cheung et al., 2013; Daufresne et al., 2009; Lindmark et al., 2022), will continue to unfold over coming decades, implying that incremental adjustments within single actors may not be sufficient. Bay of Biscay fishers could fish further north in the English Channel, but, for historical reasons, the actual French regulation does not allow it for purse seiners. They could diversify their harvest portfolio, which is recognised as a factor of resilience (Quezada et al., 2024; Quezada-Escalona et al., 2025). However, the alternative species are actually dwindling (Lahellec et al., 2024). The canning sector could process smaller fish, but this would increase the processing costs per unit can volume and would reduce the nutrient supply (e.g., essential fatty acids; Shalders et al., 2022) to the consumer. The processing companies could also purchase sardines from the eastern English Channel and southern North Sea, where landings have recently increased and where fish are larger, and/or develop new processing facilities closer to these new fishing grounds. The processing sector and the retailers could increase their provisioning from other stocks abroad, although this will neither help the canning factories that only rely on the local stock nor the local fishing sector and will eventually lower the national food sovereignty.
5 Concluding remarks
Fish quantity has long been the main source of uncertainty for the fishing industry, as well as the basic information used in stock management. However, as the rate of global environmental change accelerates, small pelagic fish quality is being degraded by a general decrease in size and condition, as well as by local pollution. Fish quality loss itself can threaten an entire fishing industry, which has justified our end-to-end approach to better understand the structuring and evolution of the SES from plankton to industry (Perry et al., 2010).
Our study revealed that the French small pelagic fishing sector is caught between a bottom-up control through quality and a top-down control through canning industry provisioning and market strategies, mediated by consumers’ preferences. Within the sardine SES, the fishing sector appears as the most vulnerable human component relative to the processing industry, which seems to have more flexibility. Concentration and specialisation do not promote resilience, but we must acknowledge that the concentration of the fishing activity in the Bay of Biscay and the specialisation on sardines were endured by the fishing sector rather than the consequence of a particular strategy.
Business secrecy may have limited our ability to obtain a full and quantitative understanding of the industry strategies. However, the unprecedented juxtaposition of time series covering the whole SES combined with experts’ knowledge allowed overcoming issues related to data access and observation gaps and reconstructing the full chain of drivers and responses in the SES. In particular, the long-term involvement in our project of the fishers and their representatives, as well as of the canning industry, was decisive by enabling fruitful interactions and knowledge sharing once mutual trust was established. We highly recommend involving all stakeholders when analysing the functioning of an SES, as it will be essential to co-construct solutions for adaptation and resilience strengthening in the face of global change (Perry et al., 2010; Salgueiro-Otero and Ojea, 2020).
Finally, our analysis of the SES was conducted at the national scale, but a fuller understanding of risk propagation and adaptive opportunities would require also accounting for the international scale, given that market flows, industrial sourcing strategies, and environmental changes operate beyond national boundaries.
Acknowledgments
We thank all the partners and stakeholders involved in the French national project DEFIPEL (https://peche.ifremer.fr/Le-role-de-l-Ifremer/Recherche/Projets/Description-projets/DEFIPEL) funded by France Filière Pêche. We are grateful to the fishers and canning industry representatives that provided data on fat content and for the many fruitful discussions. We thank the project COPECO funded by Ifremer for providing socio-economic data from FranceAgrimer-Kantar. We are grateful to the PELGAS crew and all scientists onboard for sampling and making the data available. We thank the Fishery Information System (SIH) of Ifremer for processing all the fishery data and making them available through the SACROIS product. We thank Christine Dupuy and Philippe Pineau of the University of La Rochelle for processing and providing the mesozooplankton dry weights and Christelle Le Grand for the processing of the economic indicators.
Data availability statement
Due to the variety of the data used in the manuscript, it is not accessible though a unique public dataset, nor entirely available depending on the parameter. Some of the data is available though links provided in Table 1, or through reasonable request to the corresponding author.
References
- Airaksinen R, Hallikainen A, Rantakokko P, Ruokojärvi P, Vuorinen PJ, Parmanne R, Verta M, Mannio J, Kiviranta H. 2014. Time trends and congener profiles of PCDD/Fs, PCBs, and PBDEs in Baltic herring off the coast of Finland during 1978–2009. Chemosphere 114: 165–171. [Google Scholar]
- Albo-Puigserver M, Muñoz A, Navarro J, Coll M, Pethybridge H, Sánchez S, Palomera I. 2017. Ecological energetics of forage fish from the Mediterranean Sea: seasonal dynamics and interspecific differences. Deep Sea Res Part II 140: 74–82. [Google Scholar]
- Albo-Puigserver M, Sánchez S, Coll M, Bernal M, Sáez-Liante R, Navarro J, Palomera I. 2020. Year-round energy dynamics of sardine and anchovy in the north-western Mediterranean Sea. Mar Environ Res 159: 105021. [Google Scholar]
- A n°10-20. 2010. Arrêté du 8 février 2010 portant interdiction de la pêche des sardines (Sardina pilchardus) dans certaines eaux maritimes littorales des départements de la Seine-Maritime, du Calvados et de la Manche en vue de la consommation et de la commercialisation. [Google Scholar]
- A n°050-2022, 2022. Arrêté préfectoral du 16 mars 2022 portant ouverture de la pêche de la sardine (Sardina pilchardus) dans certaines eaux maritimes littorales des départements de la Seine-Maritime, du Calvados et de la Manche. [Google Scholar]
- Atkinson A, Rossberg AG, Gaedke U, Sprules G, Heneghan RF, Batziakas S, Grigoratou M, Fileman E, Schmidt K, Frangoulis C. 2024. Steeper size spectra with decreasing phytoplankton biomass indicate strong trophic amplification and future fish declines. Nat Commun 15: 381. [Google Scholar]
- Beckensteiner J, Villasante S, Charles A, Petitgas P, Le Grand C, Thébaud O. 2024. A systemic approach to analyzing post-collapse adaptations in the Bay of Biscay anchovy fishery. Can J Fish Aquat Sci 81: 1154–1173. [Google Scholar]
- Beveren EV, Fromentin JM, Rouyer T, Bonhommeau S, Brosset P, Saraux C. 2016. The fisheries history of small pelagics in the Northern Mediterranean. ICES J Mar Sci 73: 1474–1484. [Google Scholar]
- Brosset P, Fromentin JM, Van Beveren E, Lloret J, Marques V, Basilone G, et al. 2017. Spatio-temporal patterns and environmental controls of small pelagic fish body condition from contrasted Mediterranean areas. Prog Oceanogr 151: 149–162. [Google Scholar]
- Bueno-Pardo J, Petitgas P, Kay S, Huret M. 2020. Integration of bioenergetics in an individual-based model to hindcast anchovy dynamics in the Bay of Biscay. ICES J Mar Sci 77: 655–667. [Google Scholar]
- Canales CM, Adasme NA, Cubillos LA, Cuevas MJ, Sánchez N. 2018. Long-time spatio-temporal variations in anchovy (Engraulis ringens) biological traits off northern Chile: an adaptive response to long-term environmental change? ICES J Mar Sci 75: 1908–1923. [Google Scholar]
- Capuzzo E, Lynam CP, Barry J, Stephens D, Forster RM, Greenwood N, McQuatters-Gollop A, Silva T, van Leeuwen SM, Engelhard GH. 2018. A decline in primary production in the North Sea over 25 years, associated with reductions in zooplankton abundance and fish stock recruitment. Glob Change Biol 24: e352–e364. [Google Scholar]
- Cheung WWL, Watson R, Pauly D. 2013. Signature of ocean warming in global fisheries catch. Nature 497: 365. [CrossRef] [PubMed] [Google Scholar]
- Colombo SM, Rodgers TMF, Diamond ML, Bazinet RP, Arts MT. 2020. Projected declines in global DHA availability for human consumption as a result of global warming. Ambio 49: 865–880. [CrossRef] [PubMed] [Google Scholar]
- Daufresne M, Lengfellner K, Sommer U. 2009. Global warming benefits the small in aquatic ecosystems. Proc Natl Acad Sci USA 106: 12788–12793. [Google Scholar]
- Demaneche S, Leblond E, Le Roy E. 2022. SACROIS. A data cross-validation tool. https://archimer.ifremer.fr/doc/00774/88631/. [Google Scholar]
- Doray M, Petitgas P, Huret M, Duhamel E, Romagnan JB, Authier M, Dupuy C, Spitz J. 2018a. Monitoring small pelagic fish in the Bay of Biscay ecosystem, using indicators from an integrated survey. Prog Oceanogr 166: 168–188. [Google Scholar]
- Doray M, Petitgas P, Romagnan JB, Huret M, Duhamel E, Dupuy C, Spitz J, Authier M, Sanchez F, et al. 2018b. The PELGAS survey: ship-based integrated monitoring of the Bay of Biscay pelagic ecosystem. Prog Oceanogr 166: 15–29. [Google Scholar]
- Doray M, Van Der Kooij J, Boyra G (eds.), 2021. ICES Survey Protocols – Manual for acoustic surveys coordinated under the ICES Working Group on Acoustic and Egg Surveys for Small Pelagic Fish (WGACEGG). https://doi.org/10.17895/ICES.PUB.7462 [Google Scholar]
- FAO. 2022a. The state of world fisheries and aquaculture 2022. Towards blue transformation, FAO, Rome, Italy. doi: 10.4060/cc0461en. [Google Scholar]
- Favreau A, Doray M, Spitz J, Huret M. 2025a. Assessment of energy content indices for exploited small pelagic fish. Aquat Living Resour 38: 19. [Google Scholar]
- Favreau A, Doray M, Spitz J, Le Mestre S, Huret M. 2025b. Condition states in anchovy and sardine revealed by energy and proximate composition relationships. J Fish Biol 106: 465–480. [Google Scholar]
- FranceAgriMer. 2025. Chiffres-clés des filières pêche et aquaculture en France en 2024. https://www.franceagrimer.fr/. [Google Scholar]
- Gardner JL, Peters A, Kearney MR, Joseph L, Heinsohn R. 2011. Declining body size: a third universal response to warming? Trends Ecol Evol 26: 285–291. [Google Scholar]
- Gatti P, Cominassi L, Duhamel E, Grellier P, Le Delliou H, Le Mestre S, Petitgas P, Rabiller M, Spitz J, Huret M. 2018. Bioenergetic condition of anchovy and sardine in the Bay of Biscay and English Channel. Prog Oceanogr 166: 129–138. [Google Scholar]
- Grandremy N, Romagnan JB, Dupuy C, Doray M, Huret M, Petitgas P. 2023. Hydrology and small pelagic fish drive the spatio–temporal dynamics of springtime zooplankton assemblages over the Bay of Biscay continental shelf. Prog Oceanogr 210: 102949. [Google Scholar]
- ICES. Working Group on Southern Horse Mackerel, Anchovy and Sardine (WGHANSA). ICES Scientific Reports. 7:70, 2025, p. 631. https://doi.org/10.17895/ices.pub.29335520 [Google Scholar]
- IPCC. Climate Change 2023: Synthesis Report. Contribution of Working Groups I, II and III to the Sixth Assessment Report of the Intergovernmental Panel on Climate Change. in: Core Writing Team, H. Lee and J. Romero (eds.), Geneva, Switzerland, IPCC, 2023, p. 35–115. doi: 10.59327/IPCC/AR6-9789291691647 [Google Scholar]
- Jarre A, Hutchings L, Kirkman SP, Kreiner A, Tchipalanga PCM, Kainge P, et al. 2015. Synthesis: climate effects on biodiversity, abundance and distribution of marine organisms in the Benguela. Fish Oceanogr 24: 122–149. [Google Scholar]
- Kenyon S, Pastoors M, Mackinson S, Cornulier T, Marshall CT. 2022. Intra- and inter-annual variability in the fat content of Atlantic herring (Clupea harengus) as revealed by routine industry monitoring. ICES J Mar Sci 79: 88–99. [Google Scholar]
- Lahellec G, Daurès F, Lehuta S. 2024. Revealing the adaptation strategies of pelagic fleets in the Bay of Biscay by combining fishery data and fishers’ knowledge. ICES J Mar Sci 82: fsae171 https://doi.org/10.1093/icesjms/fsae171 [Google Scholar]
- Le Floc’h P, Alban F, Merzéréaud M, Duhamel E. 2020. Identification des points de rupture dans la série longue des productions de sardine en France (1900–2017). Rev d’Économie Ind 170: 49–78. [Google Scholar]
- Le Floc’h P, Merzéréaud M, Beckensteiner J, Alban F, Duhamel E, Thébaud O, Wilson J. 2023. Explaining technical change and its impacts over the very long term: The case of the Atlantic sardine fishery in France from 1900 to 2017. Res Policy 52: 104864. [Google Scholar]
- Lefort S, Aumont O, Bopp L, Arsouze T, Gehlen M, Maury O. 2015. Spatial and body-size dependent response of marine pelagic communities to projected global climate change. Glob Change Biol 21: 154–164. [Google Scholar]
- Lindmark M, Audzijonyte A, Blanchard JL, Gårdmark A. 2022. Temperature impacts on fish physiology and resource abundance lead to faster growth but smaller fish sizes and yields under warming. Glob Change Biol 28: 6239–6253. [Google Scholar]
- Mason JG, Eurich JG, Lau JD, Battista W, Free CM, Mills KE, Tokunaga K, Zhao LZ, Dickey-Collas M, Valle M, Pecl GT, Cinner JE, McClanahan TR, Allison EH, Friedman WR, Silva C, Yáñez E, Barbieri MÁ, Kleisner KM. 2022. Attributes of climate resilience in fisheries: From theory to practice. Fish Fish 23: 522–544. [Google Scholar]
- Menu C, Pecquerie L, Bacher C, Doray M, Hattab T, van der Kooij J, Huret M. 2023. Testing the bottom-up hypothesis for the decline in size of anchovy and sardine across European waters through a bioenergetic modeling approach. Prog Oceanogr 210: 102943. [Google Scholar]
- Myers SS, Smith MR, Guth S, Golden CD, Vaitla B, Mueller ND, Dangour AD, Huybers P. 2017. Climate Change and Global Food Systems: Potential Impacts on Food Security and Undernutrition. Annu Rev Public Health 38: 259–277. [CrossRef] [PubMed] [Google Scholar]
- Peck MA, Alheit J, Bertrand A, Catalán IA, Garrido S, Moyano M, Rykaczewski RR, Takasuka A, van der Lingen CD. 2021. Small pelagic fish in the new millennium: A bottom-up view of global research effort. Prog Oceanogr 191: 102494. [Google Scholar]
- Perry RI, Barange M, Ommer RE. 2010. Global changes in marine systems: A social–ecological approach. Prog Oceanogr 87: 331–337. [Google Scholar]
- Preisendorfer RW. Principal component analysis in meteorology and oceanography, Elsevier Science Publishers, Amsterdam, New York, 1988, p. 425 [Google Scholar]
- Queiros Q, Fromentin J-M, Gasset E, Dutto G, Huiban C, Metral L, Leclerc L, Schull Q, McKenzie DJ, Saraux C. 2019. Food in the Sea: Size Also Matters for Pelagic Fish. Front Mar Sci 6: 385. [Google Scholar]
- Quezada FJ, Tommasi D, Frawley TH, Muhling B, Kaplan I, Stohs S. 2024. Catch as catch can: markets, availability, and fishery closures drive distinct responses among the U.S. West Coast coastal pelagic species fleet segments. Can J Fish Aquat Sci 81: 1135–1153. [Google Scholar]
- Quezada-Escalona FJ, Tommasi D, Kaplan IC, Hernvann P-Y, Frawley TH, Garcia D, et al. 2025. Socio-economic impacts and responses of the fishing industry and fishery managers to changes in small pelagic fish distribution and abundance. Rev Fish Biol Fish 35: 1063–1093. [Google Scholar]
- Rajasilta M, Hänninen J, Laaksonen L, Laine P, Suomela J-P, Vuorinen I, Mäkinen K. 2019. Influence of environmental conditions, population density, and prey type on the lipid content in Baltic herring (Clupea harengus membras) from the northern Baltic Sea. Can J Fish Aquat Sci 76: 576–585. [Google Scholar]
- Robinson JPW, Nash KL, Blanchard JL, Jacobsen NS, Maire E, Graham NAJ, MacNeil MA, Zamborain-Mason J, Allison EH, Hicks CC. 2022. Managing fisheries for maximum nutrient yield. Fish Fish 23: 800–811. [Google Scholar]
- Salgueiro-Otero D, Ojea E. 2020. A better understanding of social-ecological systems is needed for adapting fisheries to climate change. Mar Policy 122: 104123. [Google Scholar]
- Saraux C, Van Beveren E, Brosset P, Queiros Q, Bourdeix J-H, Dutto G, Gasset E, Jac C, Bonhommeau S, Fromentin J-M. 2019. Small pelagic fish dynamics: A review of mechanisms in the Gulf of Lions. Deep Sea Res Part II 159: 52–61. [Google Scholar]
- Shalders TC, Champion C, Coleman MA, Benkendorff K. 2022. The nutritional and sensory quality of seafood in a changing climate. Mar Environ Res 176: 105590. [Google Scholar]
- Sheridan JA, Bickford D. 2011. Shrinking body size as an ecological response to climate change. Nat Clim Change 1: 401–406. [Google Scholar]
- Subramaniam RC, Ruwet M, Boschetti F, Fielke S, Fleming A, Dominguez-Martinez RM, Plagányi É, Schrobback P, Melbourne-Thomas J. 2023. The socio-ecological resilience and sustainability implications of seafood supply chain disruption. Rev Fish Biol Fish 33: 1129–1154. [Google Scholar]
- Suominen K, Hallikainen A, Ruokojärvi P, Airaksinen R, Koponen J, Rannikko R, Kiviranta H. 2011. Occurrence of PCDD/F, PCB, PBDE, PFAS, and organotin compounds in fish meal, fish oil and fish feed. Chemosphere 85: 300–306. [Google Scholar]
- Taboada FG, Anadón R. 2016. Determining the causes behind the collapse of a small pelagic fishery using Bayesian population modeling. Ecol Appl 26: 886–898. [Google Scholar]
- Taboada FG, Chust G, Santos Mocoroa M, Aldanondo N, Fontán A, Cotano U, Álvarez P, Erauskin-Extramiana M, Irigoien X, Fernandes-Salvador JA, Boyra G, Uriarte A, Ibaibarriaga L. 2024. Shrinking body size of European anchovy in the Bay of Biscay. Glob Change Biol 30: e17047. [Google Scholar]
- Vermeulen SJ, Campbell BM, Ingram JSI. 2012. Climate change and food systems. Annu Rev Environ Resour 37: 195–222. [Google Scholar]
- Véron M, Duhamel E, Bertignac M, Pawlowski L, Huret M. 2020. Major changes in sardine growth and body condition in the Bay of Biscay between 2003 and 2016: temporal trends and drivers. Prog Oceanogr 182: 102274. [Google Scholar]
- Weil J, Trudel M, Tucker S, Brodeur RD, Juanes F. 2019. Percent ash-free dry weight as a robust method to estimate energy density across taxa. Ecol Evol 9: 13244–13254. [Google Scholar]
- Wheeler T, von Braun J. 2013. Climate Change Impacts on Global Food Security. Science 341: 508–513. [CrossRef] [PubMed] [Google Scholar]
Cite this article as: Huret M, Daurès F, Doray M, Hattab T, Romagnan J-B, Travers-Trolet M, Cailliau C, Lehuta S. 2026. Fish quality jeopardises the French small pelagic social-ecological system. Aquat. Living Resour. 39: 13. https://doi.org/10.1051/alr/2026006
Appendix
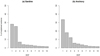 |
Fig. A1 Percentage of explained variance for the EOFs applied on sardine (a) and anchovy (b) spatialised catches from 2000 to 2024. |
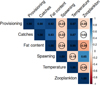 |
Fig. A2 Seasonal correlogram of the variables of Figure 5 calculated on their monthly climatologies. Values of the Pearson correlation coefficient are drawn, and non-significant correlations (P-value > 0.05) are encircled. |
All Tables
List of the indices used in the analyses of the small pelagic social-ecological system, together with their period of availability, source and reference, region of interest and type of analysis conducted. The latter refers to the statistical subsection of the ‘Materials and methods’ section. The slopes of the annual linear trends are provided only when significant (p < 0.05*, p < 0.01**, p < 0.001***), otherwise only unit is indicated.
All Figures
|
Fig. 1 Map of the studied area with the 3 maritime regions where the French small pelagic fishery operates. Statistical rectangles 25E4 and 25E5 drawn at the tip of Brittany are included in the Bay of Biscay when considering sardine catches (see text). The PNMI Marine Protected Area is also located at the tip of Brittany and operates a seasonal egg sampling in the Bay of Douarnenez (red dot). |
| In the text | |
|
Fig. 2 Annual catches of sardine (left) and anchovy (right) by the French fishery based on the SACROIS product. The Bay of Biscay includes the sardine catches from the statistical rectangles 25E4 and 25E5 located in 27.7 but considered part of the Bay of Biscay stock. The English Channel and North Sea catches are considered together when discussed in the text, given the spatial continuity of the French fishing activity in the eastern Channel–southern North Sea area (see Fig. 3). |
| In the text | |
|
Fig. 3 Sardine mean annual catches over 2000–2024 (left panel) with their first 2 EOFs calculated on the catches by month. Spatial patterns of the EOFs are represented (middle panels) together with their temporal amplitudes (right panels). The local explained variance is plotted on the modes of the EOFs, with crosshatches if above 50%, where results are considered reliable for interpretation. |
| In the text | |
|
Fig. 4 Anchovy mean annual catches (left panel) with their first 2 EOFs calculated on the monthly catches by month. Spatial patterns of the EOFs are represented (middle panels) together with their temporal amplitudes (right panels). The local explained variance is plotted on the modes of the EOFs, with crosshatches if above 50%, where results are considered reliable for interpretation. |
| In the text | |
|
Fig. 5 Seasonality in the different dimensions of the sardine social-ecological system of the Bay of Biscay from habitat to fish to the fishery and to the canning industry. (a) Monthly climatology of the number of batches of sardine processed by 3 major canning industries in Brittany. The batches are affected by their fishing month and not their reception month (see text). (b) Monthly climatology of the total catches in the Bay of Biscay. Error bars represent ±1 standard deviation computed on the interannual variability. (c) Monthly climatology of the sardine fat content, with variability calculated from the monthly average values obtained from the different years and 3 canning industries. The red horizontal line draws the limit above which fish can be sold with a quality label in France (‘Label rouge’). The yellow curve represents seasonality in the number of sardine eggs from PNMI sampling. (d) Monthly climatology of the Bay of Biscay temperature (red) and zooplankton (green) concentration (2000–2024). Error bars represent ±1 standard deviation computed from the monthly averaged values obtained from the different years. |
| In the text | |
|
Fig. 6 Time series of indices of the sardine social-ecological system in the Bay of Biscay between 2000 and 2024. Mesozooplankton dry weight in May in the range of (a) 0.2–0.5 mm, (b) 1–2 mm, and (c) 0.2–2 mm. Boxplots are produced based on block data after spatial smoothing of the raw data from survey stations. (d) Sardine mean length at age and mean individual length (black); (e) sardine mean weight at age and mean individual weight (black); and (f) sardine proportion at age based on the abundance in May during the PELGAS survey, a linear trend is plotted for age 1 only. (g) Sardine fat content as measured by the canning industry averaged over the months July to October. (h) Spawning stock biomass and (i) fishing mortality from stock assessment. (j) Number of vessels targeting sardine by fleet, (k) income dependency to sardine with respect to the total annual income, and (l) share of sardine income generated in the ‘low’ season (December to May). (m) Price of sardines (in constant 2015 euros) at first sale in auction market or when imported frozen, (n) national import of sardines canned, frozen, or fresh; and (o) French consumption of fresh or canned sardines. Linear trends are plotted when significant at the threshold p-value = 0.05, with slope provided in Table 1. Note that in 2020 PELGAS could not occur because of COVID. |
| In the text | |
|
Fig. A1 Percentage of explained variance for the EOFs applied on sardine (a) and anchovy (b) spatialised catches from 2000 to 2024. |
| In the text | |
|
Fig. A2 Seasonal correlogram of the variables of Figure 5 calculated on their monthly climatologies. Values of the Pearson correlation coefficient are drawn, and non-significant correlations (P-value > 0.05) are encircled. |
| In the text | |
Current usage metrics show cumulative count of Article Views (full-text article views including HTML views, PDF and ePub downloads, according to the available data) and Abstracts Views on Vision4Press platform.
Data correspond to usage on the plateform after 2015. The current usage metrics is available 48-96 hours after online publication and is updated daily on week days.
Initial download of the metrics may take a while.