


| Issue |
Aquat. Living Resour.
Volume 39, 2026
|
|
|---|---|---|
| Article Number | 14 | |
| Number of page(s) | 14 | |
| DOI | https://doi.org/10.1051/alr/2026008 | |
| Published online | 29 May 2026 | |
Research Article
Variation in catch composition in offshore fishing boats and motivation toward flotsam-associated fishing in the Indian Ocean: implications for management
1
National Aquatic Resources Research and Development Agency, Crow Island, Colombo 15, Sri Lanka
2
Department of Fisheries and Aquaculture, Faculty of Fisheries and Marine Sciences & Technology, University of Ruhuna, Matara 81000, Sri Lanka
3
Department of Aquaculture and Fisheries, Wayamba University of Sri Lanka, Makandura, Gonawila 60170, Sri Lanka
4
Department of Fisheries and Aquatic Resources, New Secretariat, Maligawatte, Colombo, Sri Lanka
5
Department of Zoology and Environmental Management, University of Kelaniya, Kelaniya 11600, Sri Lanka
* Corresponding author: This email address is being protected from spambots. You need JavaScript enabled to view it.
Received:
2
July
2025
Accepted:
6
May
2026
Abstract
Regional fisheries management organizations are mandated to reduce impacts of commercial fishing activities on non-target species. This is particularly important because fishing associated with natural drifting objects and artificial fish-aggregating devices across the oceans poses adverse impacts on non-target species, including juveniles of tuna species. In the Indian Ocean off Sri Lanka, deep-sea fishing boats are engaged in fishing with gillnets, longlines, and encircling nets associated with natural floating objects. The present study aimed at investigating whether target species and bycatch species in the catches of fishing methods can be differentiated to introduce effective management to the fisheries and to perceive driving forces in terms of the nature of fishing strategies with a view to recognizing appropriate management measures. From the boats operated from four fishery harbors of southern Sri Lanka from February 2018 to December 2020, species compositions of landings of 1915 fishing operations consisting of gillnetting, longlining, flotsam-associated ring netting, and a combination of ring netting with gillnetting and longlining were analyzed separately for each fishing method. Also, cost components of individual fishing operations and corresponding net revenues, gleaned from logbook records of boats, were scrutinized. This analysis underscored that there was a noticeable difference in species caught in the five types of fishing boats, consisting of large tuna and tuna-like species in the landings of longlines and drift gillnets. Landings of flotsam-associated ring netting were dominated by shade-loving species and juvenile tunas. As fuel cost is considerably lower in ring net fisheries than in gillnet and longline fisheries due to shorter trip duration and as there is higher net revenue from the fishing operations, there is an increasing trend of ring netting associated with floating objects. Under the existing legal framework, this fishery can be restricted by introducing high seas licenses.
Key words: Bycatch / FAD / flotsam / fuel price / pelagic fish
Handling Editor: Lorne Richard Little
© N.B.P. Punyadeva et al., Published by EDP Sciences, 2026
 This is an Open Access article distributed under the terms of the Creative Commons Attribution License (https://creativecommons.org/licenses/by/4.0), which permits unrestricted use, distribution, and reproduction in any medium, provided the original work is properly cited.
1 Introduction
Globally, in tuna fisheries, management and conservation efforts are directed toward fisheries for large pelagic species of major economic interest, and attention toward minor taxa and non-target species is restricted to the mandate of some Regional Fisheries Management Organizations (RFMOs), producing an incomplete representation of the true picture of pelagic fisheries (Vierros et al., 2016; Coulter et al., 2020). However, there is an indisputable claim that fishing activities are one of the stressors causing serious damage to marine biodiversity (Rousseau et al., 2019). Part of these damages comes from bycatch defined as unintentional catch either having commercial value or corresponding to non-commercial species likely treated as discards (Hilborn et al., 2023).
The provisions of the FAO Code of Conduct for Responsible Fisheries (FAO, 1995) and of the United Nations Fish Stocks Agreement (United Nations, 2025) provide a mandate to reduce impacts on non-target species or bycatch species for RFMOs, which are responsible for the management of highly migratory fish stocks such as tunas. In many oceans, pelagic fish species aggregate around natural drifting objects, such as logs and tree branches, and to exploit this fish aggregative behavior fish aggregative devices (FADs; Dempster and Taquet, 2004) are artificially constructed. However, Dagorn et al. (2013) mentioned that the FADs pose adverse impacts on tuna stocks and threats to the biodiversity of tropical pelagic ecosystems. According to Davies et al. (2014), who reviewed the past and present use of FADs in the Indian Ocean tropical tuna purse seine fishery, an increase in the use of FADs during the recent past has necessitated unambiguous management of the fisheries associated with FADs to ensure their future sustainability.
Semi-industrial mechanized boats operating from Sri Lankan harbors are engaged in fishing in high seas and generally spend 5 to 30 days, depending on the limited ice storage facility and deck space (Hewapathirana et al., 2015). These boats, therefore, are referred to as “multiday boats”. Fishing activities are carried out by crews of 3–10 fishers in each boat. A mandatory requirement is that every multiday boat must provide log sheets of fishing operations.
In the Sri Lankan fishing fleet targeting tuna and tuna-like fish, gear used is either drift gillnets (GN) or longlines (LL). Some fishing boats carry encircling nets, locally termed as ring nets (RN), together with drift gillnets and longlines to operate whenever they encounter natural floating objects such as drifting dead trees, targeting fish schools aggregated under these objects (Ariyarathna and Amarasinghe, 2012; Chathurika and Dissanayake, 2016; Gunawardane et al., 2023). Consequently, multiday boats can be categorized as those operating RN, GN, LL, and combinations of them (RN+GN and RN+LL). Whenever a boat encounters a floating object, its ownership is defined by fixing a flag, and when the fishers are satisfied that sufficient fish are aggregated beneath the floating object, the fish schools are encircled using a surrounding net (Ariyatathna and Amarasinghe, 2012). From encountering a floating object to the commencement of fishing (which generally lasts for 3–10 days), to save fuel costs, the skipper turns off the engine and allows the boat to drift passively along the water current. Characteristics of longlines, gillnets, and ring nets are given in Appendix I.
Among fisheries authorities of Sri Lanka, there are concerns about the proliferation of ring net fishing mainly because juvenile tunas are caught. It is apparent that for the multiday fisheries off Sri Lanka, the fisheries management efforts are insufficient. In the present study, an attempt is made to investigate whether target and bycatch species in the catches can be differentiated among fishing methods to introduce effective monitoring, control, and surveillance (MCS) to the fisheries and to diagnose driving forces in terms of the nature of fishing strategies with a view to recognizing appropriate management measures.
2 Materials and methods
Multiday boats from the harbors of Beruwala, Galle, Gandara, and Tangalle (Fig. 1), using RN alone or in combination with longline (RN+LL) or gillnet (RN+GN) between February 2018 and December 2020. From February 2018 to December 2019 gillneters (GN) and longliners (LL) were also examined. Fishery data were gleaned from the log-book records of multiday boats. Data of 74 longline operations, 151 gillnet operations, 995 ring net operations, 343 ring net plus gillnet operations, and 352 ring net plus longline operations were used in the analysis (Fig. 1). In each month, there were 16–52 RN fishing operations during the study period. For RN+GN, there were 2–20 operations, and for RN+LL, 1–23 operations per month. Longliners recorded 2–7 fishing operations per month, and gillnetters performed 4–10 operations per month during the study period.
From the logbook data of each multiday boat, fishing duration, fishing methods and locations, and species-wise landings by weight were recorded. Also, from the records of boat owners, expenditure incurred for each fishing operation separately for the cost components of food, fuel, and ice was recorded. The net revenue from each fishing trip, which was available in the records of boat owners, was registered as the total value of catch minus total expenditure. The number of fishing trips of multiday boats during 2021-2024, reported by the Department of Fisheries and Aquatic Resources (DFAR, 2025), was also obtained to illustrate the trend in multiday fishing.
As bycatch species are known to be caught in ring netters (RN) and combinations with gillnetters (RN+GN) and longliners (RN+LL), to investigate the patterns of the landings of RN, RN+GN, and RN+LL in relation to monsoon patterns, a self-organizing map (SOM), an unsupervised algorithm of artificial neural networks (ANNs), which is also known as the Kohonen map (Kohonen, 2001), was used. SOM is an approach where similar items in a multidimensional dataset are reduced to fewer dimensions (Kohonen, 2014), displaying the output neurons as a hexagonal lattice (Vatanen et al., 2015). For this analysis, monthly averages of species-wise landings of RN, RN+GN, and RN+LL were estimated. Here, catch per fishing operation of each species was considered as catch per unit effort (CPUE), assuming catch efficiencies of individual boats of a given fishing method are more or less similar. As CPUE is known to be log-normally distributed (Gulland, 1983), CPUE data of each species/species group were ln(CPUE + 1) transformed to reduce the distribution skewness of data. Each sampling month was assigned to one of the four monsoonal seasons [i.e., north-east (NE), intermonsoon 1 (IM1), south-west (SW) and intermonsoon 2 (IM2); Ross and Savada, 1990]. Monsoon season-wise CPUE was then coded. For example, the code RNGN0318IM1 represents the mean CPUE of different species caught in ring netters and gillnetters in March 2018 during IM1.
In the analysis, classification of sample vectors (SVs) was accomplished into neighboring cells having similarities in ln(CPUE + 1) and those that are dissimilar into cells that could be distant from each other (Lek and Guégan, 2000). According to Vesanto (2005), the SOM size (i.e., number of neurons in the output layer) was approximated using the formula: C = 5×√n, where C is the number of cells and n is the number of sample vectors. The similarities and dissimilarities of the SVs were identified by hierarchical cluster analysis (i.e., Euclidean distance). Two evaluation criteria, i.e., a quantization error and a topographic error, an indicator of the accuracy of the mapping in the preserving topology (Kivilnoto, 1996; Kohonen, 2001; Park et al., 2003), and the quantization error, the average distance between each data vector (Kohonen, 2001), were used to determine the SOM quality.
In the SOM analysis, the probability of occurrence of each species/species group in each cluster could also be determined (Lek and Guégan, 2000; Park et al., 2005). This analysis was performed using the SOM software package (SOM Toolbox v2.1; https://github.com/ilarinieminen/SOM-Toolbox) (Alhoniemi et al., 1999; Vesanto et al., 2000; Vatanen et al., 2015).
The total operational cost of each fishing operation of the five fishing methods and their net revenue was compared separately, employing the Kruskal–Wallis test, followed by Dunn’s post-hoc multiple comparison (adjusted by the Bonferroni method; Dunn, 1964). Also, the revenue/expenditure ratio of each fishing operation of the five fishing methods was compared employing the same statistical test. R software (R Core Team, 2022) was used for these analyses.
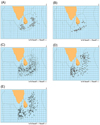 |
Fig. 1 Fishing locations of boats of (A) gillnetting; (B) longlining; (C) ring netting; (D) ring netting plus gillnetting; and (E) ring netting and longlining, operated from four fishery harbors of Sri Lanka (BW: Beruwala; GL: Galle; GN: Gandara; TN: Tangalle) in the present analysis. |
3 Results
Species composition of fish (Tab. 1 and Fig. 2) shows differences among the five types of fishing boats (RN, LL, GN, RN+GN, and RN+LL). In longline fisheries, landings are dominated by large pelagic fish species, most notably Thunnus albacares and Thunnus obesus. Sailfish (Istiophorus spp.) and swordfish (Xiphias gladius). Apart from these species, in the boats operating drift gillnetting, skipjack (Katsuwonus pelamis) and kawakawa (Euthynnus affinis) were also caught in significant amounts. The landings of ring netters were dominated by Decapterus russelli and juvenile K. pelamis. The other dominant species in the landings were Elegatis bipinnulata, small tuna species (E. affinis, Auxis thezard, and Auxi. rochie), and Canthidermis maculata. The species compositions of boats using two types of gear (RN+LL and RN+GN) were essentially equal to the combination of individual species compositions (Tab. 1 and Fig. 2).
As there were 101 samples in the RN, RN+GN, and RN+LL data, the map size of 50 was chosen. In the SOM process, the cluster structure of the map could be visualized from the unified distance matrix (U-matrix; Fig. 3A), and by means of the K-means algorithm (Park et al., 2003; Lek et al., 2005), 50 map units were partitioned into four clusters (Fig. 3B). In the output layer of the SOM, there were 50 neurons arranged into a 5-column × 10-row hexagonal lattice (Fig. 3C). The four clusters classified by hierarchical clustering (Fig. 3D) showed close similarities between clusters I and IV and between clusters II and III. Authentication of the analysis was confirmed by low quantization error (0.358) and topographical error (0.000) of the SOM (Park et al., 2003, 2006). In cluster I, sample vectors (SVs) were prominently those of ring netters. Cluster II consisted of a few SVs of RN+GN, whereas Clusters III and IV were dominated by SVs of RN+GN and RN+LL, respectively. Most notably, there was no clear-cut separation of SVs according to monsoonal seasons, but catch efficiencies of fishing strategies.
The probabilities of occurrence of species/species groups (Fig. 4) illustrated that in all four clusters, target species of ring netters and their bycatch species had more or less similar occurrences. In cluster I, where the majority of sample vectors consisted of ring netters, probabilities of occurrence of large pelagic species were essentially reflected by a few SVs of RN+LL. Both clusters II and III exhibited somewhat higher probabilities of occurrence that were caught in gillnetters (Fig. 2). In cluster IV, the majority of SVs were RN+LL, and as such, probabilities of occurrence of species that were caught in longliners (i.e., large pelagic species/species groups; Fig. 2) registered higher values. Gradient analysis of species/species groups, based on the probabilities of occurrence (Appendix II), also confirms that those of target species and bycatch species reflect catch efficiencies of fishing strategies.
Of the three major components of operational cost (i.e., food, fuel, and ice), fuel cost is the major operational expenditure of all five fishing operations (Fig. 5). It can also be seen that the ring netters (Fig. 5) had lower fuel costs for individual fishing operations compared with the other four categories (GN, LL, RN+GN, and RN+LL). As fuel cost is the major cost component, the overall cost per fishing operation was the lowest in the ring net boats and the highest in longline boats (Fig. 6A). The median values of operational costs of fishing operations of 5 categories (Fig. 6A) were significantly different (Kruskal–Wallis test; H = 1173, df = 4; P < 0.001), registering the lowest value in ring netters. The net revenue of each fishing operation (= total value of catch – operational cost) was greater in the ring netters and those of the combination with gillnetters and longliners (RN+GN and RN+LL), compared with GN and LL (Fig. 6B). The Kruskal–Wallis test indicated that the median values of net revenues of fishing operations of 5 categories were significantly different (H = 967.9; df = 4; P < 0.001). However, the median values of revenue were not significantly different between ring netters and longliners, possibly due to the reason that longliners target high-valued tuna species such as T. albacares and T. obesus.
Although of low market value, fish species caught by RN, RN+GN, or RN+LL, most notably D. russelli and juvenile K. pelamis, overall net revenues in these fishing operations were evidently higher. Mean fishing duration reflects search time or time spent reaching the fishing location. This was appreciably lower in RN boats than those of other boats (Fig. 7). The ratio of net revenue per expenditure (Fig. 8) indicates that higher ratios were reported in ring netters and those used combination (RN+GN and RN+LL), and the median values of the five categories of fishing were significantly different (Kruskal–Wallis test; H = 603.4, df = 4, P < 0.001) with the highest ratio in ring netters.
The trends in fishing operations (Fig. 9) show that although boats of all three fishing methods (ring netting, gillnetting, and longlining) increased, prominent trends are seen for boats of ring netting and those operated together with gillnetting and longlining.
Species caught (kg per fishing operation) in boats of different fishing operations. Values in parentheses are number of fishing operations. –Abbrevitions of species/species groups: LL–, longlining; GN–, gillnetting; RN–, ring netting. S–, small individuals; L–, large individuals.
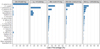 |
Fig. 2 Species composition for longliners (LL), drift gillnetters (GN), ring netters (RN), and their combinations (RN+GN, RN+LL). Total weights landed from the fishing operations observed from sampled boats are also given here. The number of fishing operations from each fishing method is as given in Table 1. L, large fish; S, small fish. |
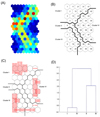 |
Fig. 3 The output neurons of SOM with 101 sample vectors. (A) The U-matrix with a shading intensity of the level of activation; (B) Partitioning of the 50 hexagons into 4 clusters by the K-means algorithm; (C) SOM classification based on the similarity of CPUE of fish species/species groups; and (D) Hierarchical clustering (Euclidean distance on the vertical axis), based on the similarity between SOM neurons. |
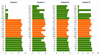 |
Fig. 4 Probability of occurrence (%) of each species/species group in the four SOM clusters, as determined from the weight of virtual vectors of unsupervised SOM. Red-colored columns indicate bycatch species. Species abbreviations are as given in Table 1. |
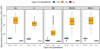 |
Fig. 5 Box plots of expenditure for food, fuel, and ice for each fishing operation in different fishing methods. LL: longlining; GN: drift gillnetting; RN: ring netting; RN+GN: combination of gillnetting and ring netting; and RN+LL: combination of longlining and ring netting. lower limits of boxes: first quartile; horizontal lines: medians; upper limits of boxes: third quartile; whiskers: minimum and maximum; dots: outliers. LKR: Sri Lankan Rupees. In 2025, USD 1 ≈ LKR 300. |
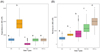 |
Fig. 6 Box plots of (A) total operational cost and (B) net revenue (= value of catch – operational cost) per fishing trip. LL: longlining; GN: drift gillnetting; RN: ring netting; RN+GN: combination of gillnetting and ring netting; and RN+LL: combination of longlining and ring netting. lower limits of boxes: first quartile; horizontal lines: medians; upper limits of boxes: third quartile; whiskers: minimum and maximum; dots: outliers. The boxes with similar letters were not significantly different. LKR: Sri Lankan Rupees. In 2025, USD 1 ≈ LKR 300. |
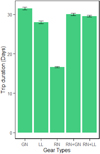 |
Fig. 7 Mean trip duration (±S.E.) of each fishing method. GN: drift gillnetting; RN: ring netting; RN+GN: combination of gillnetting and ring netting; and RN+LL: combination of longlining and ring netting. |
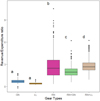 |
Fig. 8 Box plots of revenue/expenditure ratio of each fishing operation. LL: longlining; GN: drift gillnetting; RN: ring netting; RN+GN: combination of gillnetting and ring netting; and RN+LL: combination of longlining and ring netting. lower limits of boxes: first quartile; horizontal lines: medians; upper limits of boxes: third quartile; whiskers: minimum and maximum; dots: outliers. The boxes with similar letters were not significantly different. |
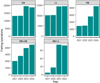 |
Fig. 9 Reported number of fishing trips of multiday boats operated from the fishery harbors of Sri Lanka during 2021–2024 (DFAR, 2025). GN: gillnet only; LL: longline only; RN: ring net only; RN+GN: ring nets and gillnet; RN+LL: ring nets and longline. |
4 Discussion
The species caught in flotsam-associated ring net fisheries are essentially those associated with FADs, and in various open sea areas of the Indian Ocean, major species caught in fisheries associated with FADs are identical (Amandè et al., 2008; Noranarttragoon et al., 2013). Hence, species such as D. russelli, E. bipinnulata, and C. maculata can be considered as shade-loving species. The dolphinfish, Coryphaena hippurus, is also caught in the ring net fishery, possibly due to the reason that this voracious predatory fish is attracted to fish aggregations for feeding. Interestingly, the species assemblages in the fisheries that combine ring nets with longlines or gill nets are similar to those that are caught when the three fishing methods are operated separately (Tab. 1 and Fig. 2). As shown by patterns of the landings of RN, RN+GN, and RN+LL using the SOM approach, the influence of monsoon seasons was not evident, but fishing strategies were. Due to the clear-cut difference in catch composition of the multiday boats operated by the three fishing methods and those with a combination of fishing methods, individual boats can be introduced to fishing licenses for MCS of high seas fishing. The RFMO, Indian Ocean Tuna Commission (IOTC), advocates MCS for high seas fishing.
The recent development of flotsam-associated ring netting underlines the need for management given that, as evidenced by the present analysis and by Punyadewa et al. (2025), juvenile tuna species such as K. pelamis, T. albacares, and E. affinis are also caught in significant numbers. It has been reported that in many areas of the Indian Ocean, such as the Gulf of Thailand (Noranarttragoon et al., 2013), Panay Gulf, off the Philippines (Mitsunaga et al., 2013), and elsewhere (Dupaix et al., 2024), in the fisheries associated with natural or artificial fish aggregating devices (FADs), juvenile tunas are caught.
Multiday boats rely on conventional means of finding productive fishing grounds through their experience, such as various landmarks, the behavior of sea birds, inter-vessel communication, etc. Although fisheries authorities regularly provide multiday boats with fishing ground forecasting information based on satellite remote sensing approaches using sea surface temperature, wave height, chlorophyll distribution, etc., fishers do not rely on them as this information is believed to be unrealistic (Gunawardane et al., 2023). For more accurate forecasting of productive fishing grounds, an operational information system, which requires significant investment and ongoing maintenance (Sun et al., 2022), is difficult to be implemented in the immediate future. This ad hoc nature of finding fishing grounds invariably results in increased “searching time”, having longer trip duration.
Longer trip duration invariably increases fuel cost. Although the cost of food for crew members and the cost of ice are more or less similar in multiday boats irrespective of fishing methods employed (Fig. 5), the variations of operational cost appear to be due to fuel cost. Compared with gillnetters and longliners, fishing duration, which reflects search time or time spend to reach the fishing location, was much lower in boats engaged in ring netters (Fig. 7). Hence, the lowest operational cost of ring net fishing (Fig. 6A) and higher revenue per fishing operation, which were statistically significant, might possibly be due to shorter trip duration and due to the reason that the skipper of the boat turns off the engine to save fuel cost and allows the boat to drift passively along the water current.
Although species caught in ring nets are of low value compared with those caught in longlines and drift gillnets, due to higher catch per fishing operation and lower operational cost, net revenue in each fishing operation is higher in boats operating ring nets and a combination of fishing gear (Fig. 6B). This is further substantiated by revenue per expenditure ratios of fishing methods having significantly higher ratios in boats operating ring nets and combinations of fishing gear (Fig. 8). From this evidence, it is understandable that in the deep-sea sector of Sri Lankan marine fisheries, the driving force for motivating fishers to adopt ring netting is attributed to higher financial benefits compared with gillnetting and longlining.
It is well-accepted that the profitability of the fishing fleets is very sensitive to fuel price variations (Sumaila et al., 2008; Cheilari et al., 2013). Balanced relationships between fish resources and fishing effort may improve prospects of coping with higher fuel prices. The present study highlighted that fishers tend to switch to more profit-oriented fishing strategies due to the absence of effective and accurate forecasting mechanisms. This aspect deserves further investigation because increasing trends of ring netting, from which tuna juveniles are noticeably caught, require special attention in terms of important management implications. The provision of fuel subsidies as an alternative means is not advisable even as capacity-enhancing subsidies for gillnet and longline fisheries targeting tuna stocks. This is particularly so because the global trend is that albeit with some struggles in many situations, efforts are in place to eliminate fisheries subsidies, including fuel subsidies, which contribute to overfishing (Sumaila et al., 2019). Also, with the prospects of establishing FADs to enhance fish stocks off Sri Lanka (Ministry of Fisheries, 2022), sound scientific investigations are required to understand their real potential impact on pelagic fish stocks and that many shade-loving fish species and juveniles of tuna species are caught by ring net fisheries. It is also worthwhile perceiving that there are opinions that catching juvenile tuna around floating objects does not necessarily result in overfishing of stocks (Dagorn et al., 2013). However, actual management concern is what proportion of juvenile tuna is caught. Hence, with the current increase in fishing with FADs, fisheries authorities must impose restrictions on the fishery through the existing legal framework to introduce high seas license (HSL) systems for the fisheries associated with floating objects. Presently, under the marine fisheries regulations of the country, obtaining an HSL is mandatory only for fishing in the international waters outside the EEZ of Sri Lanka.
5 Conclusion
The multiday fishing boats operating from the fishery harbors of Sri Lanka in the Indian Ocean primarily target tuna species using drift gillnets and longlines. The recent development of using ring nets in many boats to exploit pelagic fish aggregated around natural floating objects such as drifting logs has resulted in dramatic change in species composition of the landings of multiday boats because many species caught in flotsam-associating ring net fisheries are shade-loving species such as D. russelli, E. bipinnulata, and C. maculata. However, there are concerns regarding management perspectives because juvenile tunas are also attached to natural floating objects. However, due to prominent differences in species composition of landings of longlining, drift gillnetting, and flotsam-associated ring netting as well as in the combination of ring netting with longlining and gillnetting, there are ample opportunities for fisheries authorities to effectively implement MCS procedures for the fisheries of multiday fishing fleets.
The increasing trend of ring net fishing associated with flotsam off Sri Lanka appears to be due to higher net revenue than in other fishing methods coupled with lower trip duration and higher catch per fishing operation. This ensues despite lower-valued species caught in ring netting compared with high-valued tuna and tuna-like fish species in drift gillnetting and longlining. In the absence of a reliable means to provide fishers with productive fishing ground forecasting information, fishers of the boats operating longlining and gillnetting are compelled to spend longer trip durations to reach fishing grounds, determined in an ad hoc manner based on conventional clues such as wave height, behavior of seabirds, etc. As the profitability of the fishing fleets is very sensitive to fuel price variations, fishers tend to switch to more profit-oriented fishing strategies due to the absence of effective and accurate fishing ground forecasting mechanisms. The MCS directed toward managing flotsam-associated ring net fishing is imperative because an uncontrolled increase of its fishing effort might pose threats to the sustainability of tuna stocks as their juveniles are caught in high magnitudes. It is also recommended that fisheries authorities impose restrictions on the fishery through the existing legal framework to introduce HSL for the fisheries associated with floating objects.
Acknowledgments
The National Aquatic Resources Research and Development Agency of Sri Lanka provided facilities to collect data. The assistance of skippers of fishing boats and boat owners is also acknowledged for allowing access to logbook records of fish catches and other details. All authors approved the version of the manuscript to be published.
Data availability statement
The data that support the findings of this study are available on request from the corresponding author [USA].
References
- Alhoniemi E, Himberg J, Parviainen J, Vesanto J. 1999. SOM-Toolbox 2.0. https://github.com/ilarinieminen/SOM-Toolbox. (accessed 05 December 2025). [Google Scholar]
- Amandè MJ, Ariz J, Chassot E, et al. 2008. Bycatch and discards of the European purse seine tuna fishery in the Indian Ocean: Characteristics and estimation for the 2003–2007 period. Indian Ocean Tuna Commission document, IOTC-2008-WPEB-12, 23 p. [Google Scholar]
- Ariyarathna MM, Amarasinghe US. 2012. A fishery associated with floating objects in the Indian ocean off southern Sri Lanka. Asian Fish Sci. 25: 278–289. [Google Scholar]
- Chathurika KBE, Dissanayake DCT. 2016. Initial study on catch, species composition and reproductive biology of fishes off the south-west coast of Sri Lanka, targeted by ring nets while utilizing natural floating objects. J. Appl. Ichthyol. 32: 464–470. [Google Scholar]
- Cheilari A, Guillen J, Damalas D, Barbas T. 2013. Effects of the fuel price crisis on the energy efficiency and the economic performance of the European Union fishing fleets. Mar. Policy 40: 18–24. [Google Scholar]
- Coulter A, Cashion T, Cisneros-Montemayor AM, Popov S, Tsui G, Le Manach F, Schiller L, Palomares MLD, Zeller D, Pauly D. 2020. Using harmonized historical catch data to infer the expansion of global tuna fisheries. Fish Res. 221: 105379. [Google Scholar]
- Dagorn L, Holland KN, Restrepo V, Moreno G. 2013. Is it good or bad to fish with FADs? What are the real impacts of the use of drifting FADs on pelagic marine ecosystems? Fish Fish. 14: 391–415. [Google Scholar]
- Davies TK, Mees CC, Milner-Gulland EJ. 2014. The past, present and future use of drifting fish aggregating devices (FADs) in the Indian Ocean. Mar. Policy 45: 163–170. [Google Scholar]
- Dempster T, Taquet M. 2004. Fish aggregation device (FAD) research: gaps in current knowledge and future directions for ecological studies. Rev. Fish Biol. Fish. 14: 21–42. [Google Scholar]
- DFAR. 2025. Fishing boat operation licenses and online departure data base of the Department of Fisheries and Aquatic Resources, 2024. https://www.msdfar.com (accessed 19 April 2025). [Google Scholar]
- Dunn OJ. 1964. Multiple comparisons using rank sums. Technometrics 6: 241–252. [Google Scholar]
- Dupaix A, Ménard F, Filmalter JD, Baidai Y, Bodin N, Capello M, et al. 2024. The challenge of assessing the effects of drifting fish aggregating devices on the behaviour and biology of tropical tuna. Fish Fish. 25: 381–400. [Google Scholar]
- FAO. 1995. Code of Conduct for Responsible Fisheries. Rome, FAO. 41p. [Google Scholar]
- Fréon P, Dagorn L. 2000. Review FAO. 1995. Code of Conduct for Responsible Fisheries. Food and Agriculture Organization of the United Nations, Rome, p. 41. [Google Scholar]
- Gulland JA. 1983. Fish stock assessment: A Manual of Basic Methods, FAO/Wiley Series on Food and Agriculture, Vol. 1, Wiley, Manchester, p. 223. [Google Scholar]
- Gunawardane NDP, de Croos MDST, Amarasinghe US. 2023. Spatio-temporal patterns of the multi-day fishing in the Indian Ocean off Sri Lanka, and their importance for fisheries monitoring, control and surveillance. Reg. Stud. Mar. Sci. 66: 103168. [Google Scholar]
- Hewapathirana HPK, Maldeniya R, Perera ULK. 2015. Sri Lanka: National Report to the Scientific Committee of the Indian Ocean Tuna Commission, 2015. IOTC-2015-SC18-NR26. Indian Ocean Tuna Commission, Victoria, Mahé, Seychelles. [Google Scholar]
- Hilborn R, Branch TA, Ernst B, Magnusson A, Minte-Vera CV, Scheuerell MD, Valero JL. 2003. State of the world’s fisheries. Annu. Rev. Environ. Resour. 28: 359–399. [Google Scholar]
- Kivilnoto K. 1996. Topology preservation in self-organizing maps, Proceedings of ICNN’96, IEE International Conference on Neural Networks, IEEF, Service Center. [Google Scholar]
- Kohonen T. 2001. Self-Organizing Maps, 3rd edn, Springer, Berlin. https://doi.org/10.1007/978-3-642-56927-2. [Google Scholar]
- Kohonen T. 2014. MATLAB Implementations and Applications of the Self-Organizing Map, Unigrafia Oy, Helsinki, Finland, ISBN: 9789526036786 [Google Scholar]
- Lek S, Guégan JF. 2000. Artificial Neural Networks: Application To Ecology and Evolution, Springer Verlag, Berlin, https://doi.org/10.1007/978-3-642-57030-8. [Google Scholar]
- Lek S, Scardi M, Verdonschot PEM, Descy J-P, Park Y-S. 2005. Modelling Community Structure in Freshwater Ecosystems, Springer-Verlag, Berlin, p. 518. https://doi.org/10.1007/b138251. [Google Scholar]
- Ministry of Fisheries (MoF). 2022. Mid-term Plan 2023–2027. Ministry of Fisheries, Colombo, p. 39. [Google Scholar]
- Mitsunaga Y, Endo C, Babaran RP. 2013. Schooling behavior of juvenile yellowfin tuna Thunnus albacares around a fish aggregating device (FAD) in the Philippines. Aquat. Living Resour. 26: 79–84. [Google Scholar]
- Noranarttragoon P, Sinanan P, Boonjohn N, Khemakorn P, Yakupitiyage A. 2013. The FAD fishery in the Gulf of Thailand: time for management measures. Aquat. Living Resour. 26: 85–96. [Google Scholar]
- Park Y-S, Céréghino R, Compin A, Lek S. 2003. Applications of artificial neural networks for patterning and predicting aquatic insect species richness in running waters. Ecol. Modell. 160: 265–280. [Google Scholar]
- Park Y-S, Oberdoff T, Lek S. 2005. Patterning riverine fish assemblages using an unsupervised neural network, in: Lek S, Scardi M, Verdonschot PFM, Descy JP, Park Y-S (Eds.), Modelling Community Structure in Freshwater Ecosystems, Springer-Verlag, Heidelberg, pp. 43–53. https://doi.org/10.1007/3-540-26894-4_5. [Google Scholar]
- Park Y-S, Grenouillet G, Esperance B, Lek S. 2006. Stream fish assemblages and basin land cover in a river network. Sci. Total Environ. 365: 140–153. [Google Scholar]
- Punyadewa NBP, Deepananda KHMA, Gunawardane NDP, Digamadulla DS, Amarasinghe US. 2025. A flotsam-associated fishery in the Indian Ocean, and its potential impact on pelagic bycatch species. Sri Lanka J. Aquat. Sci. 30: 83–100. [Google Scholar]
- R Core Team. 2022. R: A Language and Environment for Statistical Computing. R Foundation for Statistical Computing, Vienna. https://www.R-project.org [Google Scholar]
- Ross RR, Savada AM. 1990. Sri Lanka: A Country Study, 2nd edn, Area Handbook Series, Library of Congress, Federal Research Division, Washington DC, p. 322. [Google Scholar]
- Rousseau Y, Watson RA, Blanchard JL, Fulton EA. 2019. Evolution of global marine fishing fleets and the response of fished resources. Proc. Natl. Acad. Sci. U.S.A. 116: 12238–12243. [Google Scholar]
- Sumaila UR, Teh L, Watson R, Tyedmers P, Pauly D. 2008. Fuel price increase, subsidies, overcapacity, and resource sustainability. ICES J. Mar. Sci. 65: 832–840. [Google Scholar]
- Sumaila UR, Ebrahim N, Schuhbauer A, Skerritt D, Li Y, Kim HS, Mallory TG, Lam VWL, Pauly D. 2019. Updated estimates and analysis of global fisheries subsidies. Mar. Policy 109: 103695. [Google Scholar]
- Sun C, Hobday AJ, Condie SA, Baird ME, Eveson JP, Hartog JR, et al. 2022. Ecological forecasting and operational information systems support sustainable ocean management. Forecasting 4: 1051–1079. [Google Scholar]
- United Nations. 2025. United Nations Fish Stocks Agreement: A Guide for Raising Awareness, Furthering Understanding and Strengthening Implementation of its Provisions. United Nations, Office of Legal Affairs Division for Marine Affairs and the Law of the Sea, New York, p. 279. [Google Scholar]
- Vatanen T, Osmala T, Raiko K, Lagus M, Sysi-Aho M, Orešič T, Honkela H, Lähdesmäki M. 2015. Self-organization and missing values in SOM and GTM. Neurocomputing 147: 60–70. [Google Scholar]
- Vesanto J. 2005. SOM implementation in SOM toolbox. SOM toolbox online help. Available online: http://www.cis.hut.fi/projects/somtoolbox/documentation/somalg.shtml. (accessed 05 December 2025). [Google Scholar]
- Vesanto J, Himberg J, Alhoniemi E, Parhankangas J. 2000. SOM Toolbox for Matlab 5. SOM Toolbox Team. Helsinki University of Technology, Helsinki, Finland, http://www.cis.hut.fi/projects/somtoolbox/. (Accessed on 05 December 2025). [Google Scholar]
- Vierros M, Suttle CA, Harden-Davies H, Burton G. 2016. Who owns the ocean? Policy issues surrounding marine genetic resources. Limnol. Oceanogr. Bull. 25: 29–35. [Google Scholar]
Cite this article as: Punyadeva N.B.P., Deepananda K.H.M.A., Digamadulla D.S., Gunawardane N.D.P., Amarasinghe U.S. 2026. Variation in catch composition in offshore fishing boats and motivation toward flotsam-associated fishing in the Indian Ocean: implications for management. Aquat. Living Resour. 39: 14. https://doi.org/10.1051/alr/2026008
Appendix
Fishing gear characteristics used in the multiday boats operated from Sri Lankan fishery harbors.
Appendix
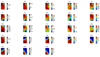 |
Appendix II Gradient analysis of fish species/species groups in the landings of RN, RN+GN, and RN+LL. Color bands (and in the neurons) for individual species/species groups indicate probabilities of occurrence. Abbreviations of species and species groups are as give in Table 1. |
All Tables
Species caught (kg per fishing operation) in boats of different fishing operations. Values in parentheses are number of fishing operations. –Abbrevitions of species/species groups: LL–, longlining; GN–, gillnetting; RN–, ring netting. S–, small individuals; L–, large individuals.
Fishing gear characteristics used in the multiday boats operated from Sri Lankan fishery harbors.
All Figures
|
Fig. 1 Fishing locations of boats of (A) gillnetting; (B) longlining; (C) ring netting; (D) ring netting plus gillnetting; and (E) ring netting and longlining, operated from four fishery harbors of Sri Lanka (BW: Beruwala; GL: Galle; GN: Gandara; TN: Tangalle) in the present analysis. |
| In the text | |
|
Fig. 2 Species composition for longliners (LL), drift gillnetters (GN), ring netters (RN), and their combinations (RN+GN, RN+LL). Total weights landed from the fishing operations observed from sampled boats are also given here. The number of fishing operations from each fishing method is as given in Table 1. L, large fish; S, small fish. |
| In the text | |
|
Fig. 3 The output neurons of SOM with 101 sample vectors. (A) The U-matrix with a shading intensity of the level of activation; (B) Partitioning of the 50 hexagons into 4 clusters by the K-means algorithm; (C) SOM classification based on the similarity of CPUE of fish species/species groups; and (D) Hierarchical clustering (Euclidean distance on the vertical axis), based on the similarity between SOM neurons. |
| In the text | |
|
Fig. 4 Probability of occurrence (%) of each species/species group in the four SOM clusters, as determined from the weight of virtual vectors of unsupervised SOM. Red-colored columns indicate bycatch species. Species abbreviations are as given in Table 1. |
| In the text | |
|
Fig. 5 Box plots of expenditure for food, fuel, and ice for each fishing operation in different fishing methods. LL: longlining; GN: drift gillnetting; RN: ring netting; RN+GN: combination of gillnetting and ring netting; and RN+LL: combination of longlining and ring netting. lower limits of boxes: first quartile; horizontal lines: medians; upper limits of boxes: third quartile; whiskers: minimum and maximum; dots: outliers. LKR: Sri Lankan Rupees. In 2025, USD 1 ≈ LKR 300. |
| In the text | |
|
Fig. 6 Box plots of (A) total operational cost and (B) net revenue (= value of catch – operational cost) per fishing trip. LL: longlining; GN: drift gillnetting; RN: ring netting; RN+GN: combination of gillnetting and ring netting; and RN+LL: combination of longlining and ring netting. lower limits of boxes: first quartile; horizontal lines: medians; upper limits of boxes: third quartile; whiskers: minimum and maximum; dots: outliers. The boxes with similar letters were not significantly different. LKR: Sri Lankan Rupees. In 2025, USD 1 ≈ LKR 300. |
| In the text | |
|
Fig. 7 Mean trip duration (±S.E.) of each fishing method. GN: drift gillnetting; RN: ring netting; RN+GN: combination of gillnetting and ring netting; and RN+LL: combination of longlining and ring netting. |
| In the text | |
|
Fig. 8 Box plots of revenue/expenditure ratio of each fishing operation. LL: longlining; GN: drift gillnetting; RN: ring netting; RN+GN: combination of gillnetting and ring netting; and RN+LL: combination of longlining and ring netting. lower limits of boxes: first quartile; horizontal lines: medians; upper limits of boxes: third quartile; whiskers: minimum and maximum; dots: outliers. The boxes with similar letters were not significantly different. |
| In the text | |
|
Fig. 9 Reported number of fishing trips of multiday boats operated from the fishery harbors of Sri Lanka during 2021–2024 (DFAR, 2025). GN: gillnet only; LL: longline only; RN: ring net only; RN+GN: ring nets and gillnet; RN+LL: ring nets and longline. |
| In the text | |
|
Appendix II Gradient analysis of fish species/species groups in the landings of RN, RN+GN, and RN+LL. Color bands (and in the neurons) for individual species/species groups indicate probabilities of occurrence. Abbreviations of species and species groups are as give in Table 1. |
| In the text | |
Current usage metrics show cumulative count of Article Views (full-text article views including HTML views, PDF and ePub downloads, according to the available data) and Abstracts Views on Vision4Press platform.
Data correspond to usage on the plateform after 2015. The current usage metrics is available 48-96 hours after online publication and is updated daily on week days.
Initial download of the metrics may take a while.