


| Issue |
Aquat. Living Resour.
Volume 39, 2026
Special Issue - Small pelagic fish in changing social-ecological systems
|
|
|---|---|---|
| Article Number | 18 | |
| Number of page(s) | 15 | |
| DOI | https://doi.org/10.1051/alr/2026014 | |
| Published online | 29 June 2026 | |
Research Article
Fatty acid allocation between muscle and gonads of Senegalese sardinellas under upwelling influence
1
CNRS, IRD, Univ Brest, Ifremer LEMAR F-29280 Plouzané, France
2
Univ Brest, Ifremer, BEEP, F-29280 Plouzané, France
3
IRD, Univ Brest, CNRS, Ifremer, LEMAR, Dakar, Sénégal
4
Centre de Recherche Océanographique de Dakar-Thiaroye (CRODT), Institut Sénégalais de Recherches Agricoles (ISRA), Route du Front de Terre, Dakar, Sénégal
* Corresponding author: This email address is being protected from spambots. You need JavaScript enabled to view it.
Received:
23
October
2025
Accepted:
5
June
2026
Abstract
Sardinellas (Sardinella aurita and Sardinella maderensis) are small pelagic fish that play a critical ecological and socio-economic role in West African coasts. These species primarily feed on plankton, a rich source of long chain polyunsaturated fatty acids (LC-PUFAs), including docosahexaenoic acid (DHA), arachidonic acid (ARA), and eicosapentaenoic acid (EPA). This study investigated the relationship between the muscle and gonad LC-PUFA profiles and the physiological status in both males and females at two periods of the upwelling season (January and March, 2022). Fatty acid profiles were measured in storage and membrane lipids to capture environmental and physiological variations, respectively. The ARA and DHA contents were largely enriched in membrane lipids as compared to reserve lipids. Within membrane lipids, gonads contained higher levels of LC-PUFA compared to muscle, suggesting preferential allocation to gonad structures. From January to March, Le Cren body condition index increased, associated to increasing reserve lipid storage. Additionally, gonad membrane showed an increasing DHA and a decreasing ARA contents. Altogether, these results suggest increasing lipid storage and investment for reproduction for both species and sexes. However, the gonado-somatic index of females remained stable between the two sampling periods, highlighting the importance to distinguish between the dynamics of gonadal biochemical composition and their morphological growth, two processes that may be decoupled depending on the maturation stage. Inter-specific differences were, however, observed: S. maderensis exhibited higher DHA and EPA concentrations in muscle reserves, and a higher ARA content in both reserves and membranes lipids compared to S. aurita, suggesting differential dietary LC-PUFA trophic regimes between species. Overall, our findings highlight the strong coupling between environmental conditions, dietary LC-PUFA availability and reproductive physiology in sardinellas. This emphasizes the critical role of LC-PUFA in supporting their reproductive success, and thus, to sustain the management and conservation of their populations in upwelling ecosystems.
Key words: n-3 LC PUFA / Sardinella aurita / Sardinella maderensis / condition index / gonado somatic index / Senegalese upwelling
Handling Editor: Koushik Roy and Pierre Boudry
These authors equally contributed to this study.
© M. Vagner et al., Published by EDP Sciences 2026
 This is an Open Access article distributed under the terms of the Creative Commons Attribution License (https://creativecommons.org/licenses/by/4.0), which permits unrestricted use, distribution, and reproduction in any medium, provided the original work is properly cited.
1 Introduction
The Canary Current Large Marine Ecosystem (CCLME) is one of the world's largest upwelling systems, supporting high primary and secondary productivity, and abundant coastal pelagic fishes (Arístegui et al., 2009; Diogoul et al., 2021). Fish catch in this region have reached more than 4.3 million tons annually since the 2010's, among which 50% have been small pelagic fishes (SPF) dominated by sardine (Sardina pilchardus), sardinellas (Sardinella sp.) and bonga shad (Ethmalosa fimbriata) (Sharma et al., 2025). These resources are exploited by artisanal, semi-industrial and industrial fisheries (local and foreign) resulting in a large number of people being dependent on these resources for their livelihoods (Failler, 2014, 2020; Deme et al., 2022).
In Senegal specifically, SPF are mainly exploited by artisanal fisheries (70% of the total catch) and represent the majority of landings, with an average of 300,000 tons each year over the period 2009–2018. They account for 82% of fish consumption and fed the various production and consumption sectors (Deme et al., 2022).
Among the two sardinella species in the CCLME, the round sardinella (Sardinella aurita) constitutes the most abundant stock (annual catch fluctuates around 535,000 tons between 2008 and 2015; Braham et al., 2024) and is found in two coastal nurseries: one in the northern half of Mauritania and one in the south of Dakar. The adults then move along the continental shelf, following the movements of the cold waters, so their migration is linked to the upwelling period (Braham and Corten, 2015; Brochier et al., 2018). The flat sardinella (Sardinella maderensis) caught along the Senegalese coast (about 132,000 tons/year) is more coastal and localized in Mauritania, the southern half of Senegal and Guinea-Bissau. Their migrations involve only a small number of adult individuals. Both species are short-lived (around 7 yr), planktivorous, are similar in shape and size (maximum fork-length ∼30 cm), are gregarious, live in shoals often composed of several species, and are often caught together in Senegal. Both species are able to reproduce almost all year but present two peaks of spawning, one during the cold season linked with upwelling events (intensity and temperature), which is highly variable according to year and area, and one in a warm season. S. maderensis usually shows a first reproductive period (including gonad maturation) from January to February, with a spawning peak in February, and a second one from April to October, with a spawning peak in June-August and then in October (Ba et al., 2016). S. aurita usually shows a first reproductive period from January to May, with a spawning peak in February or March, and a second one from October to December, with a spawning peak in October (Baldé et al., 2019). Both species take advantage of the higher productivity that occurs during upwelling period to sustain growth, and accumulate the energy necessary for reproduction. As their spawning is closely tied to upwelling intensity and temperature, any alteration of these processes may affect reproductive success of both species (Cury and Fontana, 1988; Baldé et al., 2019).
Sardinellas play a pivotal role in transferring essential nutrients produced by phytoplankton, particularly long-chain polyunsaturated fatty acids (LC-PUFA), to humans for which health benefits are largely recognized (e.g. protection against cardiovascular and cerebral disease, vision, foetus development) (e.g. Siriwardhana et al., 2012). Among LC-PUFA, eicosapentaenoic acid (EPA, 20:5n-3), docosahexaenoic acid (DHA, 22:6n-3), and arachidonic acid (ARA, 20:4n-6) are key constituents of cell membranes and precursors of numerous molecules, and are therefore important regulators of the metabolism. EPA and ARA are for example precursors of eicosanoids, involved in reproduction and immune systems (Tocher, 2015; Xu et al., 2022), while DHA is largely involved in the development of nervous system and reproductive function (Luo et al., 2015; Li et al., 2024; Rahi Roy et al., 2024; Liu et al., 2025). In fish, LC-PUFA influence growth, immunity, and reproduction in terms of gamete quality, spawning performance, the fatty acid composition of eggs, and larval quality (Tocher, 2003, 2010; Luo et al., 2015; Monroig et al., 2018; Figueroa Villalobos et al., 2025). Since fish have a limited ability to synthesize these fatty acids (Monroig et al., 2018), their dietary intake is crucial. In natural ecosystems, LC-PUFA are primarily produced by phytoplankton, making their availability a direct indicator of ecosystem productivity at the base of the aquatic food web (Arts et al., 2001; Kang, 2011; Gladyshev et al., 2009, 2013; Crawford and Broadhurst, 2012; Taipale et al., 2016; Xu et al., 2022).
Along the Senegalese coast, seasonal upwelling occurs between November and May, but satellite derived measurements from 1997 to 2012 indicate that the CCLME region has been experiencing a decrease in the upwelling intensity, a progressive warming, and a decrease in productivity over the last decades (Sambe et al., 2016). By disrupting their phyto- and zooplankton-based diets, this may decrease dietary supply of LC-PUFA for fish energy reserves, reproduction, with further consequences on fish stock quality, cascading on the decrease of LC-PUFA supply for human population (Hixson and Arts, 2016; Colombo et al., 2020; Holm et al., 2022). In addition, the demographic explosion of the human population worldwide is leading to increase the exploitation of SPF (Failler, 2020), and Senegalese sardinella stocks have been considered to be overexploited since 2006 (FAO, 2013). Sardinella growth rate is slowing, especially during periods of less intense upwelling (FAO, 2019), with increasing mortality and declining biomass for both species (Braham et al., 2024).
Management of SPF is hampered by a lack of sufficient and conclusive scientific data (Peck et al., 2021). Projecting the effects of climate change on SPF stocks in the context of overfishing requires to collect physiological data concerning growth and reproduction on the field to evaluate this relationship. In particular, the relationship between the integration of LC-PUFA in sardinella tissues and the physiological status of fish in CCLME region has never been investigated.
In this context, our hypotheses were that (i) the tissue fatty acid composition in reserves will vary similarly in both sardinella species, since they share a common shoal and they feed on similar prey; (ii) the upwelling period has an effect on the fatty acid composition of fish tissues, since biological activities such as reproduction result in energy expenditure depending on the intake of dietary fatty acids; (iii) the concentration of essential fatty acids in gonad is linked to the gonad maturation status, as estimated by the gonado-somatic index (GSI), as these fatty acids are involved in gamete quality and reproductive success. To test these hypotheses, fish of the two species were sampled at Thiaroye-Dakar at two periods (January and March, 2022) of the upwelling season that stands from November to April. The fatty acid composition of fish muscle and gonads were investigated, and their body condition was calculated.
2 Material and methods
2.1 Environmental conditions and fish sampling
The two sampling periods (March and January) used in this study theoretically cover the maturation period and the spawning peak of the two species (Ba et al., 2016; Baldé et al., 2019). A total of 47 individuals was collected on 27th January 2022 and 10th March 2022 (n = 12 S. aurita and n = 12 S. maderensis individuals at each date, except for S. maderensis in March for which n = 11; see Tab. 1 for details) along the Senegalese coast by professional fishermen using a purse seine, and landed at the harbour of Thiaroye-Dakar (Senegal; 14.743N, −17.384W). Immediately after landing, the fish were transported in ice to the ISRA/IRD centre of the LEMAR laboratory in Bel Air (Senegal), where they were measured to the nearest 1 mm and weighed to the nearest 0.01 g. Muscle and gonad samples were taken from each individual. Gonad weights and sex were recorded. These tissues were then immersed directly in liquid nitrogen and freeze-dried for 72 h before being stored at −80 °C until flying to LEMAR laboratory in France for fatty acid analysis.
The mean environmental conditions on the continental shelf of the Petite Côte, i.e. south of the Dakar peninsula, during the 10 days preceding these two collection dates were obtained from satellite-derived numerical models and are presented in Table 2.
Summary of the distribution in numbers (n) between species, months and sex of the sampled fish. SL = standard length (cm); TL = total length (cm); W = weight (g).
Environmental characterization of the continental shelf of the Petite Côte, i.e. south of the Dakar peninsula at the two sampling periods. Average (minimum–maximum) daily values on the surface over an area of 20,000 km2 for the ten days preceding the fish sampling (Source: Copernicus; numerical models from Mercator-Ocean).
Statistical results (degree of freedom, F, and p-value) of a linear model testing the effect of gonado-somatic index (GSI) and species and the interaction of the two factors on the LC-PUFA (DHA, ARA, EPA) concentration in polar lipids and in neutral lipids in the ovaries of sardinellas. DHA: docosahexaenoic acid; EPA: eicosapentaenoic acid; ARA: arachidonic acid.
2.2 Morphometric indices
2.2.1 Allometric weight-length relationships and relative condition factor
We calculated the relative condition factor Kn (Le Cren, 1951) as a proxy for somatic condition and individual's physiological status. Kn is an independent morphometric indicator based on the length-weight relationship and validated for sardinellas (Baldé et al., 2019). Kn values are distributed around 1, with values above 1 representing individuals in better condition than a standard individual of the same size and values below 1 representing individuals in worse condition. Length-weight relationships was established to calculate the Le Cren condition factor (Le Cren, 1951), such as (1):
 (1)
(1)
where W is the weight (g) and LS is the standard length (cm), and a and b are estimated parameters. In the present study, the values of a and b were estimated from the weight-length relationship of the 48 individuals as a = 0.0093 and b = 3.2439 (R2 = 0.90). The relationship obtained was in accordance to that obtained by Baldé et al. (2019) for S. aurita and Ba (2016) for S. maderensis (Tab. S1).
The condition factor was defined using the Le Cren index from:
 (2)
(2)
Where Wobs is the observed weight and Wth is the theoretical weight (the weight predicted by Eq. (1).
2.2.2 Maturation status
The gonadosomatic index (GSI, % of fresh fish weight) is used as an indicator of energy invested in reproduction, and indicated the stage of gonad maturation. Its evolution between January and March measures the evolution of the reproductive effort over this period, and give some indication about the occurrence of the laying period. GSI (in %) was calculated using the following relationship (3):
 (3)
(3)
Where Wgonad is the weight of gonads and W is the total wet weight of the individuals.
2.3 Fatty acid analysis
Fatty acid composition of gonad and muscle tissues was determined on freeze-dried samples (stored at −80 °C) at the LIPIDOCEAN analytic platform (LEMAR laboratory, France).
2.3.1 Lipid extraction
Freeze-dried samples were grounded for 5 min in a 2 ml Eppendorf tube containing stainless steel beads using a vibratory mill (MM400 Retsch) to obtain a homogeneous powder. Approximately 50 mg of powder was placed in glass vials to which 6 ml of a mixture of chloroform and methanol (CHCl3/MeOH, 2:1, v/v) was added. This mixture was then placed in an ultrasonic bath (Fisherbrand Elmasonic S-15) for 10 min and then stirred with a shaker (Heidolph Titramax 101) for 20 min. Lipid extracts were then stored under nitrogen atmosphere at −20 °C for 24 h to ensure complete lipid extraction (Couturier et al., 2020).
2.3.2 Separation of neutral lipids and polar lipids
The extracted lipids were separated on a silica microcolumn into two fractions: a neutral lipid (NL, corresponding to the storage lipids) fraction and a polar lipid (PL, corresponding to the membrane lipids) fraction, according to the method described by Le Grand et al. (2014). From the stored lipid extracts, 1 ml was transferred to a 7 ml vial, which was then evaporated to dryness under nitrogen. Then, 0.5 ml CHCl3/MeOH (98:2; v/v) was added to the vials, taken up twice and applied to the top of the microcolumn (40 × 5 mm i.d., silica gel 60 previously heated at 450 °C and deactivated with 6 % water by weight). For NL elution, 10 ml of CHCl3/MeOH (98:2; v/v) was added to the column head, and for PL elution, 20 ml of MeOH was added to the column head. Each fraction was then collected in a 22-ml vial to which 20 μL of tricosanoic acid (C23:0, internal standard at 0.115 μg μL−1) had been previously added. After elution, the NL and PL fractions were evaporated (low pressure, 30 °C, Rotavap; Genevac EZ-2), diluted in 3 × 0.5 ml CHCl3/MeOH (2:1; v/v) and transferred to 7-ml vials, and stored under nitrogen at −20 °C until further processing.
2.3.3 Derivation
Derivation consisted of basic and acidic transesterification (Sardenne et al., 2022). For basic transesterification, lipid extracts containing 1.5 mL of CHCl3/MeOH (2:1; v/v) were evaporated to dryness under nitrogen (low pressure, 30 °C, Rotavap; Genevac EZ-2). Then, 1 ml potassium hydroxide (KOH-MeOH; 0.5M) was added to the dry extract that were then flushed with nitrogen to prevent oxidation. The vials were hermetically sealed to prevent evaporation of the solution, then heated to 80 °C for 30 min and cooled at room temperature. Then, 1600 μL MeOH-H2SO4 (3.7%; v/v) was added to the previously derivatized solution. The vials were shaken, hermetically sealed, and heated at 100 °C for 10 min before cooling to room temperature. Then, 800 µl of hexane and 1.5 ml of hexane-saturated distilled water were added to this solution. The mixture was centrifuged at 145 g for 1 min to separate the two phases. The lower phase (aqueous phase) was removed with a Pasteur pipette, followed by the addition of 1.5 ml of hexane-saturated distilled water to each flask and centrifugation again. This procedure was repeated twice. These steps allowed the samples to be washed of all acid, glycerol and hydroxide residues. The centrifuged mixture was placed at −20 °C. Once the lower phase was completely frozen, the unfrozen hexane phase (upper phase) containing fatty acid methyl esters (FAMEs) was transferred to a 2 ml vial for gas chromatographic analysis.
2.3.4 Gas chromatography analyses
The FAMEs were separated by gas chromatography coupled to two flame ionization detectors (GC-FID; Thermo TRACE 1300 equipped with a DBWAX polar column and a DB5 apolar column, 30 m × 0.25 mm i.d. × 0.25 µm). The sample (2 μL) was injected in spitless mode in parallel onto the two columns to facilitate the identification of fatty acid peaks in case of co-elution on one of the two columns. The columns were heated according to a predefined temperature ramp, which allowed the separation of FAMEs according to weight and polarity: 30 °C to 150 °C at 50 °C min−1, from 150 °C to 170 °C at 3.5 °C min−1, from 170 °C to 185 °C at 1.5 °C min−1, from 185 °C to 225 °C at 2.4 °C min−1, and finally from 225 °C to 250 °C at 5.5 °C min−1, with this final temperature maintained for 25 min. Dihydrogen was used as the carrier gas.
2.3.5 Chromatogram analysis
The resulting chromatograms were then processed using Chromeleon 7.0 software to identify and quantify FAME. Prior to analysis, the magnitude of the internal standard C23:0 peak area and the baseline of the chromatogram were checked. Fatty acids were identified by comparing their retention times with reference chromatograms of commercial and in-house standards GC-MS certified (S37, FAME MIX, PUFA 1 and PUFA 3, Supelco). A total of 70 fatty acids were finally identified. For each fatty acid, the peak area was converted to mass (µg mg−1 dry weight) and then to percentage of the total mass of fatty acids in the NL or PL fractions.
2.4 Statistical analysis
All statistical analyses were performed in R (v. 2021.09.2; R Core Team, 2024). Only the 18 fatty acids representing an average of more than 0.5% of the total fatty acid content were included in the multivariate analyses, after being transformed into centred log ratios. A Principal Component Analysis (PCA; package FactoMineR) was used to visualize variations in the FA proportions between tissues, lipid fractions, species, sampling months and sexes.
Permutational multivariate variance analysis based on Euclidian distance matrices (PERMANOVA, Anderson, 2001; package vegan, adonis2 function) was used to test for significant differences in the general FA proportions between tissue, sampling months, sex, species and lipid fraction. Homoscedasticity of residuals was checked using betadisper function (package vegan).
Mixed linear models (package nlme) were used to test the effects of species, sampling month, and sex on body condition indices (Le Cren index, GSI, ratio NL/PL), as well as to test the effect of species, sampling month, sex, tissue, and lipid fraction on EPA, ARA and DHA fatty acid concentrations. Sex, season, species and fraction were considered as fixed factors and the individual as a random factor. The most parsimonious model, i.e. with the lower Akaike's information criterion (AIC), was always the complete one. Normality and homoscedasticity of residuals were visually checked by QQ-plots. The relative importance of each factor and interaction in explaining DHA, EPA and ARA concentrations was calculated using the partial omega-squared (ω2) statistic with the omega_squared function (effectsize package).
Mixed linear model (lme) were used to test the effect of GSI and species (fixed factors) on the LC-PUFA concentrations (ARA, EPA, DHA) measured in female gonad membrane and reserve lipids. Individual was considered as a random factor.
3 Results
The two sampling periods were contrasted in terms of productivity and temperature, with March corresponding to a colder period with higher productivity (chlorophyll-a, net primary production and zooplankton) than January (Tab. 2).
3.1 Fish physiological condition
Le Cren index was not impacted by any interactions between the factors tested (species, sex, and month), and was not different between sexes (Fig. 1A, Tab. S1 for statistical details). However, the linear model shows an effect of species (p-value < 0.01) with higher values in average for S. maderensis (1.03 ± 0.08) than for S. aurita (0.98 ± 0.04). It also displayed an effect of the sampling month with higher values in March (1.04 ± 0.07) than in January (0.96 ± 0.04) for both species and regardless the sex (p-value < 0.001).
GSI was impacted by an interaction between sex and sampling month (p < 0.05), but was similar between species (3.8% ± 1.9% and 3.5% ± 1.7% for S. maderensis and S. aurita, respectively; Fig. 1B; See Tab. S2 for statistical details). For females, GSI was relatively variable among individuals but remained generally stable across seasons (2.8% ± 0.8% and 3.7% ± 2.2% for January and March, respectively). However, GSI of males was less variable among individuals and decreased significantly from January to March (4.7 ± 1.8 and 3.2 ± 1.6, for January and March, respectively; Tab. S2).
The NL/PL ratio (proxy for energy storage), was impacted by an interaction between tissue and species) with higher values in muscle than in gonad, especially in S. maderensis (p < 0.01; Fig. 2, Tab. S3 for statistical results). This ratio was overall higher in females than in males (p = 0.01) and increased from January to March for both species and sexes (p < 0.05, Tab. S3; Fig. 2).
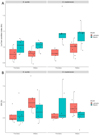 |
Fig. 1 Le Cren condition index (A) and gonado somatic index (GSI, B) for males and females sardinella (Sardinella aurita and Sardinella maderensis) sampled at two periods (January, March) of the upwelling season at Thiaroye harbor (Senegal). For Le Cren, linear model shows an effect of species (p < 0.01) and of sampling month (p < 0.001; see Tab. S1 for statistical details). For GSI, linear mixed model shows an interactive effect between sex and sampling month (p < 0.05; See Tab. S2 for statistical details). |
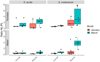 |
Fig. 2 Ratio Neutral lipid/Polar lipids (proxy for energy storage) for males and females sardinella (Sardinella aurita ; Sardinella maderensis) sampled at two periods (January, March) of the upwelling season at Thiaroye harbor (Senegal). Linear mixed model shows an interactive effect between species and tissue, as well as an effect of month and sex (See Tab. S3 for statistical details). |
3.2 Fatty acid composition
3.2.1 Fatty acid profiles in percentage
The PCA biplot (Fig. 3) revealed a clear separation between lipid fractions (PL vs NL) and tissues type (gonad vs muscle) based on their fatty acid percentages. Along the first principal component (Dim.1, explaining 25.4% of the variance), samples associated with the PL fraction cluster to the left, while those from the NL fraction cluster to the right. PL were characterized by higher proportions of LC PUFA (22:5n-6, DHA, ARA), while NL were mostly discriminated by monounsaturated fatty acids MUFA (16:1n-7; 18:1n-7, 20:1n-9; 18:1n-9), SFA (14:0), 20:4n-3, 18:4n-3 and 20:2n-9. Tissue type (gonad versus muscle) were separated along the second dimension (Dim. 2, explaining 15% of variance), with gonad characterized by higher proportions of 22:5n-3, 18:1n-7, 20:4n-3 than muscle. Interestingly, EPA does not appear as a discriminating fatty acid as its cos2 was below 0.35.
More specifically, gonad PL were discriminated by their ARA proportions, while muscle PL were characterized by 22:5n-6. Muscle NL were discriminated by MUFA (20:1n-9, 18:1n-9), 20:2n-9 and 18:4n-3 proportions, while gonad NL were mostly discriminated by their higher proportions in 18:1n-7 and 20:4n-3.
The tested factors (fraction, tissue, month, sex, and species) and their interactions together explained approximately 72% of the variability observed in the fatty acid profile (expressed as percentages; PERMANOVA; Tab. S4). Among these, the lipid fraction (NL vs PL) explained 39% of the variability, followed by tissue (5%), sex (4%), sampling month (4%), and species (1%). Significant interactions between factors explained 5% or less of the variability observed in the fatty acid profile of fish tissue (Tab. S4).
The PCA biplot (Fig. 4A) performed on fatty acid composition of muscle reserves, a proxy of dietary imprint, revealed a separation between months and species. Along the first component (Dim.1, explaining 33.2% of the variance), individuals sampled in March mostly clustered to the left, and were discriminated by higher proportions of 16:3n-4, 16:2n-4, 21:5n-3 and EPA, while those sampled in January mostly clustered to the right, with higher proportions of 22:1n-11, 22:0, 20:4n-6, 17:0. To a less extend, species were separated along the second dimension (Dim. 2, explaining 16.4% of variance), with S. maderensis mostly clustered to the upper part of the PCA, while S. aurita mostly clustered to the lower part. S. maderensis seemed more discriminated by higher proportions of 20:1n-9, 20:1n-7, 18:3n-3, 14:0, while S. aurita seemed more discriminated by 18:1n-9 and 18:4n-3.
The PCA biplot (Fig. 4B) performed on fatty acid composition of gonad reserves revealed a separation between sexes and months. Along the first component (Dim. 1, explaining 35.1% of the variance), females clustered to the left, discriminated by higher proportions of ARA, DHA, EPA, 22:5n-3, while males clustered to the left with higher proportions of 16:3n-4, 16:2n-4, 16:1n-7. Separation between months depends on the sex considered: Females in January are clustered to the left upper part, with higher proportions of ARA, EPA, 22:5n-3, DHA, while in March, they clustered to the lower part, with higher proportions of 22:4n-6, 20:2n-9, 20:1n-7, 18:1n-9. Males did not display such differences of fatty acid profiles according to the month, as they were mostly clustered to the upper left side of the PCA, and discriminated by higher proportions of 16:4n-3, 16:2n-4, 16:1n-9, 18:2n-4, 20:4n-3.
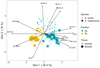 |
Fig. 3 Principal Component Analysis (PCA) biplot based on fatty acid profiles (in % of NL-FA or PL-FA). Each dot represents an individual, positioned according to its coordinates on the first two principal components. Colors display the lipid fractions (NL = neutral lipids in yellow, PL = polar lipid in blue), shapes display the species (circle = Sardinella aurita; square = Sardinella maderensis), and size display the tissue type (smaller points = Gonad; larger points = Muscle). Arrows represent the most contributive variable fatty acids to the PCA axes (cos2 > 0.35), with their orientation and length indicating their direction and strength of contribution to each dimension. |
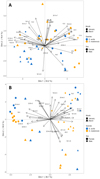 |
Fig. 4 Principal Component Analysis (PCA) biplot based on fatty acid profiles of (A) muscle reserve (in % of NL) and (B) gonad reserve (in % of NL). Each dot represents an individual, positioned according to its coordinates on the first two principal components. Shapes display the sampling month (circle = January; square = March), point sizes display the sex (large points: females; small points = males) and colors display the species (Sardinella aurita in blue, Sardinella maderensis in yellow). Arrows represent the fatty acids, with their orientation and length indicating their direction and strength of contribution to each dimension. |
3.2.2 Essential fatty acid concentrations
DHA, EPA and ARA concentrations exhibited high interindividual variability (coefficient of variation = 50%, 28% and 55%, respectively), with several interactions among the examined factors significantly influencing these concentrations (Tab. S5). In particular, the interaction between lipid fraction and tissue type accounted for the largest proportions of variability in DHA (35%), EPA (22%) and ARA (40%) concentrations (omega-squared function).
DHA variability was mostly explained by lipid fraction (69%), followed by tissue (61%) and sampling month (26%; p < 0.001 for the three factors; Tab. S5).
Overall, the DHA was more concentrated for both tissues in PL than in NL, and then by the tissue, more concentrated in gonad than in muscle (in PL: 13.7 ± 4.4 vs 5.4 ± 2.4 µg mg−1; in NL: 4.1 ± 2.1 vs 2.2 ± 2.5 µg mg−1, in gonad and muscle, respectively). DHA content in PL also generally increased from January to March but this was more obvious in gonads than in muscle (Fig. 5, Tab. S5). In addition, this was less observed in males of S. maderensis, in which it was instead the DHA content in reserves that increased from January to March (Fig. 5; lm Sex:Fraction p < 0.01; Tab. S5).
EPA variability was mostly explained by sampling months (47%), followed by tissue (25%) and sex (23%; p < 0.001 for the three factors, Tab. S5).
In both tissues and fractions, EPA concentration was similar in both species in January (2.2 ± 1.6 in S. maderensis vs 2.9 ± 2.3 µg mg−1 in S. aurita), while it was higher in S. maderensis than in S. aurita in March (5.4 ± 3.5 vs 4.2 ± 3.4 µg mg−1, respectively; Fig. 6; Tab. S5). EPA was more concentrated in PL than in NL in gonads (5.8 ± 2.3 in PL vs 3.5 ± 2.7 µg mg−1 in NL, Fig. 6; Tab. S5), while it was more concentrated in NL than in PL in muscle (3.6 ± 4.1 in NL vs 1.7 ± 1.2 µg mg−1 in PL, Fig. 6; Tab. S5). In average, EPA concentration was similar in NL and PL in both males and females of both species, except in male S. aurita, in which it was less concentrated in NL than in PL (Fig. 6; Tab. S5).
ARA variability was mostly explained by tissue (60%; p < 0.001), followed by the lipid fraction (55%; p < 0.001), the species (18%; p < 0.01), and the month (17%; p < 0.01; Tab. S5).
Overall, ARA concentration were higher in gonad than in muscle, especially in PL (gonad: 1.2 ± 0.4 vs 0.4 ± 0.2 µg mg−1 and muscle: 0.4 ± 0.1 vs 0.3 ± 0.4 µg mg−1, in PL and NL respectively; Fig. 7). and higher in January than in March, especially in gonads (January: 0.9 ± 0.5 vs 0.3 ± 0.2 µg mg−1; March: 0.7 ± 0.5 vs 0.3 ± 0.3 µg mg−1 in gonad and muscle, respectively; Fig. 7). Regardless of the tissue and the lipid fraction, ARA concentrations were higher for S. maderensis than for S. aurita (0.6 ± 0.4 vs 0.5 ± 0.5 µg mg−1, respectively ; p < 0.01, Tab. S5), but were similar between males and females (p = 0.97; Tab. S5; Fig. 7).
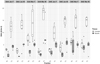 |
Fig. 5 DHA (docosahexaenoic acid; 22:6n-3) concentration (μg mg−1 DW) in neutral (NL) and polar (PL) lipids of gonad and muscle tissues of males (M) and females (F) Sardinella aurita (SAA) and Sardinella maderensis (SAE) at two contrasting periods of the upwelling season (January: Jan; March: Mar). See the text and Table S5 for statistical results. |
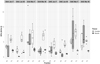 |
Fig. 6 EPA (eicosapentaenoic acid 20:5n-3) concentration (μg mg−1 DW) in neutral (NL) and polar (PL) lipids of gonad and muscle tissues of males (M) and females (F) Sardinella aurita (SAA) and Sardinella maderensis (SAE) at two contrasting periods of the upwelling season (January: Jan; March: Mar). See the text and Table S5 for statistical results. |
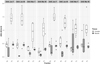 |
Fig. 7 ARA (arachidonic acid; 20:4n-6) concentration (μg mg−1 DW) in neutral (NL) and polar (PL) lipids of gonad and muscle tissues of males (M) and females (F) Sardinella aurita (SAA) and Sardinella maderensis (SAE) at two contrasting periods of the upwelling season (January: Jan; March: Mar). See the text and Table S5 for statistical results. |
3.3 Relationships between essential fatty acid concentration in gonad of females and their gonado-somatic index
The concentrations of DHA, EPA and ARA in the PL and NL of the ovaries were similar between the two species (p > 0.05), independent of the GSI and independent of the interaction between the GSI and species Table. 3.
4 Discussion
This study provides new insights into the relationship between the LC-PUFA tissue profile and the physiological status of S. aurita and S. maderensis in CCLME region across the upwelling season. We observed patterns consistent with previous reports in clupeids (e.g. Cury and Fontana, 1988; Garrido et al., 2007; Baldé et al., 2019), while also highlighting species- and sex-specific responses. The increasing Kn index and NL/PL ratio from January to March reflect enhanced feeding opportunities linked to plankton availability and energy storage, whereas temporal variability in LC-PUFA profiles, notably DHA and ARA, may reveal ongoing gonad maturation processes and reproductive investment. Moreover, temporal and interspecific differences in fatty acid profile may suggest contrasted trophic dietary regimes, likely influenced by the more migratory behavior of S. aurita as compared to the more sedentary S. maderensis.
4.1 Temporal variation in fish physiological condition
The relative condition index Kn measured in this study was in the same range as that previously reported in Senegalese sardinella (Ba et al., 2016; Baldé et al., 2019). The Kn increased in both males and females between January and March. This seasonal variation of Kn has already been reported for both species, with the highest values in March, i.e. during the cold season, when the plankton abundance is the highest (Cury and Fontana, 1988; Baldé et al., 2019). As Kn is a reliable proxy of somatic condition and physiological status, its higher value in March indicates a favorable feeding period for sardinellas, associated with greater stomach fullness and enhanced energy storage, as reflected by the higher percentage of reserve lipids in both species and sexes. This confirms an enhanced/increased productivity at this time of year, likely related to diatom blooms, as muscle reserves of both species were imprinted by higher proportions of diatom-derived fatty acid biomarkers (i.e. 16:3n-4, 16:2n-4, 16:4n-1, EPA ; Cañavate, 2019; Remize et al., 2021) compared to January.
4.2 Temporal variation in LC-PUFA profile in both sardinella species
The fatty acids profiles of the gonad and muscle we measured in sardinellas are in the same range as those reported in the same tissues of the European sardine Sardina pilchardus in Portugal (Garrido et al., 2007). For both species, we observed that DHA and ARA concentrations were mainly related to tissue type and to lipid allocation/distribution between structure and reserves. DHA and ARA dominated gonad membrane lipids (PL) across species or sex, which is consistent with their critical roles in reproductive function (Garrido et al., 2007; Tocher, 2010). From January to March, DHA concentration increased in gonads, while ARA decreased, suggesting different stages of gonad maturation between the two periods. The decline in ARA may reflect its conversion into eicosanoids essential signalling molecules for reproduction (Xu et al., 2017; Thiruvasagam et al., 2024). DHA enrichment supports oocyte maturation, fecundity, the production of sex hormones such as testosterone and 11-ketotestosterone and sperm quality, as reported in other teleost species (Tocher, 2003; Luo et al., 2015; Li et al., 2024; Rahi Roy et al., 2024; Liu et al., 2025).
Contrary to ARA and DHA, EPA concentration mainly depended on the sampling month, and then on tissue and species. EPA tended to accumulate more in the muscle reserve of S. maderensis than in S. aurita, particularly in March, when chlorophyll-a concentrations were the highest. There are two non-exclusive dietary hypotheses to explain this species difference in EPA accumulation: (i) As EPA increased along with 16:3n-4 and 16:2n-4, which are all primarily biosynthesized by diatoms in the food web of small pelagic fish (Cañavate, 2019; Bertrand et al., 2022; Neven et al., 2025), this may suggest that S. maderensis relied more heavily on a diatom-food web than S. aurita during this period of high chlorophyll-a levels. Supporting this hypothesis, a recent study along the southern coast of Angola has shown that S. maderensis exhibited a stronger positive correlation between feeding intensity (assessed through stomach content analyses, dominated by diatoms and copepods) and chlorophyll-a compared to S. aurita (Quiatuhanga et al., 2025). (ii) Alternatively, if diatoms are not limiting in the food web, the differing EPA accumulation in reserve between the two species may indicate that the two sardinella species did not rely on a diatom-food web in the same proportions. The migratory behavior of S. aurita versus the more sedentary S. maderensis may explain these differences (Baldé et al., 2019): As a migratory species, S. aurita exploits a broader diversity of food resources, differing in their FA signatures, while S. maderensis adapts to local environmental conditions (Bandara et al., 2023). Consequently, S. aurita exhibits a more mixed FA profile, masking local trophic signatures, whereas the more resident S. maderensis likely mirrors the structure of the local food web.
4.3 Relationship between LC-PUFA profile and gonad maturation status (GSI)
A different GSI pattern between males and females was observed for both species, with a decreasing GSI between January and March for males, while it remained stable for females. This may suggest that the sampled females have not spawn yet, while males may have already, and may have started a new gonad maturation cycle. These sex-specific temporal shifts align with previous observations of S. aurita and S. maderensis in the region (Baldé et al., 2019), highlighting asynchronous gonadal maturation.
As GSI remained stable in females from January to March, Le Cren condition index increased, indicating a concomitant growth of gonad and somatic tissues over that period. GSI was not related to the DHA content of female gonads, which increased over that period.
This result may suggest the occurrence of several non-exclusive physiological mechanisms: (i) an increase in DHA dietary availability from January to March might have induced an opportunistic accumulation in gonad. (ii) DHA is actively accumulated into developing oocytes during that maturation period to support oocyte synthesis and quality (Tocher, 2003; Luo et al., 2015; Li et al., 2024; Rahi Roy et al., 2024; Liu et al., 2025), inducing a changing in gonad biochemical composition, but not in GSI.
DHA accumulation and GSI may therefore operate on different timelines: DHA might peak earlier to support oocyte quality (Li et al., 2024), while GSI would increase later due protein accumulation and to hydration closer to spawning. The gonads examined here were visually assessed as being at stage II through IV (results not shown). As a spawning peak of females usually occurs in April (i.e. after our sampling periods; Ba et al., 2016), it is possible that DHA might be utilized at later stage for final maturation and spawning (Li et al., 2024).
These results highlight the importance of distinguishing between the dynamics of gonadal biochemical composition (e.g. DHA accumulation) and their morphological growth (GSI), two processes that may be decoupled depending on the maturation stage. Regular samplings across the maturation process, particularly during later stages, are then necessary to fully understand this relationship.
Taken together, the temporal dynamics of Le Cren, GSI and LC-PUFA profile in muscle and gonad underscore the vulnerability of small pelagic fish reproduction to environmental fluctuations and changes in food web dynamics. These findings have important implications under global change scenarios. Alterations in temperature, oxygen, or upwelling intensity could disrupt plankton availability and LC-PUFA productivity (Bode et al., 2009; Fréon et al., 2009; Hixson and Arts, 2016), that may consequently affect the LC-PUFA composition in sardinella tissues and later their reproductive success. For example, climate change has already been hypothesized to reduce spawning success in small pelagic fish in another upwelling system, the Humboldt Current (Brochier et al., 2013; Peck et al., 2021). This may have further consequence on fish stock dynamics and on the human populations depending on them (Arts et al., 2001; Kang, 2011; Crawford and Broadhurst, 2012; Colombo et al., 2020).
5 Conclusion
The present study shows that body condition and reproductive investment of sardinella present general common patterns, with higher Le Cren index in March than in January, and general similar variation in LC-PUFA profile across the two months. DHA increase combined to ARA decrease from January to March may reflect ongoing maturation processes, while differential accumulation of EPA (along with C16 PUFA) in muscle reserves highlights species-specific feeding strategies. For the two species, the changes in LC-PUFA profiles in female gonads were not related to the GSI, which remained stable between the two sampling periods. This highlighted that the dynamics of gonadal biochemical composition and their morphological growth (i.e. their GSI) may be decoupled. However, we observed some sex and species-specific patterns that seemed at least partly related to the specific distribution area of the two species. Further studies, with regular samplings over the year to cover the complete reproductive status of fish, are required to better understand the relationship between LC-PUFA dietary environment and physiological status of sardinellas.
Acknowledgment
Authors thank the staff of the LIPIDOCEAN platform for their help in fatty acid analyses and the Art Sunu Gueej plateform for access to their facilities (ISRA-IRD) in Bel-Air, Dakar, Sénégal. The authors thank the anonymous reviewers and the editors of Aquatic Living Resources for their valuable and constructive comments, which significantly improved the quality of this manuscript.
Funding
OMEGA project funded by ISblue, Interdisciplinary graduate school for the blue planet (ANR-17-EURE-0015). M.C.B. was funded by the Laboratory of Marine Environmental Sciences (LEMAR, Plouzané, France).
Data availability statement
The data of the study are openly available in DataSuds repository at https://doi.org/10.23708/9U26H6. Data reuse is granted under CC-BY license.
Author contribution statement
Conceptualization: MV, LP, PS, FS; Funding acquisition: MV and LP; Supervision: MMR, FLG, FS, MV; Sampling: LP, PS, KD, OS, FD; Data analysis: MCB, FS, MMR, MV; Writing-Original draft: MV; Writing-Review and Editing: MCB, FS, MMR, FLG, PS, LP, KD, OS, FD.
Supplementary Material
Table S1: Statistical results of the linear model testing the effect of species, sex, and month on the Le Cren condition index. The best model was selected with the AIC as being lme(Le.Cren.index∼Species+Sex+Sampling_Months, random = ∼1|Fish_., data=data). Significant effects are indicated in bold.
Table S2: Statistical results of the linear model testing the effect of species, sex, month on the gonado-somatic index. The best model was selected with the AIC as being lme(GSI∼Species*Sex*Sampling_Months, random = ∼1|Fish_., data = data, na.action=na.omit).
Table S3: Statistical results of the linear model testing the effect of species, sex, month on the neutral/polar lipids ratio. The best model was selected with the AIC as being lme(ratio∼Species*Sex*Sampling_Months*Tissue, random = ∼1|Fish_., data = data, na.action=na.omit).
Table S4: PERMANOVA (Euclidian method performed on centered log data) complete results for comparison in fatty acid percentages among tissues (gonad and muscle), species (S. aurita and S. maderensis), sexes, lipid fraction (polar and neutral), sampling month (January and March) and their interactions.
Table S5: Statistical results of the linear model testing the effect of tissues (gonad and muscle), species, sexes, lipid fraction (polar and neutral), sampling month (January and March) and their interactions on DHA, ARA, and EPA fatty acid concentrations. Lme (Fatty acid∼Species*Sex*Month*Fraction*Tissue, random = ∼1|Individual, data=data). Significant effects are indicated in bold.
Figure S1: Total Length-Weight relationship of Sardinellas. (A) the Sardinella aurita and Sardinella maderensis individuals sampled in this study in January (Jan) and March (Mar); (B) the S. aurita individuals sampled in this study compared to the relationship found by Baldé et al. (2019) for the same species, (C) the S. maderensis individuals sampled in this study compared to the relationship found by Ba et al. (2016) for the same species.
Access Supplementary MaterialReferences
- Anderson MJ. 2001. A new method for non-parametric multivariate analysis of variance. Austral Ecol 26: 32–46. [Google Scholar]
- Arístegui J, Barton ED, Álvarez-Salgado XA, Santos AMP, Figueiras FG, Kifani S, Hernández-León S, Mason E, Machú E, Demarcq H. 2009. Sub-regional ecosystem variability in the canary current upwelling. Prog Oceanogr 83: 33–48. [Google Scholar]
- Arts MT, Ackman RG, Holub BJ. 2001. “Essential fatty acids” in aquatic ecosystems: a crucial link between diet and human health and evolution. Can J Fish Aquat Sci 58: 122–137. [Google Scholar]
- Ba K, Thiaw M, Lazar N, Sarr A, Brochier T, Ndiaye I, Faye A, Sadio O, Panfili J, Thiaw OT, Brehmer P. 2016. Resilience of key biological parameters of the senegalese flat sardinella to overfishing and climate change. PLoS ONE 11: e0156143. [Google Scholar]
- Baldé BS, Sow FN, Ba K, Ekau W, Brehmer P, Kantoussan J, Fall M, Diouf M. 2019. Variability of key biological parameters of round sardinella Sardinella aurita and the effects of environmental changes. J Fish Biol 94: 391–401. [Google Scholar]
- Bandara T, Brugel S, Andersson A, Lau DCP. 2023. Retention of essential fatty acids in fish differs by species, habitat use and nutritional quality of prey. Ecol Evol 13: e10158. [Google Scholar]
- Bertrand M, Brosset P, Soudant P, Lebigre C. 2022. Spatial and ontogenetic variations in sardine feeding conditions in the Bay of Biscay through fatty acid composition. Mar Environ Res 173: 105514. [Google Scholar]
- Bode A, Alvarez-Ossorio MT, Cabanas JM, Miranda A, Varela M. 2009. Recent trends in plankton and upwelling intensity off Galicia (NW Spain). Prog Oceanogr 83: 342–350. [Google Scholar]
- Braham C-B, Ahmed-Jeyid M, Bensbai J, Ngoum F, Corten A, Gascoigne J. 2024. Overexploitation of round sardinella may lead to the collapse of flat sardinella: what lessons can be drawn for shared stocks. Fish Res 269: 106873. [Google Scholar]
- Braham C-B, Corten A. Pelagic fish stocks and their response to fisheries and environmental variation in the canary current large marine ecosystem, in: L. Valdés, I. Déniz-González (Eds.), Oceanographic and Biological Features in the Canary Current Large Marine Ecosystem, IOC-UNESCO, Paris., IOC Technical Series, 2015, pp. 197–213. [Google Scholar]
- Brochier T, Auger P-A, Pecquerie L, Machu E, Capet X, Thiaw M, Mbaye BC, Braham C-B, Ettahiri O, Charouki N, Sène ON, Werner F, Brehmer P. 2018. Complex small pelagic fish population patterns arising from individual behavioral responses to their environment. Prog Oceanogr 164: 12–27. [Google Scholar]
- Brochier T, Echevin V, Tam J, Chaigneau A, Goubanova K, Bertrand A. 2013. Climate change scenarios experiments predict a future reduction in small pelagic fish recruitment in the Humboldt Current system. Glob Change Biol 19: 1841–1853. [Google Scholar]
- Cañavate JP. 2019. Advancing assessment of marine phytoplankton community structure and nutritional value from fatty acid profiles of cultured microalgae. Rev Aquac 11: 527–549. [Google Scholar]
- Colombo SM, Rodgers TFM, Diamond ML, Bazinet RP, Arts MT. 2020. Projected declines in global DHA availability for human consumption as a result of global warming. Ambio 49: 865–880. [CrossRef] [PubMed] [Google Scholar]
- Couturier LIE, Michel LN, Amaro T, Budge SM, da Costa E, De Troch M, Di Dato V, Fink P, Giraldo C, Le Grand F, Loaiza I, Mathieu-Resuge M, Nichols PD, Parrish CC, Sardenne F, Vagner M, Pernet F, Soudant P. 2020. State of art and best practices for fatty acid analysis in aquatic sciences. ICES J Mar Sci fsaa121. [Google Scholar]
- Crawford MA, Broadhurst CL. 2012. The role of docosahexaenoic and the marine food web as determinants of evolution and hominid brain development: the challenge for human sustainability. Nutr Health 21: 17–39. [Google Scholar]
- Cury P, Fontana A. 1988. Compétition et stratégies démographiques comparées de deux espèces de sardinelles (Sardinella aurita et Sardinella maderensis) des côtes ouest-africaines. Aquat Living Resour 1: 165–180. [CrossRef] [EDP Sciences] [Google Scholar]
- Deme EHB, Deme M, Failler P. 2022. Small pelagic fish in Senegal: a multi-usage resource. Marine Policy 141: 105083. [CrossRef] [Google Scholar]
- Diogoul N, Brehmer P, Demarcq H, El Ayoubi S, Thiam A, Sarre A, Mouget A, Perrot Y. 2021. On the robustness of an eastern boundary upwelling ecosystem exposed to multiple stressors. Sci Rep 11: 1908. [Google Scholar]
- Failler P. 2014. Climate variability and food security in Africa: the case of small pelagic fish in West Africa. J Fisheries Livest Prod 02. [Google Scholar]
- Failler P. 2020. Fisheries of the canary current large marine ecosystem: from capture to trade with a consideration of migratory fisheries. Environ Dev 36: 100573. [Google Scholar]
- FAO. Report of the FAO Working Group on the Assessment of Small Pelagic Fish Off Northwest Africa: Casablanca, Morocco, 24 - 28 May 2011, FAO fisheries and aquaculture report. Food and Agriculture Organization of the United Nations, Rome, 2013. [Google Scholar]
- FAO. Report of the FAO Working Group on the Assessment of Small Pelagic Fish off Northwest Africa. Gambia, Banjul, 2019, 26 June-1 July 2018. [Google Scholar]
- Figueroa Villalobos E, Pereira WA, Pérez-Atehortúa M, Sandoval-Vargas L, Romero J, Oliveira RPS, Valdebenito I, Villasante A. 2025. Influence of dietary fatty acids on fish sperm tolerance to cryopreservation. Rev Aquac 17: e12968. [Google Scholar]
- Fréon P, Barange M, Arístegui J. 2009. Eastern boundary upwelling ecosystems: integrative and comparative approaches. Prog Oceanogr 83: 1–14. [Google Scholar]
- Garrido S, Rosa R, Ben-Hamadou R, Cunha ME, Chícharo MA, van der Lingen CD. 2007. Effect of maternal fat reserves on the fatty acid composition of sardine (Sardina pilchardus) oocytes. Comp Biochem Physiol Part B: Biochem Mol Biol 148: 398–409. [Google Scholar]
- Gladyshev MI, Arts MT, Sushchik NN. Preliminary estimates of the export of omega-3 highly unsaturated fatty acids (EPA + DHA) from aquatic to terrestrial ecosystems, in: M.T. Arts, M.T. Brett, M.J. Kainz (Eds.), Lipids in Aquatic Ecosystems, Springer, New York, 2009, pp. 179–211. [Google Scholar]
- Gladyshev MI, Sushchik NN, Makhutova ON. 2013. Production of EPA and DHA in aquatic ecosystems and their transfer to the land. Prostaglandins & Other Lipid Mediators, 4th European Workshop on Lipid Mediators 107: 117–126. [Google Scholar]
- Hixson SM, Arts MT. 2016. Climate warming is predicted to reduce omega-3, long-chain, polyunsaturated fatty acid production in phytoplankton. Glob Change Biol 22: 2744–2755. [Google Scholar]
- Holm HC, Fredricks HF, Bent SM, Lowenstein DP, Ossolinski JE, Becker KW, Johnson WM, Schrage K, Van Mooy BAS. 2022. Global ocean lipidomes show a universal relationship between temperature and lipid unsaturation. Science 376: 1487–1491. [CrossRef] [PubMed] [Google Scholar]
- Kang JX. 2011. Omega-3: A link between global climate change and human health. Biotechnol Adv 29: 388–390. [CrossRef] [PubMed] [Google Scholar]
- Le Cren ED. 1951. The length-weight relationship and seasonal cycle in gonad weight and condition in the perch (Perca fluviatilis). J Anim Ecol 20: 201. [CrossRef] [Google Scholar]
- Le Grand F, Soudant P, Siah A, Tremblay R, Marty Y, Kraffe E. 2014. Disseminated neoplasia in the soft-shell clam Mya arenaria: membrane lipid composition and functional parameters of circulating cells. Lipids 49: 807–818. [Google Scholar]
- Li Y, Zhang R, Liu C, He M, Wang H, Hu W, Sun Y. 2024. Endogenous biosynthesis of docosahexaenoic acid (DHA) regulates fish oocyte maturation by promoting pregnenolone production. Zool Res 45: 176–188. [Google Scholar]
- Liu J, Ma Q, Zhang F, Gao Q, Zhang Z, Wei Y, Liang M, Xu H. 2025. Dietary DHA regulated the androgen production in Male Chinese Tongue Sole Cynoglossus semilaevis. Aquac Nutr 2025. [Google Scholar]
- Luo L, Ai L, Li T, Xue M, Wang J, Li W, XiufengWu, Liang X. 2015. The impact of dietary DHA/EPA ratio on spawning performance, egg and offspring quality in Siberian sturgeon (Acipenser baeri). Aquaculture 437: 140–145. [CrossRef] [Google Scholar]
- Monroig O, Tocher DR, Castro LFC. Polyunsaturated fatty acid biosynthesis and metabolism in fish, in: Polyunsaturated Fatty Acid Metabolism, 2018, pp. 31–60. [Google Scholar]
- Neven CJ, Soudant P, Marchal P, Lefebvre S, Lefebvre A, Wacquet G, Quere C, Pernet F, Giraldo C. 2025. Factors influencing spatial variability in the trophic transfer of essential nutrients from plankton to European sardine (Sardina pilchardus). ICES J Mar Sci 82: fsaf012. [Google Scholar]
- Peck MA, Alheit J, Bertrand A, Catalán IA, Garrido S, Moyano M, Rykaczewski RR, Takasuka A, Van Der Lingen CD. 2021. Small pelagic fish in the new millennium: a bottom-up view of global research effort. Prog Oceanogr 191: 102494. [Google Scholar]
- Quiatuhanga D, Morais P, Teodósio M. 2025. Trophic interactions of two sympatric small pelagic fishes off the southern coast of Angola. Afr J Mar Sci 47: 169–180. [Google Scholar]
- R Core Team. A Language and Environment for Statistical Computing. R Foundation for Statistical Computing, Vienna, Austria, 2024. URL. http://www.Rproject.org. [Google Scholar]
- Rahi Roy D, Roy K, Panserat S, Stejskal V, Mraz J, Turchini GM. 2024. Long chain polyunsaturated fatty acid (LC-PUFA) composition of fish sperm: nexus of dietary, evolutionary, and biomechanical drivers. Prog Lipid Res 96: 101305. [Google Scholar]
- Remize M, Planchon F, Garnier M, Loh AN, Le Grand F, Bideau A, Lambert C, Corvaisier R, Volety A, Soudant P. 2021. A 13CO2 enrichment experiment to study the synthesis pathways of polyunsaturated fatty acids of the haptophyte Tisochrysis lutea. Marine Drugs 20: 22. [Google Scholar]
- Sambe B, Tandstad M, Caramelo AM, Brown BE. 2016. Variations in productivity of the canary current large marine ecosystem and their effects on small pelagic fish stocks. Environ Dev 17: 105–117. [Google Scholar]
- Sardenne F, Millot R, Bessis E, Puccinelli E, Bideau A, Le Grand F, Durieux ED, Soudant P. 2022. Changes in lipid and fatty acid contents of gonad during the reproductive cycle of the Mediterranean swordfish Xiphias gladius. Mar Environ Res 179: 105668. [Google Scholar]
- Sharma R, Barange M, Agostini V, Barros P, Gutierrez NL, Vasconcellos M, Fernandez Reguera D, Tiffay C, Levontin P. Review of the State of World Marine Fishery Resources–2025, FAO, 2025. [Google Scholar]
- Siriwardhana N, Kalupahana NS, Moustaid-Moussa N. Health benefits of n-3 polyunsaturated fatty acids, in: Advances in Food and Nutrition Research, Elsevier, 2012, pp. 211–222. [Google Scholar]
- Taipale SJ, Vuorio K, Strandberg U, Kahilainen KK, Järvinen M, Hiltunen M, Peltomaa E, Kankaala P. 2016. Lake eutrophication and brownification downgrade availability and transfer of essential fatty acids for human consumption. Environ Int 96: 156–166. [Google Scholar]
- Thiruvasagam T, Chidambaram P, Ranjan A, Komuhi N.B. 2024. Significance of fatty acids in fish broodstock nutrition. Anim Reprod Sci 268: 107573. [Google Scholar]
- Tocher D. 2003. Metabolism and functions of lipids and fatty acids in teleost fish. Rev Fish Sci 11: 107–184. [CrossRef] [Google Scholar]
- Tocher DR. 2010. Fatty acid requirements in ontogeny of marine and freshwater fish. Aquac Res 41: 717–732. [Google Scholar]
- Tocher DR. 2015. Omega-3 long-chain polyunsaturated fatty acids and aquaculture in perspective. Aquaculture 449: 94–107. [CrossRef] [Google Scholar]
- Xu H, Cao L, Zhang Y, Johnson R.B, Wei Y, Zheng K, Liang M. 2017. Dietary arachidonic acid differentially regulates the gonadal steroidogenesis in the marine teleost, tongue sole ( Cynoglossus semilaevis ), depending on fish gender and maturation stage. Aquaculture 468: 378–385 [Google Scholar]
- Xu H, Meng X, Wei Y, Ma Q, Liang M, Turchini GM. 2022. Arachidonic acid matters. Rev Aquac raq.12679. [Google Scholar]
Cite this article as: Vagner M, Cire Bah M, Le Grand F, Mathieu-Resuge M, Diop K, Sadio O, Diedhiou F, Soudant P, Pecquerie L, Sardenne F. 2026. Fatty acid allocation between muscle and gonads of Senegalese sardinellas under upwelling influence. Aquat. Living Resour. 39: 18. https://doi.org/10.1051/alr/2026014
All Tables
Summary of the distribution in numbers (n) between species, months and sex of the sampled fish. SL = standard length (cm); TL = total length (cm); W = weight (g).
Environmental characterization of the continental shelf of the Petite Côte, i.e. south of the Dakar peninsula at the two sampling periods. Average (minimum–maximum) daily values on the surface over an area of 20,000 km2 for the ten days preceding the fish sampling (Source: Copernicus; numerical models from Mercator-Ocean).
Statistical results (degree of freedom, F, and p-value) of a linear model testing the effect of gonado-somatic index (GSI) and species and the interaction of the two factors on the LC-PUFA (DHA, ARA, EPA) concentration in polar lipids and in neutral lipids in the ovaries of sardinellas. DHA: docosahexaenoic acid; EPA: eicosapentaenoic acid; ARA: arachidonic acid.
All Figures
|
Fig. 1 Le Cren condition index (A) and gonado somatic index (GSI, B) for males and females sardinella (Sardinella aurita and Sardinella maderensis) sampled at two periods (January, March) of the upwelling season at Thiaroye harbor (Senegal). For Le Cren, linear model shows an effect of species (p < 0.01) and of sampling month (p < 0.001; see Tab. S1 for statistical details). For GSI, linear mixed model shows an interactive effect between sex and sampling month (p < 0.05; See Tab. S2 for statistical details). |
| In the text | |
|
Fig. 2 Ratio Neutral lipid/Polar lipids (proxy for energy storage) for males and females sardinella (Sardinella aurita ; Sardinella maderensis) sampled at two periods (January, March) of the upwelling season at Thiaroye harbor (Senegal). Linear mixed model shows an interactive effect between species and tissue, as well as an effect of month and sex (See Tab. S3 for statistical details). |
| In the text | |
|
Fig. 3 Principal Component Analysis (PCA) biplot based on fatty acid profiles (in % of NL-FA or PL-FA). Each dot represents an individual, positioned according to its coordinates on the first two principal components. Colors display the lipid fractions (NL = neutral lipids in yellow, PL = polar lipid in blue), shapes display the species (circle = Sardinella aurita; square = Sardinella maderensis), and size display the tissue type (smaller points = Gonad; larger points = Muscle). Arrows represent the most contributive variable fatty acids to the PCA axes (cos2 > 0.35), with their orientation and length indicating their direction and strength of contribution to each dimension. |
| In the text | |
|
Fig. 4 Principal Component Analysis (PCA) biplot based on fatty acid profiles of (A) muscle reserve (in % of NL) and (B) gonad reserve (in % of NL). Each dot represents an individual, positioned according to its coordinates on the first two principal components. Shapes display the sampling month (circle = January; square = March), point sizes display the sex (large points: females; small points = males) and colors display the species (Sardinella aurita in blue, Sardinella maderensis in yellow). Arrows represent the fatty acids, with their orientation and length indicating their direction and strength of contribution to each dimension. |
| In the text | |
|
Fig. 5 DHA (docosahexaenoic acid; 22:6n-3) concentration (μg mg−1 DW) in neutral (NL) and polar (PL) lipids of gonad and muscle tissues of males (M) and females (F) Sardinella aurita (SAA) and Sardinella maderensis (SAE) at two contrasting periods of the upwelling season (January: Jan; March: Mar). See the text and Table S5 for statistical results. |
| In the text | |
|
Fig. 6 EPA (eicosapentaenoic acid 20:5n-3) concentration (μg mg−1 DW) in neutral (NL) and polar (PL) lipids of gonad and muscle tissues of males (M) and females (F) Sardinella aurita (SAA) and Sardinella maderensis (SAE) at two contrasting periods of the upwelling season (January: Jan; March: Mar). See the text and Table S5 for statistical results. |
| In the text | |
|
Fig. 7 ARA (arachidonic acid; 20:4n-6) concentration (μg mg−1 DW) in neutral (NL) and polar (PL) lipids of gonad and muscle tissues of males (M) and females (F) Sardinella aurita (SAA) and Sardinella maderensis (SAE) at two contrasting periods of the upwelling season (January: Jan; March: Mar). See the text and Table S5 for statistical results. |
| In the text | |
Current usage metrics show cumulative count of Article Views (full-text article views including HTML views, PDF and ePub downloads, according to the available data) and Abstracts Views on Vision4Press platform.
Data correspond to usage on the plateform after 2015. The current usage metrics is available 48-96 hours after online publication and is updated daily on week days.
Initial download of the metrics may take a while.