


Fig. 4
Download original image
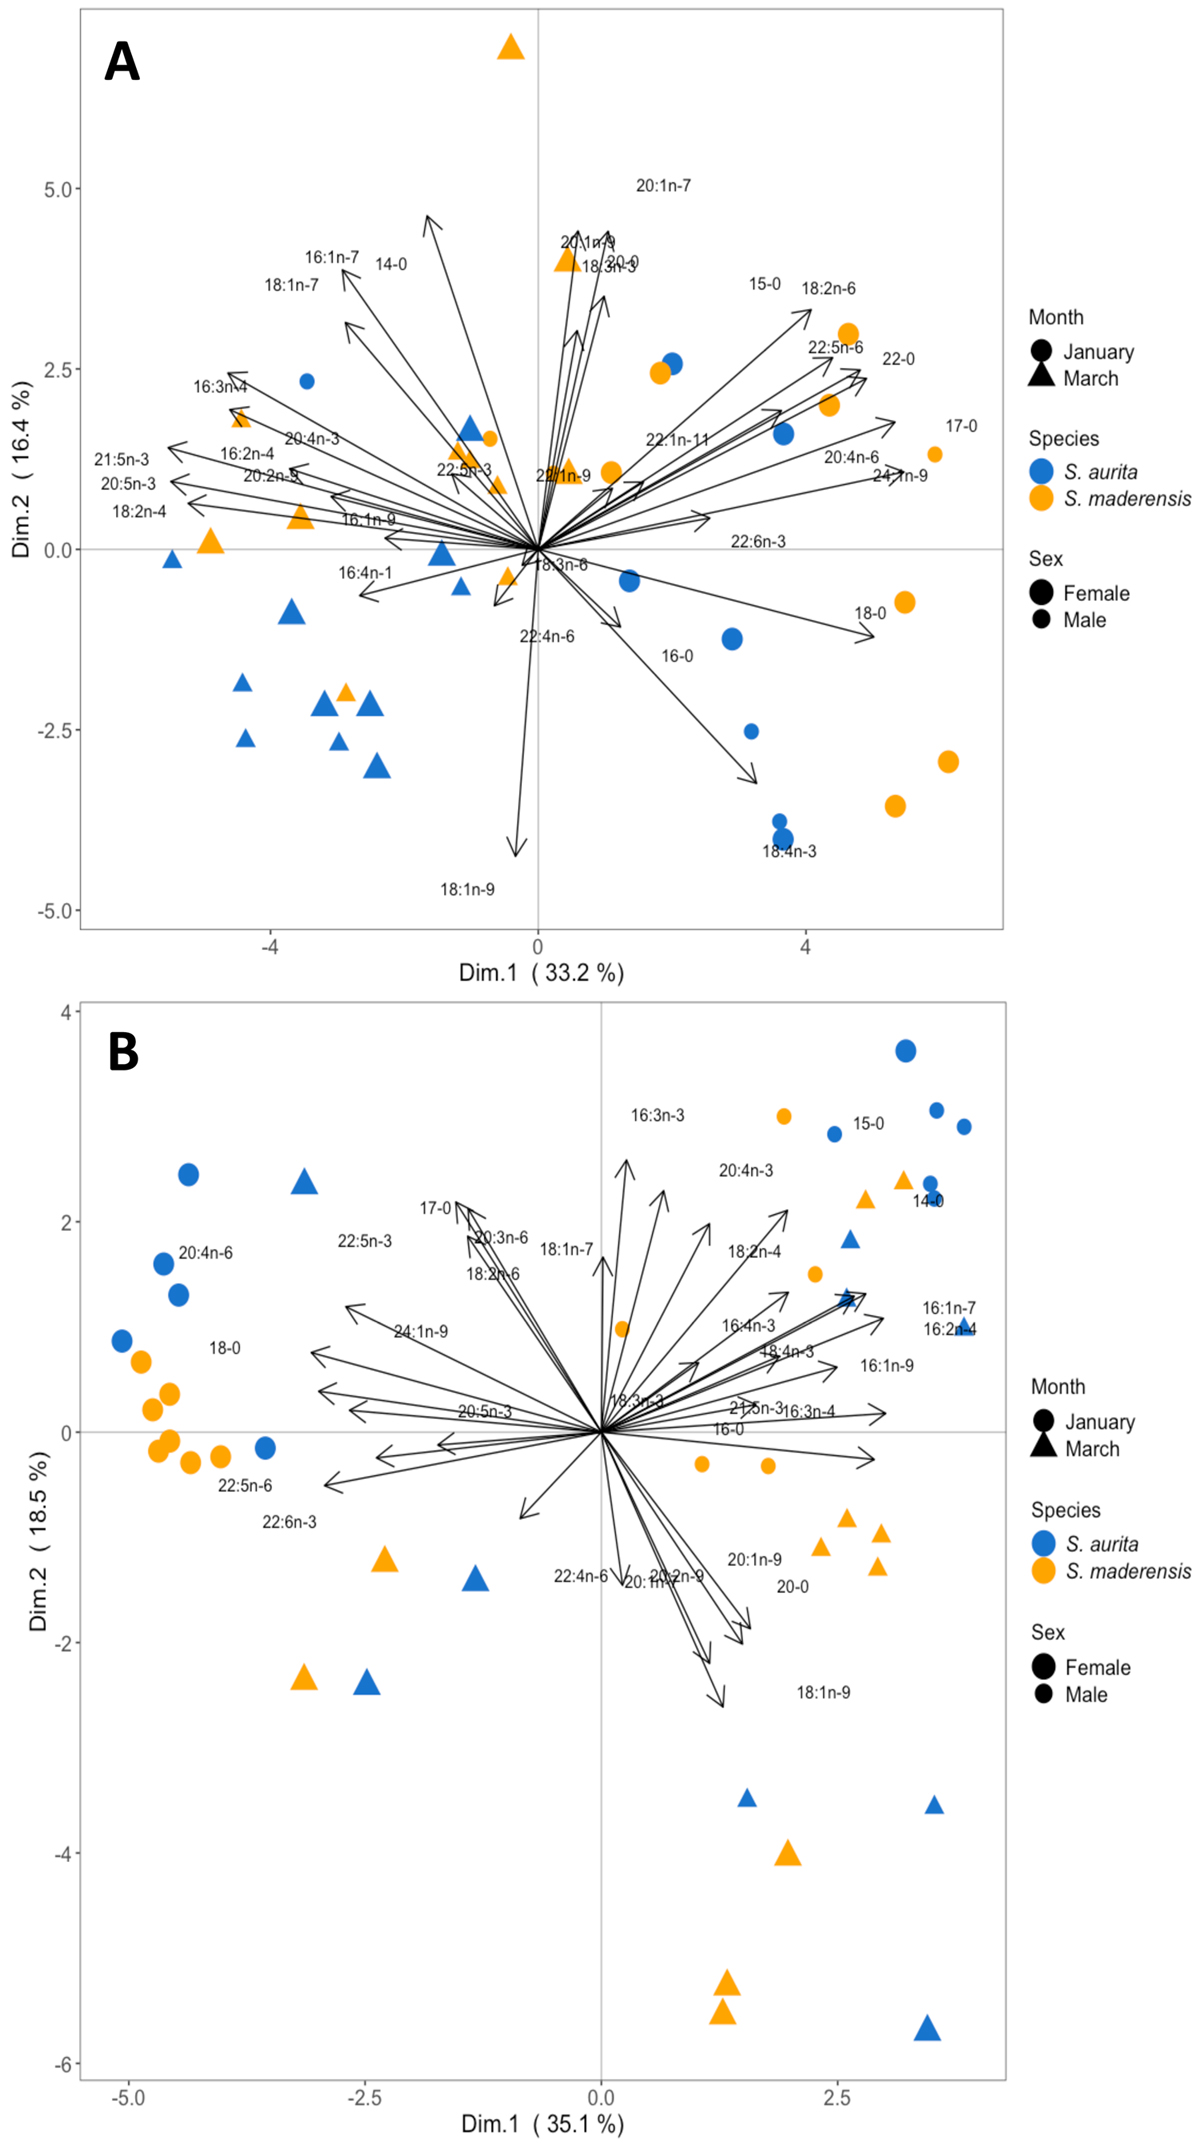
Principal Component Analysis (PCA) biplot based on fatty acid profiles of (A) muscle reserve (in % of NL) and (B) gonad reserve (in % of NL). Each dot represents an individual, positioned according to its coordinates on the first two principal components. Shapes display the sampling month (circle = January; square = March), point sizes display the sex (large points: females; small points = males) and colors display the species (Sardinella aurita in blue, Sardinella maderensis in yellow). Arrows represent the fatty acids, with their orientation and length indicating their direction and strength of contribution to each dimension.
Current usage metrics show cumulative count of Article Views (full-text article views including HTML views, PDF and ePub downloads, according to the available data) and Abstracts Views on Vision4Press platform.
Data correspond to usage on the plateform after 2015. The current usage metrics is available 48-96 hours after online publication and is updated daily on week days.
Initial download of the metrics may take a while.