| Issue |
Aquat. Living Resour.
Volume 33, 2020
Special Issue - Ecological intensification: A new paragon for sustainable aquaculture
|
|
|---|---|---|
| Article Number | 19 | |
| Number of page(s) | 13 | |
| DOI | https://doi.org/10.1051/alr/2020023 | |
| Published online | 04 December 2020 | |
Research Article
Co-culture of Ulva sp. and Dicentrarchus labrax in Recirculating Aquaculture System: effects on growth, retention of nutrients and fatty acid profile
Laboratory of Applied Hydrobiology, Faculty of Animal Science and Aquaculture, Agricultural University of Athens, 75 Iera Odos, Athens
11855, Greece
* Corresponding author: This email address is being protected from spambots. You need JavaScript enabled to view it.
Handling Editor: Jacques Slembrouck
Received:
29
May
2020
Accepted:
11
November
2020
Abstract
European sea bass and Ulva sp. were co-cultured in different tanks of an indoor Recirculating Aquaculture System (Ulva-RAS) with bacterial biofilter, in an effort to optimize the efficiency of the system and to further decrease the waste effluent. A system with similar culture conditions, without Ulva, was used as a control-RAS to elucidate integration effects on growth performance and chemical composition of sea bass. The role of Ulva on N and P concentrations, gas (O2, CO2) and pH in water was also investigated. Fish were fed a diet of fish oil replacement (55%) with a mixture of rapeseed oil and palm oil (1:1). Our data showed that Ulva could uptake N and P nutrients, but could also enrich sea water with phosphates. Sea bass reared in Ulva-RAS exhibited isometric growth, while fish in control-RAS showed a positive allometric growth and an increased variance of body weight and length. In addition, sea bass in Ulva-RAS demonstrated significantly higher levels of condition factor (K), feed intake, protein, lipid, P, EPA and DHA content (% wet weight of total body) and lipid productive value, compared to fish in control-RAS. Ulva, after bi-weekly culture, showed increased protein content (60%) compared to wild seaweed collected nearshore. Cultivated Ulva obtained dark green color, doubled chlorophyll concentrations, and exhibited lower levels of saturated and higher levels of certain monounsaturated and n-3 polyunsaturated fatty acids, indicating increased photosynthetic activity. Present results revealed the beneficial effects of Ulva on sea bass growth and quality, which led to an improved response to the nutritional stress imposed by the fish oil replacement with vegetable oils, thus contributing to a sustainable aquaculture. Moreover, it was concluded that Ulva could improve water quality by increasing pH and O2, reducing CO2 and contribute to bioremediation of ammonia and nitrates from water in integrated aquaculture.
Key words: RAS / IMTA / Ulva / sea bass / fatty acid profile / proximate composition / nutrients
© EDP Sciences 2020
1 Introduction
Integrated aquaculture should be looked upon as a very important tool to facilitate the growth of marine aquaculture and the reduction of environmental impacts associated to monoculture (FAO, 2009). Due to the great intensification of fish farming, the amount of residue deposited into the rearing tanks has increased significantly. Nitrogen (N) and phosphorus (P) are the main mineral end-products of fish loading and can affect not only the rearing water, but also the downstream ecosystems (Lazzari and Baldisserotto, 2008). Fish expel various nitrogenous waste products through gill diffusion, gill cation exchange, urine, and feces as ammonia, nitrite and to some extent nitrate (Schneider et al., 2005). In the biological filter of a RAS (Recirculating Aquaculture System), a successive oxidation of ammonia to nitrite and finally to nitrate occurs (Martins et al., 2010). This nitrification process is achieved by nitrifying bacteria, which are primarily obligate autotrophs and aerobes, whereas denitrification, is an anaerobic process where nitrate is converted to nitrogen gas (Schneider et al., 2005; Martins et al., 2010). Fish may also release P mainly through urinary excretion of inorganic P, when fed diets containing a total P level that surpasses the minimum requirements needed to obtain optimum growth (Sugiura et al., 2000). Thus, nitrate and phosphate could accumulate over time in RAS and may harm fish growth, health and feed intake. For the mitigation of the environmental impacts of aquaculture, two main practical approaches are emerging: bacterial dissimilation in gases and plant assimilation into biomass (Neori et al., 2004).
In seaweed-based integrated mariculture systems, ammonia and the other excess nutrients from the fed finfish/shrimp culture are taken up by macroalgae (Chopin et al., 2001). Recent studies on Integrated Multi-Trophic Aquaculture (IMTA) showed that seaweed filtration has the potential to improve not only the efficiency of recirculating aquaculture but also the productivity by converting nutrient-rich effluents into valuable biomass (Granada et al., 2016). Troell et al. (2003) reviewed 28 studies on marine integrated aquaculture systems that included seaweeds as extractive organisms, and commented that most of them did not examine the effects on the quality of the main cultured species and lacked a “control” treatment. Particularly, for open-water aquaculture regions, it may be extremely difficult to find “control” sites presenting comparable hydrodynamic, chemical, physical and biological conditions. In earthen ponds IMTA, there are interactions between the different organisms, as autotrophs, filter-feeding species and fed organisms are grown together (Favot et al., 2019). On the other hand, cultivation of integrated organisms in different tanks of closed recirculating systems facilitates the investigation of the “true” seaweed effect.
Ulva presents a high ability to uptake dissolved nitrogen, especially ammonia, improving water quality and has long been integrated into land-based IMTA for biomass production and bioremediation (Carl et al., 2014). To achieve high nutrient reduction efficiency, a seaweed culture should be “starved”-supplied with a low areal load of nutrients, a situation that supports low seaweed areal yields with low protein content (Buschmann et al., 1994). It is not possible to achieve this in one-stage seaweed biofilters that are high in both ammonia uptake rates and ammonia reduction efficiency (Cohen and Neori, 1991; Neori et al., 2004). In RAS, bacterial biofilter decreases nutrient load with possible implications in the growth and quality of seaweeds. Thus, RAS should be manipulated to some extent, in order ammonia to reach the acceptable levels for fed organisms and to improve seaweed yield and protein content (Troel, 2003). Light limitation in indoor RAS could also be a restrictive factor for Ulva growth, but protein and chlorophyll content could be increased at low light conditions, ameliorating Ulva quality (Duke et al., 1986, Sand-Jensen, 1988a,b; Neori et al., 1991).
IMTA systems have been successfully employed to improve the nutritional quality of seaweed biomass (Schuenhoff et al., 2003; Abreu et al., 2011). A good potential for profitability has been estimated for integrated sea bream − Ulva farms (Neori et al., 2004). Ulva has been successfully integrated into mid- to large-scale animal mariculture systems, showing high growth rate in through-flow land-based systems (Troell et al., 2003) and it has also been proven to be an ideal candidate for growing in fish ponds (Ben-Ari et al., 2014), showing however a certain seasonality in biomass yield (Favot et al., 2019). Ulva is usually harvested weekly, while the optimal period of Ulva cultivation was estimated to be 8 days in ponds, when it is stocked at densities that ensure no shading among the algae (Cohen and Neori, 1991; Favot et al., 2019). However, in closed recirculating systems with a relatively low load of nutrients a longer cultivation period may be needed, offering to Ulva the opportunity to act as biofilter and to improve its quality and areal yield.
The impacts of bioremediation of fed aquaculture associated to monoculture through integrated mariculture is a core benefit, but the increase of production and the contribution to the global increase of seafood demand and the shortage of fishmeal and fish oil stocks can be considered as additional advantages (FAO, 2009). Seaweeds are considered a source of biologically active substances for human or animal nutrition, as well as a raw material for the application of nutraceuticals and the production of bioactive compounds like the sulphated polysaccharide (ulvan) (Jiménez-Escrig et al., 2011). They are important for aquaculture as aquafeed additives, since they are rich in proteins, lipids, pigments, vitamins and minerals. They also provide bioactive compounds with immunity stimulating capacity and anti-oxidant response, contributing to fish well-being (Holdt and Kraan, 2011). Nevertheless, the current solution to address the shortage of fishmeal and fish oil stocks in the aquafeed industry is the production of plant-based feeds, which were shown to exert negative effects on fish growth and physiology (Mourente and Bell, 2006; Turchini et al., 2009). However, the effect of seaweed integration on growth and quality of the fish fed plant-based alternative diets has scarcely been studied.
In this study, European sea bass (Dicentrarchus labrax), an important commercial fish species in the Mediterranean Sea, was co-cultured with Ulva sp. in different compartments of an indoor RAS with a bacterial biofilter. A similar system with sea bass monoculture was maintained as a control treatment. The goal was to assess Ulva quality after a bi-weekly culture, as well as the effects of Ulva presence, on growth performance and quality of sea bass fed a novel alternative diet containing vegetable oils (VO) without Ulva as a feed additive. Moreover, the aim of this study was to estimate the effects of Ulva on water quality and nutrient reduction efficiency of both Ulva and bacterial biofilters.
2 Materials and methods
2.1 Production systems and management
The integrated culture of European sea bass and Ulva sp. was performed at the Laboratory of Applied Hydrobiology of the Agricultural University of Athens. Two indoor RAS were used: the first (Ulva-RAS) for the co-culture of seaweed Ulva and sea bass and the second (control-RAS) as a control for rearing sea bass without seaweed. In each unit, six separate tanks (147 L each) were divided in two levels: the upper one with 3 tanks containing sea water with Ulva (UW) or without seaweed as control (CW), and the lower one with 3 tanks for sea bass rearing (UF in Ulva-RAS and CF in control-RAS). Seawater was pumped into each of the 3 tanks of the upper level, and then it flowed from each tank to the lower level through standpipes into the respective tanks with the fish (Fig. 1). In each RAS, the effluent from this level was filtered by (a) a mechanical filter and (b) a gravel bed (bacterial biofilter) of 483.84 L and then recirculated to the upper level tanks. Each tank was continuously supplied with air, and oxygen flow regulators were used in order to keep oxygen supply similar to all tanks. Every Friday, all tanks were cleaned and water was renewed by half.
Photoperiod was set at 12 h light and 12 h dark. Illumination for both RAS was provided by ceiling-mounted cool white fluorescent lamps in a uniform manner and was measured with a RS PRO Light Meter 50000lx at 6.07 µmol m−2 s−1on the surface of the upper tanks. The water flow rate was set at 90 L h−1, that is, the water renewal rate was 0.6 times per hour. Oxygen, temperature, salinity and pH levels were measured in all tanks daily, at 8:30 am, before first feeding, 5 days a week, with portable devices (Hach HQ30D Oxymeter, Shenzen Handsome Technology Salinity refractometer, Hach HQ11d pH meter). Carbonate hardness (°d) was measured weekly with Visocolor Eco kit and Carbon dioxide (CO2) was estimated theoretically by an online tool according to Prieto and Millero (2002).
Ulva was collected from the Saronic Gulf (N 37°51′42.397″, E 23°44′47.288″), sorted and thoroughly cleaned with seawater to remove impurities and epibionts and weighted after drying before placed in RAS. Unattached thalli of Ulva were kept suspended by air diffusers situated at the bottom of the tanks. Ulva was renewed in RAS every 2 weeks and stocked with average density (±SE) 0.97 ± 0.04 kg m−2 and average biomass 340 g per tank. Cultured Ulva thalli were weighted in a similar way as the wild specimens.
For the experimental diet, a mixture of rapeseed oil and palm oil (1:1) was prepared and incorporated to a basic feed (extruded pellets with 9.5% crude lipid) by vacuum coating. The formulation of the diet (g kg−1) was: fish meal 320, wheat 120, fish oil 80, sunflower meal 110, soybean meal 160, corn gluten 40, wheat gluten 40, rapeseed oil 50, palm oil 50 and premix 30. Fish were manually fed to apparent satiation twice a day (09:00 a.m. and 14:00 p.m.), five days per week and uneaten feeds were removed within 30 min. The average daily feed intake per fish was estimated.
 |
Fig. 1 Experimental design. Ulva-RAS: co-culture of Ulva and seabass with the first in the upper tanks (UW) and the second in the lower tanks (UF). Control-RAS: upper tanks without seaweed (CW) and lower tanks for sea bass rearing (CF), GRAVEL BIOFILTER: a bed of gravel with bacterial biofilm. |
2.2 Zootechnical performances
Fish were weighed to the nearest 0.05 g and their fork (FL), standard (SL) and total length (TL) were measured to the nearest 0.1 cm. In each of the UF and CF tanks, 50 fish were allotted randomly and the initial body weight (W) did not differ among tanks. Initial fish density was 12.05 ± 0.08 kg m−3. Dead fish were removed and weighed. Body length measurements for all individuals were performed at the first day of the trials (week 0) and after 4, 8 and 12 weeks.
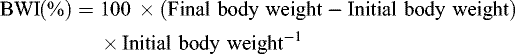
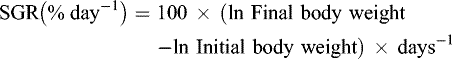
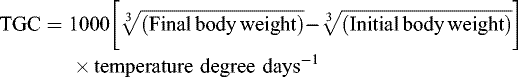
The growth performance of sea bass was estimated for the whole duration of each trial (1–12 weeks), as well as for the intermediate rearing periods between successive samplings (1–4, 5–8 and 9–12 weeks). Standard indices and formulas were used to assess growth, feed utilisation and other relevant parameters (Turchini et al., 2011):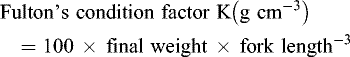

2.3 Analyses of nutrients in water
Water samples were collected from each tank every Monday (after 2 days of feed deprivation) and Thursday before first daily feeding. On each sampling date 0.5 L water samples were collected (Fig. 1) from each tank (inlet and residual), as well as from the bacterial biofilter (inlet and outlet), using plastic bottles and were immediately used for subsequent analyses. A volume of 0.4 L was filtered through glass fiber paper with 0.7 mm porosity and was used for the determination of Total Ammonia Nitrogen (TAN) by the indophenol blue method (Strickland and Parsons, 1972), Nitrate Nitrogen ( ) by Brucine method (EPA 352.1, 1971), Nitrite Nitrogen (
 ) by Griess reaction method (Strickland and Parsons, 1972) and Orthophosphate − Inorganic phosphorus (
 ) by the ascorbic acid method (EPA 365.3, 1978). Unfiltered water (0.1 L) was used for total phosphorus measurements by the ascorbic acid method (EPA 365.3, 1978). Nutrient reduction efficiency was calculated as the average reduction (%) in nutrient concentration from water samples collected, as follows: (a) for Ulva = (tank inlet-tank residual (UW)/tank inlet and (b) for bacterial biofilter =(biofilter inlet-biofilter outlet)/biofilter inlet (Fig. 1).
2.4 Chemical composition analyses
Analyses of proximate composition were performed for fish, feed and Ulva samples. If not used immediately, samples were kept in −20 °C until analysis. Fish fasted for 48 h before sampling, were collected for proximate composition analyses at the beginning and at the end of the feeding trial. From each fish tank, 20 individuals (whole body) were minced and pooled. Ulva samples were collected from wild specimens and after bi-week culture (n = 5). Ulva was air dried for 3–4 h and water was completely removed by mechanical rotation and adsorbent paper before weighting.
Moisture was determined immediately after sampling by air drying at 110 °C for 16 h until constant weight (AOAC 950.46 ). Ash content was determined by combustion in furnace (550 °C/16 h) according to AOAC 938.08 . Nitrogen content was determined by the Kjeldahl method with FOSS Digestor™ 2520 and FOSS Kjeltec 8200 distillation unit, according to AOAC Official Methods 981.10 and 2001.11 with Cu as catalyst. Crude protein was expressed as nitrogen content (%N) × 6.25. Total lipid was extracted with the Soxhtec/Submersion method including hydrolysis in a SoxCapTM 247 hydrolysis unit (Foss) and extraction of lipids in Foss Soxtec 243, according to AOAC Official method 991.36. Folch extraction was used for the determination of crude lipid content of Ulva samples as well as for lipid extraction to be used in fatty acid determination (Folch et al., 1957). Carbohydrates were calculated by subtracting from 100 the sum of moisture, ash, protein and lipid (Terpstra, 2015).
The quality and utilisation of protein and lipid from fish were estimated by the protein efficiency ratio (PER) and lipid efficiency ratio (LER), which are the ratio of weight gain to the quantity of protein or lipid fed, respectively. Protein productive value (PPV) and Lipid productive value (LPV) evaluate the protein or lipid retained in fish total body by the dietary protein or lipid fed, respectively. They are generally expressed as a percentage of the protein or lipid retained from the feed fed and are calculated by the following formulas:

Gross Energy (kJ g−1) for fish or diet was calculated as total carbohydrate (g) × 17.5 + protein (g) × 23.65 + lipid (g) × 39.6 (Terpstra, 2015).
Fatty acid composition of fish, feed and Ulva samples were determined via gas chromatography (GC) and flame ionization detector (FID). Fatty acids of lipid samples are derivatized to methyl esters with BF3 (FAMEs). Prepared methyl esters were analysed by GC instrument (Agilent 6890) equipped with fused silica column coated with bonded polyglycol liquid phase (Supelco Omegawax 320 L: 30 m, ID: 0.32 mm, DF: 0.25 µm column) according to AOAC 991.39 and AOCS Ce 1i-07 (2009) methods, TAG as internal standard and He as carrier gas (constant flow rate, 2.4 mL min−1). Temperature programming was from 170 to 225 °C at 1 °C min−1. FAME identification was performed by comparison to known standards and reference material (Supelco 37 Components FAME mix, Menhaden Fish Oil), in Chemstation (G1701DA Rev.01.02 SP1). Selected fatty acid composition (% total fatty acids) is presented in Table 8.
Phosphorus (P) levels were determined by the molybdovanadate method after ash drying: for feed (AOAC 965.17), fish (Sajjadi and Carter, 2004) and Ulva (Villares et al., 1999) samples.
Photosynthetic pigments were extracted from fresh Ulva samples in 80% acetone and their absorbance were measured at 645 and 663 nm measured (Vimala and Poonghuzhali, 2015). The content of chlorophyll α and b was calculated:
 where, A = Absorbance at respective wavelength.
2.5 Statistical analyses
Statistical analyses were performed using STATGRAPHICS (Centurion XV). Comparison of means was conducted by student's T test and by one-way ANOVA for water analyses. Data were subjected to Duncan's multiple range test when applicable and significant differences were considered at p < 0.05 after being tested for homogeneity of variance by the Levene's test. The compliance of data with normality was tested using the Kolmogorov–Smirnov test, and in the cases where the data were heteroscedastic or non-normal, a nonparametric test (Kruskal–Wallis) was performed or data were ln transformed prior to analysis. No significant differences were found among replicates of each group for somatometric measurements and chemical analyses. All data are reported as mean ± standard error (SE).
The relationship between the weight (W) and length (L) of fish was expressed by the equation W = aLb, where W: body weight (g), L: length (cm), a: coefficient related to body form and b: value providing information on fish growth. This equation was estimated for the relation of W to total (TL), standard (SL) and fork length (FL). When b = 3 in W-TL relationship, increase in weight is isometric (Froese, 2006), whereas when the value of b is other than 3, weight increase is allometric (positive allometric if b > 3, negative allometric if b < 3). Regression analysis was conducted for estimating a linear regression model to describe body weight − length relationship (after ln transformation of data) of both fish groups studied (CF and UF) and the corresponding two separate lines. Comparison of regression lines was performed for testing statistically significant differences between the slopes and/or intercepts (p < 0.05). The Durbin-Watson (DW) test was applied to determine that there is no indication of serial autocorrelation in the residuals at the 95.0% confidence level. R2 adjusted for degrees of freedom was calculated for evaluating the percentage of variability in the dependent variable that is explained by the fitting model. The null hypothesis of the isometric growth (H0: b = 3) was tested by t–test, using the statistic: t s = (b−3) Sb −1, where Sb is the standard error of the slope (Sangun et al., 2007).
3 Results
3.1 Water quality
The levels of temperature and salinity were similar among tanks in both RAS-units during the 12-week experimental period (Table 1). Significant differences (p < 0.001) were observed in pH and dissolved oxygen (O2) measured in light period, that were higher in Ulva-RAS compared to control-RAS. Specifically, for both parameters, mean values were higher in UW compared to CW tanks and in UF compared to CF tanks, as shown in Table 1. Conversely, CO2 mean values were significantly (p < 0.01) lower in Ulva-RAS compared to control-RAS, that is, lower in UW than in CW tanks and in UF than in CF tanks.
Μean values of nitrogen, measured as total ammonia (TAN), nitrite and nitrate, and of phosphorus, measured as orthophosphates and total phosphorus, are presented in Table 1. Nitrite levels were significantly (p < 0.001) higher in Ulva-RAS than in control-RAS, particularly when comparing fish group tanks. On the contrary, TAN and nitrate levels did not differ significantly between UF and CF, nor between UW and CW. As a general observation, values of nitrites and TAN were lower on Mondays compared to those obtained on Thursdays in both RAS units. On the other hand, nitrate values were kept approximately at the same level in both RAS units.
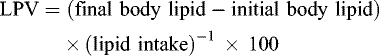
For orthophosphates and total phosphorus, no significant differences were found among tank groups, although their mean values were slightly higher in control-RAS compared to Ulva-RAS, and slightly higher in fish tanks compared to the respective water tanks, being lowest in those with Ulva culture (Table 1). However, when comparing P levels throughout the experimental period (Figs. 2 and 3),  values were significantly lower (p < 0.001) in Ulva-RAS than in control-RAS during the first month, but phosphates accumulated over time and showed significantly (p < 0.001) higher levels in Ulva-RAS compared to control-RAS during the third month.
Bacterial biofilter demonstrated a high reduction efficiency (Fig. 4) for TAN (57%) and nitrites (59%), but for orthophosphates, total phosphorus and nitrates was negligible. Ulva biofilter showed a two-fold reduction efficiency for TAN (6%) compared to that of nitrites (2.5%) and nitrates (3%).
Mean values (±SE) of temperature (°C), salinity, pH, dissolved oxygen and carbon dioxide from daily measurements during the 12-week trial, as well as mean values (mg L−1) of total ammonia, nitrite, nitrate, orthophosphates and total phosphorus for samples collected twice per week.
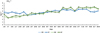 |
Fig. 2 Mean values (±SE) of orthophospates ( |

 |
Fig. 3 Mean values (±SE) of orthophosphates ( |

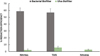 |
Fig. 4 The N-nutrients reduction efficiency was calculated for Ulva and gravel biofilter in Ulva-RAS, expressed as percentage of the difference of nutrient concentration in water. |
3.2 Growth performance and proximate composition
No significant differences were observed in body weight and length values of sea bass between UF and CF groups at all samplings throughout the rearing period as shown in Table 2. However, final condition factor (K) was significantly (p < 0.05) higher in sea bass of UF compared to CF group.
The variation in sea bass body weight values was greater in CF than in UF group at the end of the rearing period (coefficient of variation 29.01% vs 22.02%). This difference was observed from the second month of rearing (coefficient of variation 27.11% vs 22.14%). Similarly, the variation in sea bass final total length values was greater in the CF compared to UF group (coefficient of variation 8.70% vs 7.15%), as well as after the second month of farming (coefficient of variation 8.10% vs 7.28%).
Highly significant (p < 0.0001) body weight − length linear relationships were estimated from logarithmically transformed data obtained at different time periods during sea bass farming (Tab. 3). Comparison of regression lines showed significant differences between CF and UF groups for the slopes of the lines ln(W) vs ln(TL), ln(SL) or ln(FL) after 4 weeks of rearing. Differences in the intercepts (a) of the aforementioned regression lines were also detected after 8 or 12 weeks of rearing, with intercept being higher in UF than in CF group. Moreover, the slope of final weight − total length regression line for UF group (b = 3.00069, Sb = 0.06558) did not differ significantly from 3, indicating that the increase in weight was isometric. On the other hand, the slope of the respective line for CF group (b = 3.44055, Sb = 0.07222) showed a positive allometric growth (b > 3). As it is illustrated in Figure 5, most small specimens in CF group were thinner than large specimens.
As indicated in Table 4, SGR, BWI, TGC and FCR did not differ significantly between CF and UF groups. However, feed intake per fish was significantly (p < 0.001) higher in UF compared to CF group, particularly during 5th–9th week of sea bass farming, when the highest body weight increase occurred. Mortality did not differ significantly between the fish groups (CF: 4.67 ± 3.71%, UF: 4.00 ± 1.15%). Initial fish density (g L−1) was similar in the tanks of both RAS-units. The final density was more than doubled from the initial, without significant difference between the two RAS units.
Although slightly higher, PER in CF than UF and PPV in UF than CF, the differences observed were no significant between the two fish groups (Tab. 5). LER was slightly lower in UF than CF, but LPV was significantly (p < 0.05) higher in UF compared to CF group.
Proximate composition of feed and fish is summarized in Table 6 and for seaweed in Table 7. After 12 weeks of feeding sea bass with the VO-diet, significant differences were observed in proximate composition between UF and CF fish groups. Specifically, protein (p < 0.001), lipid (p < 0.001) and ash (p < 0.01) levels were significantly higher, but moisture (p < 0.05) content was significantly lower, when UF compared to CF group. N (p < 0.05) and P (p < 0.01) content in fish were significantly higher in UF than in CF group. The N/P ratio was similar in both groups, although slightly higher in CF than UF.
Analyses of proximate composition showed no significant differences between cultivated and wild Ulva for moisture, ash and lipids. However, bi-weekly cultivated Ulva showed significantly (p < 0.05) higher protein levels, but lower carbohydrate and energy content, compared to wild seaweed. The N and P content was significantly (p < 0.05) higher for bi-week cultivated Ulva compared to wild seaweed, whereas the N/P ratio was significantly (p < 0.05) higher for wild algae. Regarding pigments, cultivated Ulva showed significantly (p < 0.001) higher chlorophyll α (p < 0.05) and b content compared to the wild specimens.
The content (% total fatty acids) of individual fatty acids as well as of main group categories was calculated for feed, sea bass and Ulva (Tab. 8). Significant differences (p < 0.05) in fatty acid profile between UF and CF fish groups were observed. The levels of total monounsaturated and total n-6 polyunsaturated fatty acids were significantly higher, while the levels of total saturated, total n-3 polyunsaturated and n-3 HUFA were significantly lower, in UF compared to CF group. Total polyunsaturated and n-6 HUFA did not show significant differences. The n-3/n-6 ratio was significantly lower in UF than CF fish group. Fatty acid profile between wild and bi-weekly cultivated Ulva showed significant differences (p < 0.01) only in 16:0 content. As a result, total saturated fatty acids were significantly (p < 0.05) higher in wild than in cultivated Ulva.
The total content (g in 100 g fat) of EPA and DHA was significantly (p < 0.001) higher in CF (5.59 ± 0.07) than in UF (5.15 ± 0.08) group. However, when estimating the total content of EPA and DHA as g in terms of 100 g wet weight of total body, it was significantly (p < 0.05) higher in UF (0.76 ± 0.02) than in CF (0.70 ± 0.01) group.
Mean values (±SE) of body weight (W), total length (TL), standard length (SL), fork length (FL) and Fulton's condition factor (K) of sea bass at different time periods in CF (fish group in control-RAS) and UF (fish group in Ulva-RAS) (n = 144–150).
Coefficients (a: intercept. b: slope) of body weight (g) − length (cm) linear regression lines (after ln transformation of data) for CF (fish group in control-RAS) and UF (fish group in Ulva-RAS), adjusted R2 of the model estimated at different time periods of sea bass farming.
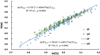 |
Fig. 5 Weight (W) − total length (TL) relationships for sea bass in control RAS (CF) and Ulva-RAS (UF) groups at the end of the experimental period. |
Growth performance of sea bass reared in RAS with (UF) or without Ulva (CF) during different time periods of the experiment (n=3).
Mean values (±SE) of PER (Protein efficiency ratio), PPV (Protein productive value), LER (Lipid efficiency ratio), and LPV (Lipid productive value) estimated in CF (fish group in control-RAS) and UF (fish group in Ulva-RAS) (n=3).
Proximate composition (% w.w.), gross energy (kJ g−1), N, P (% w.w.) and N/P of sea bass at the beginning (initial) and after 12 weeks of rearing (final) in CF (fish group in control-RAS) and UF (fish group in Ulva-RAS).
Proximate composition (% w.w.), gross energy (kJ g−1), N, P (% w.w.), N/P and chlorophyll (µg g−1) of wild and bi-weekly cultivated Ulva.
Selected fish fatty acid profile (% total identified fatty acids) of sea bass fed the VO-diet in CF (fish group in control-RAS) and UF (fish group in Ulva-RAS), as well as of wild and bi-weekly cultivated Ulva.
4 Discussion
The levels of dissolved oxygen (O2) and pH were significantly lower in fish tanks than in water tanks, being highest in those with Ulva culture, during light periods. On the other hand, the levels of carbon dioxide (CO2) were lower in Ulva-RAS than in control-RAS and did not differ significantly between fish tanks and Ulva tanks. Moreover, Ulva chlorophyll content increased significantly after a bi-weekly culture, indicating that Ulva absorbed CO2 and released O2 through photosynthesis. Thus, Ulva culture may have an important complementary role in regulating oxygen and pH in RAS. It is well known that seaweed aquaculture contributes to CO2 sequestration, pH elevation and O2 supply to the waters (Chopin et al., 2001).
As a result of higher feed intake, nitrite levels were highest in fish tanks of Ulva-RAS, but ammonia levels were similar in fish tanks of both RAS-units, which could be attributed to ammonia uptake by Ulva. It is well known that N-limited seaweeds can take up large quantities of ammonia in a short time and that in continuous cultures both N-content and N-uptake are related to ammonia flux (Cohen and Neori, 1991). Nitrogen concentration in tissues of wild Ulva (1.6% d.w.) was at low levels according to literature (Duarte, 1992;. Villares et al., 1999; Pedersen et al., 2010; Breure, 2014). In U. lactuca grown in marine fishpond effluents and stocked at 1 kg m−2, N content (% d.w.) showed hyperbolic correlation with ammonia flux through the outdoor tanks, reaching a maximum of 4.07 (% d.w.) (Cohen and Neori, 1991). In the present experiment, Ulva was stocked at a similar density, but this maximum in N content was not reached. The N-content of cultivated Ulva was found to be 2.7% d.w., indicating that it was N-limited and able to retain ammonia. Although the bacterial biofilter reduced TAN and nitrite flux, Ulva could also uptake TAN, nitrates and nitrites from the water, therefore playing a role as an additional biofilter with a significant contribution to nitrate bioremediation in RAS.
Usually in outdoor integrated sea bream (Sparus aurata) − Ulva farms there is an increase in Ulva biomass (Schuenhoff et al., 2003; Ben-Ari et al., 2014; Favot et al., 2019). Previous experiments in laboratory conditions showed that U. lactuca was able to grow at very low photon flux densities, although its growth rate increased with incident light (Sand-Jensen, 1988a). Maximum efficiencies of light utilization for Ulva growth occurred at intermediate light levels (8.8 µmol m−2 s−1), corresponding to the optimum photosynthetic performance (Sand-Jensen, 1988b). In the present study, intermediate levels (6.07 µmol m−2 s−1), were used for Ulva cultivation. Ulva thalli after 2-week cultivation obtained a dark green color and chlorophyll pigments were duplicated, which could be attributed to increased photosynthesis compared to its wild counterpart collected from the oligotrophic Saronic Gulf. Duke et al. (1986) commented that chlorophyll pigment levels in U. curvata increased at low light, while tissue N concentrations varied inversely with light and positively with N-supply. In this study, cultivated Ulva presented an increased N-content when compared to wild samples, which could be attributed to an augmentation in the concentration of key photosynthetic enzymes of the chloroplast photosynthetic membranes (Hotimchenko, 2002), following the increased N-supply in RAS than in the oligotrophic Saronic Gulf. Gómez-Pinchetti et al. (1998) observed that chlorophyll levels increased in parallel to photosynthetic rates during N-enriched recovery period of U. rigida and its growth rate was improved. However, in this study, a loss in Ulva biomass was estimated as large thalli were weighed after bi-weekly cultivation, while small suspended fragments, produced by air bubbling, remained unaccounted for. Thus, an approximately 25% loss in Ulva biomass was estimated, indicating that Ulva growth rate was not enough to compensate for drifting.
The levels of phosphorus (P) content in wild Ulva (0.09% d.w.) were among the lowest reported in the literature for Ulva (Duarte, 1992; Villares et al., 1999; Pedersen et al., 2010; Breure, 2014), as they were collected from the oligotrophic Saronic Gulf. In contrast, P-content of the cultivated Ulva (0.5% d.w.) was among the highest measurements mentioned for U. lactuca grown under controlled conditions (Pedersen et al., 2010; Breure, 2014). Pedersen et al. (2010) found that Ulva is a thin and fast-growing alga that takes up dissolved inorganic P much faster than thicker and slower growing species, but also has much higher P-demands per unit biomass and time, as well as lower storage capacity. Pedersen et al. (2010) suggested that the critical tissue P-concentration for maximum growth of U. lactuca is 65.5 μmol P g−1 dw (0.20% d.w.), while the maximum tissue P-concentration is 125 µmol P g−1 d.w. (0.39% d.w.). Present results demonstrate that P does not appear to be a limiting factor for Ulva growth in RAS, with the continuous availability of phosphorus through fish waste in RAS. The concentrations of phosphates were slightly lower in water tanks than in fish tanks, especially in those with Ulva culture, indicating that Ulva takes up inorganic P from the water and resulted in a 5-fold elevation in P-content. Lubsch and Timmermans (2018) referred that despite the quickly filled internal storage capacity (2 days) and the corresponding declines in P-uptake rates of ∼90% in saturating concentrations, saturated state uptake rates in U. lactuca can significantly contribute to the absorption of P, leading to less eutrophic waters and production of valuable biomass for food, feed, and energy.
It is also known that there is a significant positive correlation between N and P concentrations in macroalgae, and that N and P tend to be present at a ratio of about 12 in the tissues of aquatic plants (Duarte, 1992). The levels of N/P estimated in wild Ulva were relatively high, most likely due to phosphorus limitation. In cultured Ulva, N/P ratio decreased when compared to its wild counterpart, as P increased more than N. Villares et al. (1999) found that there is a parallelism between the evolution of the growth rate and nutrient contents in Ulva sp., especially where tissue P is concerned. The culture conditions of the present experiment improved Ulva quality, as protein content (60%), P content and chlorophyll pigments increased. Growing Ulva in effluent media increases its protein content (>40%) and turned it out to be a valuable feed for macroalgivores species with high commercial value (Favot et al., 2019), such as abalone (Shpigel et al., 2018) and sea urchin (Neori et al., 2000, 2004).
Gómez-Pinchetti et al. (1998) observed that under N-enrichment of U. rigida, the content in fiber, energy and 16:0 decreased as photosynthetic rate increased. In our experiments, Ulva cultivated in indoor RAS showed reduced energy budget and carbohydrate content, as well as 16:0 levels (% total fatty acids), compared to its wild counterpart. High levels of saturated FA, especially 16:0, are typical for green seaweeds. This fatty acid is considered a storage product, contributing to the synthesis of triacyglycerol, indicating that it was utilized as an energy source to compensate the effects of the limited lighting in cultivated Ulva (Floreto et al., 1993, 1994). Fatty acids that increase at low light intensity are associated with chloroplast membranes, which are primarily made up of PUFAs (Fuller and Nes, 1987). Floreto et al. (1994) found increased levels of 14:1 and 16:4n-3 in U. pertusa cultivated at low light intensity, suggesting that these fatty acids may be related to photosynthetic membranes. In this study, there was a trend of increased PUFA levels, 14:1n-5 increased slightly and 16:4n-3 was not detected in wild samples, whereas low concentrations were recorded in cultivated Ulva. This complies with the observation that cells maintain a high rate of pigment-protein synthesis at low light intensity to increase light absorption and light utilization efficiency for photosynthesis (Sukenik et al., 1989) under nitrogen availability (Gómez-Pinchetti et al., 1998).
Body-weight relationships proved an isometric growth (b = 3) for sea bass in Ulva-RAS, but a positive allometric growth (b > 3) with increased variance in body weight and length in control-RAS. Final condition factor (K), lipid content and lipid productive value were significantly higher in sea bass of UF when compared to CF groups. As condition factor is considered as an index of fish physiological status (Seher and Suleyman, 2012), it is important that sea bass in Ulva-RAS overcome better the nutritional stress imposed by the fish oil substitution with vegetable oils. It has been demonstrated that fish fed algae may obtain storage lipids that are active and readily mobilized to energy prior to muscle protein degradation in response to energy requirements, resulting in a suppression of body weight loss (Nakagawa and Kasahara, 1986; Nakagawa et al., 1993). In this study, sea bass in Ulva-RAS showed a significantly higher crude protein content, and a trend to increased protein productive value and growth rate, when compared to the control fish groups. This could be explained either by the increased feed intake of fish in Ulva-RAS, and/or by Ulva induced protein breakdown suppression, under the nutritional stress caused by replacing fish oil with vegetable oils. The results of sea bass growth and proximate composition, in this study, were similar to that of specimens that had been fed Ulva, although it was not incorporated as feed additive. Although Ulva was cultured in separated tanks, the ventilation that was used for thalli to remain suspended for light absorption, facilitated the formation of Ulva detritus. Sea bass appeared to be able to consume Ulva detritus or soluble extracts that passed from seaweed cultivation to fish rearing tanks through the water flow in RAS.
It is well known that dietary fatty acid composition greatly affects that of the reared fish (Turchini et al., 2009). Fatty acid profile of sea bass followed that of the feed provided. However, sea bass reared in Ulva-RAS showed significantly lower levels (% total fatty acids) of n-3 HUFA and saturated compared to fish in control-RAS, as a result of their higher growth rate. However, the levels of essential fatty acids EPA and DHA, in terms of g per 100 g wet weight of total body, were found higher in sea bass reared in Ulva-RAS when compared to control-RAS, as a result of the increased lipid content. The nutritional quality (high protein and n-3 HUFA) gives added value to sea bass reared in seaweed integrated aquaculture.
Sea bass reared in Ulva-RAS showed increased phosphorus retention when compared to fish in control-RAS, which may be associated to the relatively increased lipid content that fish obtained when co-cultured with Ulva, thus requiring higher levels of phosphorus incorporated to phospholipids. If fish retain P more than N (high P/N retention ratio), they are in a P-deficient state and the reverse suggests that they are in a P-excess or malnutrition state (Sugiura et al., 2000). Sea bass in control-RAS showed a P/N retention ratio (0.17) similar to that of the final P/N ratio of the whole body (0.17) and it seems to be in a P-efficient state. Sea bass in Ulva-RAS showed an increased N-content and an elevation in P-content resulting to a P/N retention ratio (0.19) higher to the P/N ratio of the whole body (0.18), indicating that fish were in a P-deficient state. Retention of dietary P by fish used to be about 20% in typical commercial aquaculture feed and most dietary P (69–86%) is excreted in the effluent (Lazzari and Baldisserotto, 2008). Specifically, the dietary P that was excreted by sea bass in Ulva-RAS was 61.53%, whereas in control-RAS was 67.12%. There is a threshold concentration of dietary P, above which P-sufficient fish excrete excess portions of dietary P linearly with dietary P levels, while P-deficient fish continue to retain dietary P even after the point at which they start to excrete P (Sugiura et al., 2000).
Despite the increased P retention by sea bass in Ulva-RAS and the absorption of P by Ulva, the final concentration of total phosphorus in water tanks was higher in Ulva-RAS compared to control-RAS. It seems that detritus from Ulva decomposition, that were not removed from the system, enriched water with P, which was accumulated over time in Ulva-RAS. It has been found that the decomposing green algae released considerable amounts of ammonium and phosphate into the surrounding seawater, where the nutrients could support red tides (Wang et al., 2012).
It is concluded that Ulva ameliorates both quality and growth of sea bass fed diets containing vegetable oils. Ulva in multitrophic systems exerts positive integration effects on fish fed alternative diets, thus contributing to aquaculture sustainability. The quality of IMTA-Ulva was upgraded, in terms of protein, phosphorus and chlorophyll content, being a valuable feed resource. Moreover, Ulva may optimize water quality in integrated aquaculture by supplying O2, reducing CO2 and controlling pH, ammonia and nitrates. Ulva in integrated aquaculture improves system efficiency, as well as fish robustness. However, further research is required concerning the effects of Ulva culture on phosphorus accumulation in the aquatic environment.
Conflict of interest
The authors have declared no conflict of interest.
Acknowledgements
This work is a case study of Sub-Task 1.1.2. Seabass and Ulva indoor seawater RAS with biofilters of the project “Integrated Multitrophic Aquaculture for EFFiciency and Environmental Conservation − IMTA-Effect”, funded under the ERA-Net COFASP. We would also like to thank the technician George Constantinou for the maintenance of RAS-units.
References
- Abreu MH, Pereira R, Yarish C, Buschmann AH, Sousa-Pinto I. 2011. IMTA with Gracilaria vermiculophylla: Productivity and nutrient removal performance of the seaweed in a land-based pilot scale system. Aquaculture 312: 77–87. [CrossRef] [Google Scholar]
- AOAC. Official Methods of Analysis, 16th edn, Association of Official Analytical Chemists, Arlington, 1998. [Google Scholar]
- AOCS Ce 1i-07. 2009. Saturated, cis-Monounsaturated, and cis-Polyunsaturated Fatty Acids in Marine and Other Oils Containing Long Chain Polyunsaturated Fatty Acids (PUFAs) by Capillary GLC. [Google Scholar]
- Ben-Ari T, Neori A, Ben-Ezra D, Shauli L, Odintsov V, Shpigel M. 2014. Management of Ulva lactuca as a biofilter of mariculture effluents in IMTA system. Aquaculture 434: 493–498. [CrossRef] [Google Scholar]
- Breure MS. 2014. Exploring the potential for using seaweed Ulva lactuca, as organic fertilizer, MSc Thesis Plant Production Systems. PPS-80436, Wageningen University. [Google Scholar]
- Buschmann AH, Mora OA, Gómez P, Böttger M, Buitano S, Retamales C, Vergara PA, Guiterrez A. 1994. Gracilaria chilensis outdoor tank cultivation in Chile: use of land-based salmon culture effluents. Aquac Eng 13: 283–300. [CrossRef] [Google Scholar]
- Carl C, De Nys R, Paul NA. 2014. The seeding and cultivation of a tropical species of filamentous Ulva for algal biomass production. PLoS One 9: e98700. [CrossRef] [Google Scholar]
- Chopin T, Buschmann AH, Halling C, Troell M, Kautsky N, Neori A, Kraemer GP, Zertuche-González JA, Yarish C, Neefus C. 2001. Integrating seaweeds into marine aquaculture systems: a key toward sustainability. J Phycol 37: 975–986. [CrossRef] [Google Scholar]
- Cohen I, Neori A. 1991. Ulva lactuca Biofilters for Marine Fishpond Effluents I. Ammonia Uptake Kinetics and Nitrogen Content. Bot Mar 34: 475–482. [CrossRef] [Google Scholar]
- Duarte CM. 1992. Nutrient concentration of aquatic plants: patterns across species. Limnol Oceanogr 37: 882–889. [CrossRef] [Google Scholar]
- Duke ClS, Lapointe BE, Ramus J. 1986. Effects of light on growth, rubpcase activity and chemical composition of Ulva species (Chlorophyta). J Phycol 22: 362–370. [CrossRef] [Google Scholar]
- EPA US. 1971. Method 352.1: Nitrogen, Nitrate Colorimetric, Brucine, by Spectrophotometer. [Google Scholar]
- EPA US. 1978. Method 365.3: Phosphorous, All Forms Colorimetric, Ascorbic Acid, Two Reagent. [Google Scholar]
- FAO. 2009. Integrated mariculture: a global review. FAO Fisheries and Aquaculture Technical Paper 529, edited by D. Soto, No. 529, Rome, 2009, 183p. [Google Scholar]
- Favot G, Cunha ME, Quental-Ferreira H, Ester M, Serrão Á. 2019. Production of Ulva Sp. in multitrophic aquaculture in earth ponds. Aquac Fish Stud 1: 1–8. [Google Scholar]
- Floreto EAT, Hirata H, Ando S, Yamasaki S. 1993. Effects of temperature, light intensity, salinity and source of Nitrogen on the growth, total lipid and fatty acid composition of Ulva pertusa Kjellman Chlorophyta. Bot Mar 36: 149–158. [Google Scholar]
- Floreto AT, Hirata H, Yamasaki S, Castro SC. 1994. Influence of light intensity on the fatty acid composition of Ulva pertusa Kjellman Chlorophyta. Bot Mar 37: 143–149. [Google Scholar]
- Folch JM, Lees M, Sloane-Stanley GH. 1957. A simple method for the isolation and puri¢cation of total lipids from animal tissues. J Biol Chem 226: 497–509. [CrossRef] [PubMed] [Google Scholar]
- Froese R. 2006. Cube law, condition factor and weight–length relationships: history, meta-analysis and recommendations. J Appl Ichthyol 22: 241–253. [CrossRef] [Google Scholar]
- Fuller G, Nes WD. 1987. Plant lipids and their interactions, in: G. Fuller, W.D. Nes (Eds.), Ecology and Metabolism of Plant Lipids, Vol. 325, pp. 2– 8, ACS Symp. Ser. [CrossRef] [Google Scholar]
- Gómez-Pinchetti JL, del Campo Fernández E, Moreno Díez P, Reina GC. 1998. Nitrogen availability influences the biochemical composition and photosynthesis of tank-cultivated Ulva rigida (Chlorophyta). J Appl Phycol 10: 383–389. [CrossRef] [Google Scholar]
- Granada L, Sousa N, Lopes S, Lemos MFL. 2016. Is integrated multitrophic aquaculture the solution to the sectors' major challenges? Rev Aquac 8: 283–300. [CrossRef] [Google Scholar]
- Holdt SL, Kraan S. 2011. Bioactive compounds in seaweed: functional food applications and legislation. J Appl Phycol 23: 543–597. [CrossRef] [Google Scholar]
- Hotimchenko SV. 2002. Fatty acid composition of algae from habitats with varying amounts of illumination. Russ J Mar Biol 28: 218–220. [CrossRef] [Google Scholar]
- Jiménez-Escrig A, Gómez-Ordóñez E, Rupérez P. 2011. Seaweed as a source of novel nutraceuticals: sulfated polysaccharides and peptides. Adv Food Nutr Res 64: 325–337. [CrossRef] [PubMed] [Google Scholar]
- Lazzari R, Baldisserotto B. 2008. Nitrogen and phosphorus waste in fish farming. Bol. Inst. Pesca 34: 591–600. [Google Scholar]
- Lubsch A, Timmermans K. 2018. Uptake kinetics and storage capacity of dissolved inorganic phosphorus and corresponding N:P dynamics in Ulva lactuca (Chlorophyta). J Phycol 54: 215–223. [CrossRef] [PubMed] [Google Scholar]
- Martins CIM, Eding EH, Verdegem MCJ, Heinsbroek LTN, Schneider O, Blancheton JP, d'Orbcastel ER, Verreth JAJ. 2010. New developments in recirculating aquaculture systems in Europe: a perspective on environmental sustainability. Aquac Eng 43: 83–93. [CrossRef] [Google Scholar]
- Mourente G, Bell JG. 2006. Partial replacement of dietary fish oil with blends of vegetable oils (rapeseed, linseed and palm oils) in diets for European sea bass (Dicentrarchus labrax L.) over a long term growth study: Effects on muscle and liver fatty acid composition and effectiv. Comp Biochem Physiol B Biochem Mol Biol 145: 389–399. [CrossRef] [PubMed] [Google Scholar]
- Nakagawa H, Kasahara S. 1986. Effect of Ulva meal supplement to diet on the lipid metabolism of red sea bream. Bull Japan Soc Sci Fish 52: 1887–1893. [CrossRef] [Google Scholar]
- Nakagawa H, Nematipour GR, Yamamoto M, Sugiyama T, Kusaka K. 1993. Optimum level of Ulva meal diet supplement to minimize weight loss during wintering in, black sea bream Acanthopagrus schlegeli Bleeker. Asian Fish Sci 6: 139–148. [Google Scholar]
- Neori A, Cohen I, Gordin H. 1991. Ulva lactuca biofilters for marine fishpond effluents II. Growth rate, yield and C:N ratio. Bot Mar 34: 483–490. [CrossRef] [Google Scholar]
- Neori A, Shpigel M, Ben-Ezra D. 2000. A sustainable integrated system for culture of fish, seaweed and abalone. Aquaculture 186: 279–291. [CrossRef] [Google Scholar]
- Neori A, Chopin T, Troell M, Buschmann AH, Kraemer GP, Halling C, Shpigel M, Yarish C. 2004. Integrated aquaculture: rationale, evolution and state of the art emphasizing seaweed biofiltration in modern mariculture. Aquaculture 231: 361–391. [CrossRef] [Google Scholar]
- Pedersen M, Borum J, Leck Fotel F. 2010. Phosphorus dynamics and limitation of fast- and slow-growing temperate seaweeds in Oslofjord, Norway. Mar Ecol Prog Ser 399: 103–115. [CrossRef] [Google Scholar]
- Prieto FJ, Millero FJ. 2002. The values of pK1 + pK2 for the dissociation of carbonic acid in seawater. Geochim Cosmochim Acta 66: 2529–2540. [CrossRef] [Google Scholar]
- Sajjadi M, Carter CG. 2004. Dietary phytase supplementation and the utilisation of phosphorus by Atlantic salmon (Salmo salar L.) fed a canola-meal-based diet. Aquaculture 240: 417–431. [CrossRef] [Google Scholar]
- Sand-Jensen K. 1988a. Minimum light requirement for growth in Ulva lactuca . Mar Ecol Prog Ser 50: 187–193. [CrossRef] [Google Scholar]
- Sand-Jensen K. 1988b. Photosynthetic responses of Ulva lactuca at very low light. Mar Ecol Prog Ser 50: 195–201. [CrossRef] [Google Scholar]
- Sangun L, Akamca E, Akar M. 2007. Weight-length relationships for 39 fish species from the North-Eastern Mediterranean Coast of Turkey. Turk J Fish Aquat Sci 7: 37–40. [Google Scholar]
- Schneider O, Sereti V, Eding EH, Verreth JAJ. 2005. Analysis of nutrient flows in integrated intensive aquaculture systems. Aquac Eng 32: 379–401. [CrossRef] [Google Scholar]
- Schuenhoff A, Shpigel M, Lupatsch I, Ashkenazi A, Msuya FE, Neori A. 2003. A semi-recirculating, integrated system for the culture of fish and seaweed. Aquaculture 221: 167–181. [CrossRef] [Google Scholar]
- Seher D, Suleyman CI. 2012. Condition factors of seven Cyprinid fish species from Çamligöze dam lake on central Anatolia, Turkey. Afr J Agric Res 7: 4460–4464. [CrossRef] [Google Scholar]
- Shpigel M, Shauli L, Odintsov V, Ashkenazi N, Ben-Ezra D. 2018. Ulva lactuca biofilter from a land-based integrated multi trophic aquaculture (IMTA) system as a sole food source for the tropical sea urchin Tripneustes gratilla elatensis . Aquaculture 496: 221–231. [CrossRef] [Google Scholar]
- Strickland JDH, Parsons TR. A Practical Handbook of Seawater Analysis, 2nd edn, Fisheries Research Board of Canada, Bulletin No 167, 1972. [Google Scholar]
- Sugiura SH, Dong PM, Hardy RW. 2000. Primary responses of rainbow trout to dietary phosphorus concentrations. Aquac Nutr 6: 235–245. [CrossRef] [Google Scholar]
- Sukenik A, Carmeli Y, Berner T. 1989. Regulation of fatty acid composition by irradiance level in the eustigmatophyte Nannochloropsis sp. J Phycol 25: 686–692. [CrossRef] [Google Scholar]
- Terpstra A. 2015. The Composition and Production of Fish Feeds: An Overview of Data from the Literature and the Internet. Philosophiae Doctor Universitate Vadensi Orando, Laborando et Cogitando Patefiet Verum. The Netherlands. [Google Scholar]
- Troell M, Halling C, Neori A, Chopin T, Buschmann AH, Kautsk N, Yarish C. 2003. Integrated mariculture: asking the right questions. Aquaculture 226: 69–90. [CrossRef] [Google Scholar]
- Turchini GM, Torstensen BE, Ng WK. 2009. Fish oil replacement in finfish nutrition. Rev Aquac 1: 10–57. [CrossRef] [Google Scholar]
- Turchini GM, Francis DS, Senadheera SPSD, Thanuthong T, De Silva SS. 2011. Fish oil replacement with different vegetable oils in Murray cod: Evidence of an “omega-3 sparing effect” by other dietary fatty acids. Aquaculture 315: 250–259. [CrossRef] [Google Scholar]
- Villares R, Puente X, Carballeira AA. 1999. Nitrogen and phosphorus in Ulva sp. in the Galician Rias Bajas (northwest Spain): Seasonal fluctuations and influence on growth. Bol Inst Oceaogr 15: 337–341. [Google Scholar]
- Vimala T, Poonghuzhali TV. 2015. Estimation of pigments from seaweeds by using acetone and DMSO. Int J Sci Res 4: 1850–1854. [Google Scholar]
- Wang C, Yu RC, Zhou MJ. 2012. Effects of the decomposing green macroalga Ulva (Enteromorpha) prolifera on the growth of four red-tide species. Harmful Algae 16: 12–19. [CrossRef] [Google Scholar]
Cite this article as: Chatzoglou E, Kechagia P, Tsopelakos A, Miliou H. 2020. Co-culture of Ulva sp. and Dicentrarchus labrax in Recirculating Aquaculture System: effects on growth, retention of nutrients and fatty acid profile. Aquat. Living Resour. 33: 19
All Tables
Mean values (±SE) of temperature (°C), salinity, pH, dissolved oxygen and carbon dioxide from daily measurements during the 12-week trial, as well as mean values (mg L−1) of total ammonia, nitrite, nitrate, orthophosphates and total phosphorus for samples collected twice per week.
Mean values (±SE) of body weight (W), total length (TL), standard length (SL), fork length (FL) and Fulton's condition factor (K) of sea bass at different time periods in CF (fish group in control-RAS) and UF (fish group in Ulva-RAS) (n = 144–150).
Coefficients (a: intercept. b: slope) of body weight (g) − length (cm) linear regression lines (after ln transformation of data) for CF (fish group in control-RAS) and UF (fish group in Ulva-RAS), adjusted R2 of the model estimated at different time periods of sea bass farming.
Growth performance of sea bass reared in RAS with (UF) or without Ulva (CF) during different time periods of the experiment (n=3).
Mean values (±SE) of PER (Protein efficiency ratio), PPV (Protein productive value), LER (Lipid efficiency ratio), and LPV (Lipid productive value) estimated in CF (fish group in control-RAS) and UF (fish group in Ulva-RAS) (n=3).
Proximate composition (% w.w.), gross energy (kJ g−1), N, P (% w.w.) and N/P of sea bass at the beginning (initial) and after 12 weeks of rearing (final) in CF (fish group in control-RAS) and UF (fish group in Ulva-RAS).
Proximate composition (% w.w.), gross energy (kJ g−1), N, P (% w.w.), N/P and chlorophyll (µg g−1) of wild and bi-weekly cultivated Ulva.
Selected fish fatty acid profile (% total identified fatty acids) of sea bass fed the VO-diet in CF (fish group in control-RAS) and UF (fish group in Ulva-RAS), as well as of wild and bi-weekly cultivated Ulva.
All Figures
|
Fig. 1 Experimental design. Ulva-RAS: co-culture of Ulva and seabass with the first in the upper tanks (UW) and the second in the lower tanks (UF). Control-RAS: upper tanks without seaweed (CW) and lower tanks for sea bass rearing (CF), GRAVEL BIOFILTER: a bed of gravel with bacterial biofilm. |
| In the text | |
|
Fig. 2 Mean values (±SE) of orthophospates ( |
| In the text | |
|
Fig. 3 Mean values (±SE) of orthophosphates ( |
| In the text | |
|
Fig. 4 The N-nutrients reduction efficiency was calculated for Ulva and gravel biofilter in Ulva-RAS, expressed as percentage of the difference of nutrient concentration in water. |
| In the text | |
|
Fig. 5 Weight (W) − total length (TL) relationships for sea bass in control RAS (CF) and Ulva-RAS (UF) groups at the end of the experimental period. |
| In the text | |
Current usage metrics show cumulative count of Article Views (full-text article views including HTML views, PDF and ePub downloads, according to the available data) and Abstracts Views on Vision4Press platform.
Data correspond to usage on the plateform after 2015. The current usage metrics is available 48-96 hours after online publication and is updated daily on week days.
Initial download of the metrics may take a while.