| Issue |
Aquat. Living Resour.
Volume 35, 2022
|
|
|---|---|---|
| Article Number | 12 | |
| Number of page(s) | 19 | |
| DOI | https://doi.org/10.1051/alr/2022012 | |
| Published online | 23 September 2022 | |
Research Article
Changes in the population structure and life history associated with long-term intense fishing of the Argentinian croaker Umbrina canosai in southern Brazil
1
Laboratório de Recursos Pesqueiros Demersais, Instituto de Oceanografia, Universidade Federal do Rio Grande, FURG. Av. Itália, km 8, CEP: 96203–000, Rio Grande, RS, Brazil
2
Programa de Pós-graduação em Oceanografia Biológica, Instituto de Oceanografia, Universidade Federal do Rio Grande, FURG. Av. Itália, km 8, CEP: 96203–000, Rio Grande, RS, Brazil
* Corresponding author: This email address is being protected from spambots. You need JavaScript enabled to view it.
: Flavia Lucena Fredou
Received:
9
December
2021
Accepted:
5
July
2022
Abstract
Identifying changes in the population structure and dynamics for fish stocks is important to support its management. Data obtained from 1976 to 2019 allowed to follow up long more than four decades the changes in the population structure and life-history of Umbrina canosai, an intensely exploited demersal sciaenid fish in southern Brazil. Intense fishing caused the truncation of the length/age structure with the loss of most of the bigger/older fishes and the sex ratio change, with increasing frequencies of males. A considerable increase in individual growth was observed and attributed to the lower competition for food due to the reduction in the density of the overall coastal benthic-feeding fish community caused by intense fishing. The large increase in the mortality and the exploitation rate resulted in a drastic decrease in the reproductive potential despite some anticipation in the sexual maturation. Despite the adaptative response to intense fishing, the high exploitation rates and the drastic reduction of the spawning potential ratio in recent years, are clear evidences that U. canosai could be reaching its adaptive capacity for resilience. Therefore, an urgent necessity for a drastic reduction of the fishing mortality to avoid the economic collapse of the fishery is required.
Key words: Fishery collapse / growth / life history / mortality / reproduction / spawning potential ratio
© M. Haimovici et al., Published by EDP Sciences 2022
 This is an Open Access article distributed under the terms of the Creative Commons Attribution License (https://creativecommons.org/licenses/by/4.0), which permits unrestricted use, distribution, and reproduction in any medium, provided the original work is properly cited.
1 Introduction
Marine fish populations are responsible for around half of the world's source of fish protein. It is also responsible for many jobs and the well-being of millions of fishers and workers in the fish food supply chains. Recent reviews on the world's fish resources show that, despite some management successes in developed countries, the number of overfished and collapsed fish stocks continues to increase (Pauly and Zeller, 2017; FAO, 2020).
The potential of marine bony fishes to resist large fisheries is related to the flexibility in their growth and reproduction strategies (Longhurst, 2010). The reductions in population abundance due to the removal of biomass by fishing are often accompanied by changes in their life histories as they adapt to new mortality regimes and food availability (Dieckmann and Heino, 2007; Darimont et al., 2009). Thus, intense fishing can lead to changes in the life history of marine fish, such as changes in age, length, and sex ratio structure. These changes can reduce the fish population's capacity to withstand intense fishing pressure and environmental variability, consequently increasing the risk of the economic collapse of the fisheries (Audzijonyte et al., 2016). However, these changes are often not monitored and ignored for the stock assessment and management of excessively exploited fish populations (Saborido-Rey and Trippel, 2013; Audzijonyte and Kuparinen, 2016). Therefore, management resulting from stock assessments that do not consider possible changes in population dynamics may provide a false sense of accuracy as an important source of uncertainty may be hidden (Kuparinen et al., 2012; Evans et al., 2013).
Sciaenid fishes are important soft-bottom continental shelf fishing resources worldwide in subtropical and warm temperate waters, usually associated with large freshwater inputs (Longhurst and Pauly, 1987; Lowe-McConnel, 1987). In the wide soft-bottom continental shelf of southwestern Atlantic, along southern Brazil, Uruguay and Argentina, these environmental characteristics favors the presence of large stocks of several sciaenid fishes (Ruarte et al., 2004; Cousseau and Perrotta, 2013; Gutiérrez and Defeo, 2013; Martins and Haimovici, 2017) that form the bulk of the catches of coastal demersal fisheries in the region (Haimovici and Cardoso, 2017). Although long-term changes in the population dynamics of marine groundfishes have been frequently addressed in the literature, few deals with sciaenid fishes since long-term studies for this family are seldom available (Keith and Hutchings, 2012).
The Argentinian croaker Umbrina canosai (Berg 1895) is a demersal sciaenid fish endemic between Rio de Janeiro (lat. 220S) in Brazil and the southern end of the Buenos Aires Province (lat. 410 30'S) in Argentina ( Fig. 1), occurring at a maximum depth of up to 150 m in Brazil and 85 m in Argentina (Cousseau and Perrotta, 2013; Figueiredo et al., 2002). Two stocks of U. canosai are presently recognized (Canel et al., 2019; Kikuchi et al., 2021), a northern stock along Southeastern Brazil (lat. 220S to 280S) and a southern stock along Southern Brazil, Uruguay, and the Buenos Aires province in Argentina (lat. 280S − 410S).
Umbrina cansoai is a relatively small and long-living species (Haimovici and Reis, 1984), with high fecundity and small pelagic eggs spawned in batches in shelf waters (Haimovici and Cousin, 1989). The southern stock spawns mainly along southern Brazil during winter and spring, and later on, most adults migrate southwards during summer to feeding grounds in coastal waters of Uruguay and Argentina (Gonzalez-Alberdi and Nani, 1967; Haimovici and Cousin, 1989); however mature spawning females were observed in the Rio de la Plata outer waters and in the inner coastal shelf of El Rincon (Militelli et al., 2013). Small juveniles were observed in autumn in shallow coastal waters and larger juveniles from the winter on in its nursery grounds, mostly between the 25 and 50 m isobaths (Haimovici et al., 1996). The species feeds mostly on inbenthic and epibenthic small organisms (Haimovici et al., 1989).
The southern stock of U. canosai is one of the main demersal fish resources in the region, targeted almost exclusively by industrial fishing, suffered several ups and downs in the landings since the 1960 s, when it began to be fished for fishmeal in Argentina ( Fig. 2). In 1966–67 a Russian distant waters fleet of bottom trawlers fished large quantities of demersal fishes in the continental shelf off Argentina, including U. canosai (Gonzalez-Alberdi and Nani, 1967). From the 1960 s on, Brazilian trawlers began to fish heavily on coastal sciaenid fishes along Uruguay and Argentina, and the landings of U. canosai attained ca 25,000 t in 1974 (Yesaki and Bager, 1975). Since the mid-1970 s, Uruguay and Argentina restricted access to their exclusive economic zone and most fishing displaced towards southern Brazil. Due to intense fishing, mostly in Brazil, total landings decreased steadily to less than 7000 t in the late 1990 s (Haimovici et al., 1989; Haimovici, 1998; Haimovici et al., 2006). During the 2000 s, annual landings recovered to 15,000–20,000 t, followed by a sharp decrease in the 2010 s to less than 7000 t in 2019. The last fall was attributed to the development of midwater trawling fishing on the migrating reproductive concentrations along the outer shelf of southern Brazil (Haimovici and Cardoso, 2016).
Because of the economic importance of the sciaenid fishes, including U. canosai, for the industrial demersal fishery along southern Brazil, its landings in Rio Grande have been sampled since 1976 (Haimovici, 1987). Based in these well-documented long-term data series, we analysed the long-term changes in the population structure and dynamics of an intensely exploited southern stock of U. canosai.
 |
Fig. 1 Stocks distribution range and sampling area of Umbrina canosai along southern Brazil. |
 |
Fig. 2 Recorded landings of the Argentine croaker Umbrina canosai along all its distribution range from 1959 to 2019 (along the last six decade). |
2 Material and methods
The data for the analysis of long-term changes in the population dynamics of the southern stock, were collected along a sampling program of the industrial fishing landings in Rio Grande from 1976 to 2019 along southern Brazil, and complemented by occasional bottom trawl surveys in the same region (Haimovici, 1987; Haimovici et al., 1996).
In the multi-species coastal industrial bottom-trawl and gillnet fisheries, fish are stored onboard with ice in holds without previous size classification. Therefore sampling for length-frequency distributions involved measuring randomly selected U. canosai at the dockside landings (Haimovici, 1987). The number of specimens measured took into account the range of total lengths and the time available to sample each landing. Between 1976 and 2019, 374,896 U. canosai were measured from 1419 dockside landings of single otter board trawlers, pair trawlers, double rig trawlers, and bottom gillnet boats. For the length frequencies samples, fishes were measured to the lower cm from the snout tips to the end of the extended caudal fin. More detailed biological samplings included the (TL, mm), total weight (TW, g), gonads weight (GW, g), sex and maturity stages, and otoliths collected for age determinations. Biological sampling took place either at the dock or in the laboratory. Overall, we determined the sex of 21,897 specimens, aged 19,916, recorded the total weight for 18,310, and the maturity stage and gonads weight of 13,299 individuals ( Tab. 1).
Data were collected in 38 of the 46 years between 1976 and 2019. For growth, length, age and sex structure, spawning potential and mortality data were grouped in ten periods in which both length compositions and age determinations were available: (1) 1976–1978, (2) 1979–1981, (3) 1982–1984, (4) 1985–1987, (5) 1988–1990, (6) 1992–1994, (7) 1997–2001, (8) 2006–2009, (9) 2011–2015 and (10) 2016–2019. Only samples from the beginning (1976–1984) and the end (2011–2018) of the sampling period were considered for length and age at first maturity, and reproductive investment studies.
Number of Umbrina canosai sampled along southern Brazil for the analysis of its life-history and population structure.
2.1 Age and growth
Umbrina canosai, as most sciaenid fishes, have relatively large and stout otoliths that show alternate opaque and translucent bands, each pair corresponding to one year of life (Haimovici and Reis, 1984). For age determinations, the otoliths were polished transversally up to the height of the nucleus using a grinding machine and examined with a binocular microscope with lateral transmitted light. The number of opaque zones was counted along the edge of the sulcus of the otolith surface. The type of band (opaque or translucent) deposited on the otolith edge was recorded. The otoliths were read independently by the first author and different second readers along the years. If counts differed, otoliths were read again, and if differences persisted, the specimens were discarded from further analyses requiring age determinations. Overall. 95.1% of the 20,968 specimens with examined otoliths were consistently aged. The percentage of opaque bands in the border of the otolith increased gradually from less 3% in August to a maximum of 81% in January and decreased to non in July ( Fig. 3), showing the otoliths' suitability for accurate age determinations. For growth modeling, we convened a common birthday on October 1, based on the reproductive cycle (see Sect. 3.2).
The von Bertalanffy growth model were fitted to age-length data following a Bayesian approach to describe the individual growth of U. canosai. The von Bertalanffy parameters (TL∞ = asymptotic length in mm, k = instantaneous growth coefficient and t0 = theoretical age at zero length) and their 95% credibility intervals were calculated for each sex separately and pooled sexes for each of the sampling periods.
We assumed that the age-length data (or the number of bands-length data) followed a log-normal distribution: yi = logN(μi, σ2), where yi is the length distribution with an average expected length at an age class (or band class) i with variance σ2. A logarithmic version of the von Bertalanffy equation was used for computational convenience:

Uninformative priors were constructed:


We obtained posterior distributions of each time period via the stochastic process Monte Carlo Markov Chain (MCMC) to compare the estimates of the growth parameters across time. After 10,000 burn-in runs, every second value of the remaining 20,000 was retained, resulting in a final sample of 10,000 in the posterior distribution p (log TL∞ , log k, log t0 ǀD) (Kinas and Andrade, 2010). The posterior distribution of each estimated parameter provided an easy and clear way to compare the results among periods. All statistics in this study were run by R version 3.6.1 (R Core Team, 2019). The MCMC was performed by OpenBUGS, using the libraries R2WinBUGS (Sturtz et al., 2005) and BRugs (Thomas et al., 2006).
 |
Fig. 3 Relative monthly frequency of opaque (black columns) and translucent (grey columns) borders (edges) of the sectioned otoliths of Umbrina canosai sampled in southern Brazil (n = 19,916). |
2.2 Weight–length and condition factor
The relationship between weight and length was described by the potential model (TW = aTL b ). For comparisons, the data were transformed into decimal logarithms, and the linear regression models were compared between sexes through covariance analysis (α = 0.05) (Zar, 1999). For each specimen an allometric condition factor K = TW/TL b (Le-Cren, 1951) was calculated, where b is the coefficient of the potential equation of the weight–length relationship.
2.3 Reproductive cycle
A maturation scale of seven stages was used to characterize the maturity of both males and females macroscopically (i.e. by naked eye). The seven-stage scale encompasses I: Virginal immature; II: Developing virginal; III: Developing, IV: Advanced development; V: Running; VI: Partly spent; VII: Recovering (Haimovici and Cousin 1989). Stage III was considered the onset of maturation, and specimens in stages III to VI were considered sexually mature. For each specimen, a gonadosomatic index was calculated as  (Wooton, 1998). It was observed that for both sexes, the mean GSI corresponding to the virginal and developing I, II stages, and the recovering stage VII were all significantly lower than 1, whereas specimens in developing to partly spent stages III to VI had GSI over than 1 (
Fig. 4). Therefore, specimens with GSI > 1 were considered to describe the annual reproductive cycle. In addition, the relationship between the GSI (response variable) and the length, age, and weight (continuous variables) of sexually mature females in the reproductive periods (categorical variable) were analyzed using generalized linear models (GLM) assuming Gaussian distributions. The best model was identified according to the weighted values of the Akaike information criterion (AIC).
(Wooton, 1998). It was observed that for both sexes, the mean GSI corresponding to the virginal and developing I, II stages, and the recovering stage VII were all significantly lower than 1, whereas specimens in developing to partly spent stages III to VI had GSI over than 1 (
Fig. 4). Therefore, specimens with GSI > 1 were considered to describe the annual reproductive cycle. In addition, the relationship between the GSI (response variable) and the length, age, and weight (continuous variables) of sexually mature females in the reproductive periods (categorical variable) were analyzed using generalized linear models (GLM) assuming Gaussian distributions. The best model was identified according to the weighted values of the Akaike information criterion (AIC).
 |
Fig. 4 Relationship between the gonadosomatic indices and macroscopic maturity stages for males (n = 5971) and females (n = 6900) Umbrina canosai from southern Brazil. Vertical bars represent 95% confidence intervals of GSI. |
2.4 First maturation analysis
The length (TL 50, mm) and age (A 50, years) at first maturity corresponding to the beginning (1976–1984) and the end (2011–2018) of the sampled period were calculated with a Bayesian approach to the logistic model (Kinas and Andrade, 2010; Cardoso and Haimovici, 2014). Only samples from months in which most specimens were in developing to partly spent stages were selected for the estimation of maturity ogives.
The total number (ni ) and the number of mature specimens (yi ) were calculated for both sexes for each age class and for each 10-mm total length class intervals for both periods. If θ i denotes the probability of an individual of the ith age class or ith length class being mature, yi was assumed to follow a binomial distribution Bin (n i ,θ i ).
Data were fitted to a logistic model, defined by a logit link function that transforms the parameter θ i , restrict to the range [0, 1] in the binomial distribution, in m defined between (–∞, +∞) (Kinas and Andrade, 2010). The logistic model was defined as follows:


where mi is the probabilities at each xi length class.
From this model, the length and age of first maturation are defined as follows:
 and
and 
The posterior distribution p (β0, β1|D), where D = {(y i , n i , x i ) ; i = 1, … , k}, of the parameters were obtained using Monte Carlo Markov Chain (MCMC) sampling performed using JagsUI (Kellner, 2019).
2.5 Population structure
Sex ratios were calculated for all different periods grouped by ages and 30 mm total length intervals (bins). Differences among age or size classes were tested with the X 2 test for heterogeneity, and among sampling periods, with 2 × 2 contingency tables (Zar, 1999).
Length-frequency distributions were calculated in 30 mm TL bins in ten multi-annual sequential periods as defined in Table 1. Data were available for all periods between 1976 and 2019 for otter-board and pair trawls and between 1991 and 2019 for double rig trawls and gillnets. Age composition was calculated combining length-frequency distributions with age-length keys for the same ten periods.
2.6 Mortality analysis
The instantaneous natural mortality coefficient M was calculated with the empirical estimator based on the age of the oldest aged specimen (t
max), assuming that the older fishes in the unexploited stocks were still present at the beginning of the samplings. Two empiric models were used:  (Then et al., 2015) and M = ln0.15/t
max (Dureuil and Froese, 2021).
(Then et al., 2015) and M = ln0.15/t
max (Dureuil and Froese, 2021).
For the total mortality analysis, the length frequencies in the landings of pair trawlers were considered representative of the length composition of the stock because this gear fishes at all depths of the inner shelf (<100 m). In addition, because of the migratory behaviour of U. canosai (Gonzalez-Alberdi and Nani, 1967; Haimovici and Cousin, 1989), the length and age composition the catches from winter and spring (second semester) in which the species reproduces along southern Brazil were considered to better represent of length and age structure of the stock. Therefore, the length compositions from the second semesters were converted to age frequencies using the corresponding age-length keys in ten multiannual sequential periods between 1976 and 2019.
The instantaneous total mortality coefficient (Z) was calculated using catch curves (Ricker, 1975). U. canosai younger than 3 years are not fully recruited for the mesh sizes used by bottom trawlers in the region (Vooren, 1983), and small specimens are discarded on board (Haimovici and Palacios, 1981; Cardoso et al., 2021). Specimens older than ten years become infrequent in the last periods. Therefore, only the frequencies of ages three to ten were included in this analysis. Furthermore, this choice was also a compromise between using the largest proportion of the stock age structure and the assumption that Z is constant for the fully recruited age classes (Ricker, 1975).
The catch curve of log (catch) (yi ) against age (xi ) when i = 3, …, 10, was defined by the following linear model to obtain the posterior distribution for the slopes of the regressions (Z) and their credibility intervals:

where β 0 is the intercept, β 1 is the slope of the linear model and ωi is the model error. Jeffreys' priors were assumed for the parameters (p (β 0, β 1, σ 2) α 1/σ 2) and the normal distribution (N (β 0 + β 1 x i, σ)) for p (yi ǀ β 0, β 1, σ). The marginal posterior distributions of the parameters are (Kinas and Andrade, 2010):


where b 0 and b 1 are the least-squares estimates for β 0 and β 1, respectively, Se 2 is the residual variance and St (g,m,v) are non-central Student distributions with g degrees of freedom, mean m and scale v. The variance σ2 follows an inverse gamma distribution. To obtain the posterior distribution of Z, we sampled 3000 values from the marginal posterior using the library MASS (Venables and Ripley, 2002).
2.7 Spawning potential ratio
The spawning potential ratio (SPR) measures the spawning biomass per recruit left after the fishing activity (assuming a logistic selectivity) and is an equilibrium measure of relative stock status under constant fishing mortality. SPR was calculated by using the LB-SPR package (Hutchings and Jones, 1998), which measures the SPR from size composition data and life-history inputs: M/k, TL∞ , and a maturity ogive (Hordyk et al., 2015). In addition, the LB-SPR estimates the fishing mortality and selectivity for each year of length compositions assuming each year independently. So, the model was applied for each sampling period defined in Section 2 (Tab. 1) independently, considering the growth parameters of females in each period ( Tab. 2). The female maturity ogives used in the model were those estimates at the beginning and end of the samplings ( Tab. 3), while for the intermediate years for which no estimate is available, the mean values of the parameters estimated in the beginning and end of the sampled period were used. Two models were run considering the two estimations of the instantaneous natural mortality coefficient (i.e. Then et al., 2015; Dureuil and Froese, 2021; see Sect. 2.6) and the length composition of the pair trawlers in the second semesters of each period, considered to better represent the length structure of the stock due to the reasons mentioned in Section 2.6.
Von Bertalanffy's growth parameters and their 95% credible intervals for females, males and pooled sex of Umbrina canosai from southern Brazil sampled in different sampling periods between 1976 and 2019.
Generalized Linear Models results for the relationship between gonadosomatic index (GSI) and the different sampling periods (1976-84 and 2011-18) and populational variables (length, age and weight) of sexually mature females of Umbrina canosai. Estimates and statistical significance of the fixed factors are shown for each variable. The AIC (Akaike's information criterion) are shown in the last column.
3 Results
3.1 Growth analyses
The weight (g)–length (mm) relationships for fishes between 93 and 535 mm did not differ between sexes (F = 0.01211; p = 0.9124). The relationship for pooled sexes including unsexed juveniles was W = 0.00001342 TL3.0111, R 2 = 0.9776.
Clear evidence of changes in growth along time was observed. Both sexes' mean length-at-age and weight-at-age show a gradual increase between the initial and last sampling period at all ages ( Fig. 5).
A general trend of increasing asymptotic length along the sampling periods was observed for both males and females ( Fig. 6), with no overlapping of the credibility intervals between the first and last sampling periods. However, the credibility intervals of the individual growth rates (k) as well as t 0, overlapped in most years with no changing trend along time (Tab. 2). As the t 0 parameter can be considered a “mathematical artifact” of the VB growth model, we were not able to analyze with more details the growth changes of the first ages.
In all the periods, the mean asymptotic length of females was larger than males, however, in most periods, the corresponding credibility intervals overlapped.
 |
Fig. 5 Mean total length (left) and weight at age (right) by age classes of the Umbrina canosai along ten sampling periods from Southern Brazil. |
 |
Fig. 6 Von Bertalanffy's growth curves for males and females of Umbrina canosai from southern Brazil sampled in different time periods between 1976 and 2019. |
3.2 Reproduction and condition
The monthly mean gonadosomatic index (GSI) and condition factor were calculated for all the sampling periods for three total length strata: 180–269 mm, 270–359 mm, and over 360 mm, corresponding respectively to small, mid-sized, and large females and males. Gonadosomatic indices of both sexes in all three length strata showed annual cycles ( Fig. 7). The GSI of the large and mid-sized females and males began to increase in July attained their higher values between August-September and November. The small-sized specimens began maturation a couple of month later. Males attained the higher GSI from September to December and females from October to January. For all size classes, the lower values occurred from February to June.
Condition factors of both males and females in all three length strata also show an annual cycle with the higher values in May and June, decreasing from July to December and January, and increasing from February to May and June (Fig. 7). The amplitude of the annual cycle of the condition factor increased with the length of the fishes. The minimum monthly condition factor in all three length strata was observed three to four months after the maximum GSI.
During the spawning season, the GSI was higher among the larger specimens, followed by the mid-sized and the smaller specimens, suggesting an increased reproductive investment along with growth (Fig. 7). In fact, for sexually mature females captured in the spawning season, all the generalized linear models showed that the GSI values were significantly affected by the length and by age and weight according to the best fit model (Tab. 3). Regardless of the sampling periods (1976–84 and 2011–18), it is possible to observe a positive relationship between the GSI and length, weight, and age ( Fig. 8)
 |
Fig. 7 Monthly mean gonadosomatic indices and condition factors of Umbrina canosai in southern Brazil sampled between 1976 and 2019 in three total length strata: 180–269 mm in blue, 270–359 mm in orange and over 360 mm in green. Vertical bars represent 95% confidence intervals. |
 |
Fig. 8 Mean gonadosomatic index by total length, weight and age of sexually mature females of Umbrina canosai captured in the spawning season along Southern Brazil in 1976–1984 (in black) and 2011–2018 (in gray) periods. Vertical bars represent the 95% confidence intervals. |
3.3 First maturity
Only data from October to December were included in the first maturity analyses as this was when the length range of the younger U. canosai had the highest gonadosomatic indices (Fig. 7 and Haimovici and Cousin, 1989).
The credibility intervals (95%) of all logistic models parameters β 1 did not include zero, which indicates that sexual maturity has a significant relationship with size and age ( Tab. 4, Fig. 9). For both sexes, the decrease of L 50 and A 50 between periods was significant as the 95% credibility intervals did not overlap (Fig. 9). The mean total length and age at first maturity (L 50 and A 50) in the 1996–84 period were 241 mm and 2.40 yr for males and 225 mm and 2.43 yr for females, dropping in the 2011–18 period to 219 mm and 1.90 yr for males and 203 mm and 1.67 yr for females (Tab. 4).
Logistic model parameters (β1 and β0 ), the calculated length and age at first maturity (L50 mm; A50 yr) and the length and age at which 95% of the specimens were mature (L95 mm; A95 yr) for Umbrina canosai landed in Rio Grande in two time periods: 1976-1984 and 2011-2018. All parameters and indices are presented as the mean of their posterior distributions and the 2.5 % (Cr I 2.5%) and 97.5% (Cr I 97.5%) credibility intervals.
 |
Fig. 9 Maturity-at-length (left) and maturity-at-age (right) ogives and corresponding probability densities fitted to data from 1976–1984 (dashed line) and 2011–2018 (full line) of females (upper panels) and males (lower panels) of Umbrina canosai sampled in southern Brazil. |
3.4 Sex ratio
Significant differences were observed in the sex ratios between the initial (1976–1984) and the last years (2011–2019) of the sampling periods. The proportion of females increased with age and size in both periods; however, in the last period a significant reduction in the proportion of females in all size classes or at ages under five years ( Tab. 5). In the first period, the proportion of females was over 50% for all TL over 300 mm and in all age classes, while in the last period, these proportions were only above 50% for specimens over 330 mm TL and 6 years old ( Fig. 10). When the proportion of females was weighed by the numbers in each length class in the landings of the pair trawlers in each period, the proportion of females decreased from 51.3% (CI95 = 50.9–51.5%) in 1976–1984 to 47.3% (CI95 = 47.0–47.5%) in 2011–2019. Thus, the overall sex ratio shifted from female dominance to male dominance.
Percentages of females in 30 mm TL interval classes and age of Umbrina canosai in the landings of commercial fishing along Southern Brazil landed in 1976-1984 and 2011-2018. χ2 and P(χ2, 95%) are the scores of 2 × 2 contingency tables to test the differences between periods and the corresponding 95% probabilities. *indicate significant differences.
 |
Fig. 10 Percentage of females of Umbrina canosai larger than 180 mm TL in 30 mm TL interval classes (left) and in age classes (right) in the landings of commercial fishing along Southern Brazil in 1976–1984 (in black) and 2011–2018 (in gray). Vertical bars represent the 95% confidence intervals. |
3.5 Size and age structure
Changes in the length and age compositions for the pair trawl, otter board trawl, bottom gillnet, and double rig trawl fisheries were analysed by examining their relative frequencies in each of the periods in which data were available ( Fig. 11). Larger and older specimens progressively decreased between the first and last sampling periods for all four legal gears.
The landings of pair trawlers shifted gradually from larger and older to smaller and younger fishes along time, with the modal TL decreasing from 330–359 mm to 210–269 mm and the modal age class decreasing from 3 yr to 1 yr.
The landings of the otter board trawlers showed a gradual decrease in the length and ages in the first eight sampling periods before the 2000 s. In the last two periods, a bimodal distribution was observed because it included the landings of nominal bottom trawlers that fished illegally with midwater trawls, targeting concentrations of large specimens during reproductive migrations (Haimovici and Cardoso, 2016). The left modal length decreased from the 270–299 mm interval in the earlier periods to 210–239 mm in the last period, and from age class three to age class one, respectively.
Bottom gillnet fishing started being sampled in the 1991–94 period with 80–110 mm stretched mesh between knots that are still in use (Vasconcellos et al., 2014); the modal length decreased from 330–359 mm to 240–299 mm and from the age class four to the age class three in all the following periods.
Since U. canosai is not a target species for double rig trawl, few samples for this fishing gear's age and length composition were obtained. At the beginning of this fishery (1991–94), when this fishery targeted mainly demersal fish, the modal length was in the 300–329 mm TL interval. However, in the following periods, when small shrimp became the main target of this fishery in coastal waters (Haimovici and Mendonça, 1996) a rapid decline to a modal length of 210–279 mm was observed. Despite changes in modal length, no evident changes in age composition were observed, where age classes 0 and 1 were predominant.
 |
Fig. 11 Relative frequency percentage of total length, in 30 mm bins and age for Umrbrina canosai along southern Brazil in the landings of pair trawl, otter trawl and gillnet industrial fisheries along Southern Brazil in ten sampling periods between 1976 and 2019. |
3.6 Mortality, exploitation rate and spawning potential ratio
The instantaneous coefficient of natural mortality (M) based on a t max of 26 years, corresponding to the older sampled U. canosai, was estimated as M = 0.248 yr−1 and 0.161 yr−1 for the empirical formulas proposed by Then et al. (2015) and Dureuil and Froese (2021) respectively. Estimated instantaneous total mortality coefficient (Z) for ages three to ten, increased abruptly from less than 0.32, in the first two periods, to 0.56 in the third period and gradually increased to reach over 0.86 in the last two periods (Fig. 12a).
The exploitation rate  , considering the M of 0.248 yr−1, was estimated at approximately 20% between 1976 and 1984, increasing to 50% in the following three decades and finally reaching about 70% after 2011. When the M of 0.161 yr−1 was considered, E in the two first periods was 50%, raised to 75% in the intermediate decades, and reached 86% in the final periods (Fig. 12b). The natural logarithm of the frequencies by age for all the ranges of ages for each period illustrates the gradual decrease of survival over time (Fig. 12c).
The spawning potential ratio (SPR) at the beginning of the samplings (1976–1978), estimated with an M of 0.161 yr−1 and 0.248 yr−1, were 26% and 40%, decreased sharply to only 5% and 10%, respectively, in the last period (2016–2019). These scenarios suggest losses between 95% and 90% of the spawning potential in relative to the pristine condition ( Fig. 13).
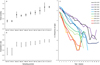 |
Fig. 12 (a) Instantaneous total mortality coefficients (Z) of Umrbrina canosai aged 3 to 10 yr, fished along southern Brazil and their 95% credibility intervals. (b) Exploitation rates considering a natural mortalities of 0.248 yr−1 (lower values) and 0.161 yr−1 (higher values). (c) Natural logarithms of relative frequencies at age per year classes in ten sampling periods between 1976 and 2019. |
 |
Fig. 13 Spawning potential ratio and their 95% confidence intervals of the Argentinian croaker Umbrina canosai from Southern Brazil considering a natural mortalities of 0.248 yr−1 (black) and 0.161 yr−1 (gray). |
4 Discussion
Identifying changes in the population structure and life history for fish stocks for which long time sampling series are available are important information to support its management (e.g. Bianchi et al., 2000; Sharpe and Hendry, 2009; Audzijonyte et al., 2013, 2016). Decades of intense fishing of the Argentinian croaker in the southern range of its distribution resulted in increased individual growth; decreased size and age at first maturity; truncation of length and age structure; drastic increase in the total mortality and exploration rate; and a large decrease of the spawning potential ratio, raising an alert to the need of decreasing fishing mortality for the stock. Following, we discuss the reasons that led to these population dynamics changes in the southern stock of Umbrina canosai, as well as the consequences of these processes for the stock resilience.
4.1 Changes in growth and maturity
Growth and maturation are highly plastic traits with rapid responses to changes in fishing selectivity, food availability, and intra- and interspecific competition (Enberg et al., 2012; Morrongiello and Thresher, 2015; Audzijonyte et al., 2016), as well as climatic changes (Baudron et al., 2014). Based in the well-documented long term data series of the stock of U. canosai, we postulate that the increased growth was affected mainly by the density-dependent processes. In contrast, the decreased size and age at first maturation were determined by both density-dependent processes and the fishery selectivity.
Processes at the population level can be influenced by the physical environment and therefore affected by climate changes. The southwest Atlantic Ocean is one of the largest and fast-warming regions in the global ocean with well-documented sea surface temperatures changes in the last decades (Hobday and Pecl, 2014; Gianelli et al., 2019; Franco et al., 2020). Although climatic change impacts on marine species have been rarely documented in the Southwest Atlantic Ocean (Bertrand et al., 2018) a recent study by Baudrom et al. (2014) on the growth of fishes in the North Sea, associated increases in water temperature to a decrease of the body size of several species. These authors attributed this change in growth to an adaptation to reduce the risk of oxygen deprivation. If a similar process affected the southern stock of U. canosai, it was dwarfed by the opposite trend of growth increase observed over the last four decades. Therefore, we attributed the changes in growth to the density-dependent processes triggered by the intense fishery.
Intense industrial fishing along decades in the southwestern Atlantic decreased the abundance of U. canosai and the abundance of the whole demersal fish community in the continental shelf (Haimovici, 1998; Vooren and Klippel, 2005; Haimovici and Cardoso, 2017). Consequently, the overall reduction in the density of the demersal fish community led to the reduction of the competition for benthic prey, which may have increased the food availability for some sciaenid species in the region (Cardoso and Haimovici, 2016). Furthermore, there are pieces of evidence that highly disturbed sea beds by bottom trawling, like the continental shelf bottom (Haimovici et al., 1989), may benefit small benthic infauna and epifauna species by increasing their abundance (Hiddink et al., 2008; Van Denderen et al., 2015). In fact, with higher energy available, increased individual growth has been observed for some species (Haimovici and Cardoso, 2017). An increase in individual growth was observed for the weakfishes, Cynoscion striatus (Miranda and Haimovici, 2007) and Cynoscion jamaicensis (Alves et al., 2020), that feed both on nektonic and benthic preys (Martins and Haimovici, 2020). However, species that feed mainly on epibenthic preys, such as whitemouth croaker, Micropogonias furnieri (Sánchez et al., 1991; Martins and Haimovici, 2020), and the king weakfish, Macrodon atricauda (Cardoso and Haimovici, 2016), have shown larger increases in individual growth in recent decades (Cardoso and Haimovici, 2011; Haimovici et al., 2021). As well as these species, U. canosai, which feeds mostly on benthic and epibenthic prey (Haimovici et al., 1989; Martins and Haimovici, 2020), showed a high increase in individual growth (Figs. 5 and 6). Along the sampled periods, the length and weight-at-age of U. canosai increased gradually, around 30–40% along the last four decades (Fig. 5). Thus, it was concluded that the positive change in the size of U. cansoai occurred as a density-dependent response to intra- and interspecific competition caused by the overall decrease of the biomass of demersal fishes along southern Brazil.
The changes in the growth of U. canosai were due to the large increase in asymptotic length (TL∞ ) and not by changes in the instantaneous growth coefficient (k), which did not show an increasing trend (Tab. 2). Although there is no consensus on how density-dependent processes might affect life-history parameters (Audzijonyte et al., 2016), in the evolutionary and physiological interpretation of the von Bertalanffy growth model presented by Charnov et al. (2013), TL∞ is determined by both food availability and or changes in maintenance and reproduction. In contrast, k is affected only by the allocation to maintenance and reproduction (Charnov et al., 2013). According to this formulation, increased food availability is expected to increase TL∞ , but should not change k. Therefore, the increased availability of benthic prey may result in a larger TL∞ and lead to a greater accumulation of energy, which, in turn, allows for an advanced acquisition of the minimum energy necessary to reach sexual maturity (Rowe et al., 1991; Reynolds, 2003). In other words, fishes that grow faster reach maturity at earlier ages due to higher energy availability.
Besides the age, the size at first maturity of U. canosai also decreased between 1976–84 and 2011–18 (Fig. 9; Tab. 4). It is widely accepted that intense fishing may create a selective pressure toward low age and small size at maturation by removing the genotypes of the fastest-growing fishes and delayed maturation from the population (Law, 2000; Heino and Godø, 2002; Dieckmann and Heino, 2007). Ernande et al. (2004) demonstrated that, when the minimum harvest size is below the maturation reaction norm, modeled populations presented evolutionary effects of decreasing age and size at maturation. This is probably the case with U. canosai, since its recruitment to the mesh size in the codend of the trawl nets used along southern Brazil begins at approximately 150 mm TL and is substantial under 200 mm TL (Vooren, 1983, Cardoso et al., 2021). Thus, the minimum harvest size of U. canosai was always below the maturation reaction norm, and the selection pressure applied by fishing can have produced a response toward decreasing age and size of maturation. Since fishery may also influence age and size at maturation by decreasing the population density, the observed reduction in length and age at maturity of U. canosai could result from both density-dependent processes and selective pressure from fisheries.
4.2 Changes in size, age, and sex structure
Intense fishing drastically reduced the frequency of larger and older fishes in the landings, except for a recent and illegal mid-water trawls fishery, resulting in a drastic truncation in the size and age composition of the stock (Fig. 11; Haimovici and Cardoso, 2016). Other sciaenid fishes that also underwent long and intense exploration in the region presented losses of the larger and older individuals as Cynoscion guatucupa (Miranda and Haimovici, 2007), Macrodon atricauda (Cardoso and Haimovici, 2015) and Micropogonias furnieri (Haimovici et al., 2021). The removal of bigger and older fish from populations has been recognized as a direct result of fishing that may reduce the resilience of the stock (Trippel et al., 1997; Beamish et al., 2006) by reducing their lifetime reproductive potential (Stewart, 2011).
In addition, bigger and older individuals, such as the BOFFFs (big old fat fecund females), contributes disproportionally to the overall fecundity of the stocks and offspring viability, as producing more and larger eggs with higher amounts of yolk, resulting in faster-growing larvae and higher survivability (Trippel, 1999; Marteinsdottir and Begg, 2002; Palumbi, 2004; Hixon et al., 2014). Umbrina canosai can probably be included among these BOFFF species, as the gonadosomatic index increases with the length, weight, and age (Fig. 8), as shown by the GLM analysis (Tab. 3). Therefore, the size and age-class truncation probably lead to a reduction in the proportion of BOFFFs, reducing resilience and hindering recovery of the U. canosai southern stock.
Furthermore, the sex ratios shifted from females' overall dominance to males dominance between the first (1976–1984) and last (2011–2019) sampling periods, but mostly among specimens younger than six years, that from the bulk of the catches in recent years (Fig. 10). This may be due to differences in growth, with females being relatively larger than males along all sampling periods, thus reaching the recruitment size earlier. If factors that affect the probability of being caught by fisheries, such as growth, differ between sexes, then exploitation will produce changes in the sex ratio that can affect reproductive success negatively by reducing the probability of encountering potential mates or by reducing fertilization success (Rowe and Hutchings, 2003). Thus, the changes observed for size, age, and sexual structure suffered by the intense exploitation of U. canosai over the last four decades are acting negatively for the recovery of the stock.
4.3 Changes in mortality, exploitation rate, and spawning potential ratio
An increase in mortality, decrease in SPR, and the changes in the age frequencies of the U. canosai southern stock have consisted of three stages since the first sampling period (Figs. 12 and 13). In the first stage, mortality increased, and SPR decreased steadily up to the early 1980 s, however, fish above twenty years old were still present in the landings. In the second stage (1980 s to 1990 s), the mortality and SPR remained stable with little variation, but there was a decrease in the frequency of older individuals and the almost disappearance of fish older than 16 years in the landing (Fig. 12c). In the third stage, from 1997 to the late 2010 s, mortality increased sharply to reach over 0.86 in the last two periods, SPR decreased sharply to only 5% to 10%, and the frequency of older individuals continued to decrease, with few reaching over 13 years. This increased mortality, abrupt reduction in both the SPR and older individuals of U. canosai has been an indicator of the potential economic collapse of the stock.
These changes need to be considered in the context of the life-history theory (Hutchings, 2002; Roff, 2002). The apparent stability from the early 1980 s to the late 1990 s might be the result of a combination of life-history traits and fishery characteristics that favor resilience and recovery (Reynolds, 2003; Reynolds et al., 2001; Cardoso and Haimovici, 2015; Haimovici et al., 2021), such as: high fecundity (Haimovici and Cousin, 1989) and extended spawning season; flexible and low age at maturity; flexible and rapid individual growth; and a relatively short lifespan (this study). However, after more than 30 years of high exploitation rates (>0.5, Fig. 12b), there is evidence that U. canosai could be reaching its adaptive capacity for resilience. For example, U. canosai has not increased its growth rates over the past decade (Tab. 6), lost up to 90% of its reproductive output (Fig. 13), the sex reason shifted to fewer females (Fig. 10), and the size and age structure were reduced (Fig. 11), probably leading to a drastic decrease of BOFFFs (see Sect. 4.2). Other factors, such as the introduction of mid-water trawl fishery, a new technique that drastically increased the fishing power, catching schools of maturing and spawning females (Haimovici and Cardoso, 2016), may also have contributed to the reduction in the resilience of U. canosai in the late 2000 s. Therefore, even with a life history that favors resilience, the persistence of SPR reductions, high mortality, and exploitation rates might endanger the long-term productivity of the population.
4.4 Concluding remarks
Intense fishing for several decades led to important changes in population structure and dynamics of the southern stock of U. canosai including increased growth and anticipated maturity. The large increase in the mortality and exploitation rate resulted in a drastic decrease of the stock's reproductive potential due to the intense fishing.
Despite the anticipation in the sexual maturation and an increase in individual growth, which may favor resilience, the intense and prolonged fishing has led to both changes in the sex ratio, increasing the male's frequency, and to a marked truncation of length and age structure with the loss of most of the larger and older fish, decreasing the reproductive potential of the stock, consequently hindering stock recovery. Thus, both the extremely high exploitation rate and the very low spawning potential ratio indicate the urgent need for a drastic reduction of fishing mortality to avoid the economic collapse of the fishery. However, in order to take adequate management, it is necessary to carry out the stock assessment to define desirable states for a fishery in terms of target reference points and/or limit reference points, that define a state that it is deemed the stock should be managed (Haddon, 2011).
Estimates resulting from stock assessments that do not consider possible changes in stock structure and life history, such as those observed in this study, can provide a false sense of accuracy as an essential source of uncertainty may be hidden (Kuparinen et al., 2012; Evans et al., 2013). In this context, model misspecifications can lead to several problems for stock assessment, and hence the provision of management advice (Punt et al., 2021). For example, misspecification of growth can overestimate the current biomass relative to the unfished biomass (stock depletion), but this bias may be mitigated or eliminated if the assessment model includes growth variation (Stawitz et al., 2019). Therefore, for future assessments of the southern stock of U. canosai, we strongly suggest to take into account the changes in the population structure and life history parameters to increase the accuracy of the estimates of stock status and reference points for the proper management of the resource. Unfortunately, any management measures designed to reduce fishing mortality will impact the near-term future catches, but, as in all overfishing cases, the long-term survival of a fishery depends on management. This goal is not easy to achieve as it requires a consensus of the users and administrators and an increase in fishing regulations' enforcement capacity.
Acknowledgements
The authors thank the Federal University of Rio Grande − FURG that provided continuous support, and the technicians and students who made possible the samplings and processing of the data along the years required in this long-term study. M.H. is research fellow (307994/2020-1) from the Brazilian National Scientific and Technological Research Council (CNPq) and E.K. received a scholarship (88887.511638/2020-00) from the Coordination for the Improvement of Higher Education Personnel (CAPES), Brazil. This work received support of the project “Scientific Subsidies for Spatial Management and with an Ecosystem Focus on Demersal Fisheries in the South and Southeast regions of Brazil MEEE – PDSES process no. 445782/2015-3.
References
- Alves AV, Haimovici M, Cardoso LG. 2020. Long-term changes in the life history of the Jamaican weakfish, Cynoscion jamaicensis (Vaillant and Bocourt, 1883), in southern Brazil. Reg Stud Mar Sci 783, 2020: 101063. [Google Scholar]
- Audzijonyte A, Kuparinen A. 2016. The role of life histories and trophic interactions in population recovery. Conserv Biol 30: 734–743. [CrossRef] [PubMed] [Google Scholar]
- Audzijonyte A, Kuparinen A, Fulton EA. 2013. How fast is fisheries-induced evolution Quantitative analysis of modelling and empirical studies. Evol Appl 6: 585–595. [CrossRef] [PubMed] [Google Scholar]
- Audzijonyte A, Fulton E, Haddon M, Helidoniotis F, Hobday AJ, Kuparinen A, Morrongiello J, Smith A, Upston J, Waples R. 2016. Trends and management implications of human-influenced life-history changes in marine ectotherms. Fish Fish 17: 1005–1028. [CrossRef] [Google Scholar]
- Baudron AR, Needle CL, Rijnsdorp AD, Tara Marshall C. 2014. Warming temperatures and smaller body sizes: synchronous changes in growth of North Sea fishes. Glob Chang Biol 20: 1023–1031. [CrossRef] [PubMed] [Google Scholar]
- Beamish RJ, McFarlane GA, Benson A. 2006. Longevity overfishing. Prog Oceanog 68: 289–302. [CrossRef] [Google Scholar]
- Bertrand A, Vögler R, Defeo O. 2018. Climate change impacts, vulnerabilities and adaptations: Southwest Atlantic and Southeast Pacific marine fisheries. In: Barange M, Bahri T, Beveridge MCM, Cochrane KL, Funge-Smith S, Poulain F (Eds.), Impacts of climate change on fisheries and aquaculture: synthesis of current knowledge, adaptation and mitigation options. Rome: FAO Fisheries and Aquaculture Department pp. 325–346. [Google Scholar]
- Bianchi G, Gislason H, Graham K, Hill L, Jin X, Koranteng K, Manickchand-Heileman S, Payá I, Sainsbury K, Sanchez F, Zwanenburg K. 2000. Impact of fishing on size composition and diversity of demersal fish communities. ICES J Mar Sci 57: 558–571. [CrossRef] [Google Scholar]
- Canel D, Levy E, Soares IA, Braicovich PE, Haimovici M, Luque JL, Timi JT. 2019. Stocks and migrations of the demersal fish Umbrina canosai (Sciaenidae) endemic from the subtropical and temperate Southwestern Atlantic revealed by its parasites. Fish Res 214: 10–18. [CrossRef] [Google Scholar]
- Cardoso LG, Haimovici M. 2011. Age and changes in growth of the king weakfish Macrodon atricauda (Günther, 1880) between 1977 and 2009 in the southern Brazil. Fish Res 111: 177–187. [CrossRef] [Google Scholar]
- Cardoso LG, Haimovici M. 2014. Long term changes in the sexual maturity and in the reproductive biomass of the king weakfish Macrodon atricauda (Günther, 1880) in southern Brazil. Fish Res 160: 120–128. [CrossRef] [Google Scholar]
- Cardoso LG, Haimovici M. 2015. Long-term changes in the age structure, mortality and biomass of the king weakfish Macrodon atricauda (Günther, 1880) in southern Brazil: is it resilient enough to avoid collapse? Fish Res 167: 174–179. [CrossRef] [Google Scholar]
- Cardoso LG, Haimovici M. 2016. Density‐dependent changes in the feeding behaviour of Macrodon atricauda of southern Brazil. J Fish Biol 89: 1002–1008. [CrossRef] [PubMed] [Google Scholar]
- Cardoso LG, da Silveira Monteiro D, Haimovici M. 2021. An assessment of discarded catches from the bottom pair trawling fishery in southern Brazil. MAFIS 34: 197–210. [Google Scholar]
- Charnov EL, Gislason H, Pope JG. 2013. Evolutionary assembly rules for fish life histories. Fish Fish 14: 213–224. [CrossRef] [Google Scholar]
- Cousseau MB, Perrotta R. 2013. Peces marinos de Argentina: biología, distribución, pesca. 4th Edition, Instituto Nacional de Investigación y Desarrollo Pesquero INIDEP, Mar de Plata, Argentina. [Google Scholar]
- Darimont CT, Carlson SM, Kinnison MT, Paquet PC, Reimchen TE, Wilmers CC. 2009. Human predators outpace other agents of trait change in the wild. Proc Natl Acad Sci U S A 106: 952–954. [CrossRef] [PubMed] [Google Scholar]
- Dieckmann U, Heino M. 2007. Probabilistic maturation reaction norms: their history, strengths, and limitations. Mar Ecol Prog Ser 335: 253–269. [CrossRef] [Google Scholar]
- Dureuil M, Froese R. 2021. A natural constant predicts survival to maximum age. Commun Biol 4: 1–6. [CrossRef] [PubMed] [Google Scholar]
- Enberg K, Jørgensen C, Dunlop ES, Varpe Ø, Boukal DS, Baulier L, Eliassen S, Heino M. 2012. Fishing-induced evolution of growth: concepts, mechanisms and the empirical evidence. Mar Ecol 33: 1–25. [CrossRef] [Google Scholar]
- Ernande B, Dieckmann U, Heino M. 2004. Adaptive changes in harvested populations: plasticity and evolution of age and size at maturation. Proc R Soc Lond B 271: 415–423. [CrossRef] [PubMed] [Google Scholar]
- Evans MR, Grimm V, Johst K, Knuuttila T, De Langhe R, Lessells CM, Merz M, O'Malley MA, Orzack SH, Weisberg M, Wilkinson DJ, Wolkenhauer O, Benton TG. 2013. Do simple models lead to generality in ecology? Trends Ecol Evol 28: 578–583. [CrossRef] [PubMed] [Google Scholar]
- FAO. 2020. The State of World Fisheries and Aquaculture 2020. Rome, Sustainability in action. [Google Scholar]
- Figueiredo JL, Santos AP, Yamaguti N, Bernardes RA, Rossi-Wongtschowski CLDB. 2002. Peixes da zona econômica exclusiva da região sudeste-sul do Brasil: Levantamento com rede de meia-água. São Paulo, Editora da Universidade de São Paulo. [Google Scholar]
- Franco BC, Combes V, González Carman V. 2020. Subsurface ocean warming hotspots and potential impacts on marine species: the southwest South Atlantic Ocean case study. Front Mar Sci 7: 563394. [CrossRef] [Google Scholar]
- Gianelli I, Ortega L, Marín Y, Piola A, Defeo O. 2019. Evidence of ocean warming in Uruguay's fisheries landings: The mean temperature of the catch approach. Mar Ecol Progr Ser 625: 115–125. [CrossRef] [Google Scholar]
- Gonzalez-Alberdi P, Nani A. 1967. Contribución al Conocimiento de la Biologia del Pargo Blanco Umbrina canosai, de la Región de Mar del Plata. Rio de Janeiro, FAO. Carpas Documento Técnico no. 10. [Google Scholar]
- Gutiérrez NL, Defeo O. 2013. Evaluación de recursos pesqueros de Uruguay mediante modelos dinámicos. Proyecto Gestión Pesquera en Uruguay. Montevideo, MGAP-DINARA − FAO. [Google Scholar]
- Haddon M. 2011. Modelling and Quantitative Methods in Fisheries. 2nd edn. New York: Chapman and Hall/CRC. [CrossRef] [Google Scholar]
- Haimovici M. 1987. Estratégia de amostragens de comprimentos de teleósteos demersais nos desembarques da pesca de arrasto no litoral sul do Brasil. Atlântica 9: 65–82. [Google Scholar]
- Haimovici M. 1998. Present state and perspectives for the Southern Brazil shelf demersal fisheries. Fish Manag Ecol 5: 277–289. [CrossRef] [Google Scholar]
- Haimovici M, Cardoso LG. 2016. Colapso do estoque de Umbrina canosai do Sul do Brasil devido à introdução do arrasto-de-meia-água. Bol Inst Pesca 42: 258–267. [CrossRef] [Google Scholar]
- Haimovici M, Cardoso LG. 2017. Long-term changes in the fisheries in the Patos Lagoon estuary and adjacent coastal waters in Southern Brazil. Mar Biol Res 13: 135–150. [CrossRef] [Google Scholar]
- Haimovici M, Cousin JCB. 1989. Reproductive biology of the castanha Umbrina canosai (Pisces, Scianidae) in southern Brazil. Rev Bras Biol 49: 523–537. [Google Scholar]
- Haimovici M, Mendonça JT. 1996. Análise da pesca de arrasto de tangones de peixes e camarões no sul do Brasil. Atlântica 18: 143–160. [Google Scholar]
- Haimovici M, Palacios Maceira R. 1981. Observações sobre a seleção a bordo e rejeição na pesca de arrasto de fundo no Rio Grande do Sul. Anais do Segundo Congresso Brasileiro de Engenharia de Pesca . Recife julho de l98l: 401–411. [Google Scholar]
- Haimovici M, Reis EG. 1984. Determinação de idade e crescimento da castanha Umbrina canosai (Pisces, Sciaenidae) do sul do Brasil. Atlântica 7: 25–46. [Google Scholar]
- Haimovici M, Martins AS, Vieira PC. 1996. Distribuição e abundância de teleósteos demersais sobre a plataforma continental do sul do Brasil. Rev Bras Biol 56: 27–50. [Google Scholar]
- Haimovici M, Teixeira RL, Arruda MC. 1989. Alimentação da castanha Umbrina canosai (Pisces: Sciaenidae) no sul do Brasil. Rev Bras Biol 49: 511–522. [Google Scholar]
- Haimovici M, Pereira S, Castelli Vieira P. 1989. La pesca demersal en el sur de Brasil en el periodo l975-l985. Frente Marít. 5: 151–163. [Google Scholar]
- Haimovici M, Absalonsen L, Velasco G, Miranda LV. 2006. Diagnóstico do estoque e orientações para o ordenamento da pesca de Umbrina canosai (Berg, 1895) In: Rossi-Wongtschowski CLDB, Ávila-da-Silva AO, Cergole MC (Eds.), Análise das Principais Pescarias Comerciais da Região Sudeste-Sul do Brasil: Dinâmica Populacional das Espécies em Explotação − II. São Paulo, USP pp. 77–85. [Google Scholar]
- Haimovici M, Cavole LM, Cope JM, Cardoso LG. 2021. Long-term changes in population dynamics and life history contribute to explain the resilience of a stock of Micropogonias furnieri (Sciaenidae, Teleostei) in the SW Atlantic. Fish Res 237: 105878. [CrossRef] [Google Scholar]
- Heino M, Godø OR. 2002. Fisheries-induced selection pressures in the context of sustainable fisheries. Bull Mar Sci 70: 639–656. [Google Scholar]
- Hiddink JG, Rijnsdorp AD, Piet G. 2008. Can bottom trawling disturbance increase food production for a commercial fish species? Can J Fish Aquat Sci 65: 1393–1401. [CrossRef] [Google Scholar]
- Hixon MA, Johnson DW, Sogard SM. 2014. BOFFFFs: on the importance of conserving old-growth age structure in fishery populations. ICES J Mar Sci 71: 2171–2185. [CrossRef] [Google Scholar]
- Hobday AJ, Pecl GT. 2014. Identification of global marine hotspots: sentinels for change and vanguards for adaptation action. Rev Fish Biol Fish 24: 415–425. [CrossRef] [Google Scholar]
- Hordyk AR, Ono K, Valencia SR, Loneragan NR, Prince JD. 2015. A novel length-based empirical estimation method of spawning potential ratio (SPR), and tests of its performance, for small-scale, data-poor fisheries. ICES J Mar Sci 72: 217–231. [Google Scholar]
- Hutchings JA. 2002. Life histories of fish. In: Hart PJB, Reynolds JD (Eds.), Handbook of Fish and Fisheries. UK: Blackwell, Oxford, pp. 149–174. [CrossRef] [Google Scholar]
- Hutchings JA, Jones MEB. 1998. Life history variation and growth rate thresholds for maturity in Atlantic salmon, Salmo salar. Can J Fish Aquat Sci 55: 22–47. [Google Scholar]
- Keith DM, Hutchings JA. 2012. Population dynamics of marine fishes at low abundance. Can J Fish Aquat Sci 69: 1150–1163. [CrossRef] [Google Scholar]
- Kellner K. 2019. jagsUI: A Wrapper Around ‘rjags' to Streamline ‘JAGS' Analyses. R package version 1.5.1. Available at https://CRAN.R-project.org/package=jagsUI [Google Scholar]
- Kikuchi E, Cardoso LG, Canel D, Timi JT, Haimovici M. 2021. Using growth rates and otolith shape to identify the population structure of Umbrina canosai (Sciaenidae) from the Southwestern Atlantic. Mar Biol Res 17: 272–285. [CrossRef] [Google Scholar]
- Kinas PG, Andrade HÁ. 2010. Introdução à Análise Bayesiana (com R). Porto Alegre, Editora Mais Que Nada. [Google Scholar]
- Kuparinen A, Mantyniemi S, Hutchings JA, Kuikka S. 2012. Increasing biological realism of fisheries stock assessment: towards hierarchical Bayesian methods. Environ Rev 20: 135–151. [CrossRef] [Google Scholar]
- Law R. 2000. Fishing selection and phenotypic evolution. ICES J Mar Sci 57: 659–668. [CrossRef] [Google Scholar]
- Le-Cren ED. 1951. The length-weight relationship and seasonal cycle in gonadal weight and condition in the perch (Perca fluviatilis ). J Anim Ecol 20: 201–219. [CrossRef] [Google Scholar]
- Longhurst AR. 2010. Mismanagement of Marine Fisheries. Cambridge: Cambridge University Press. [CrossRef] [Google Scholar]
- Longhurst AR, Pauly D. 1987. Ecology of Tropical Oceans. New York, Academic Press. [Google Scholar]
- Lowe-McConnell RH. 1987. Ecological studies in tropical fish communities. Cambridge: Cambridge University Press. [CrossRef] [Google Scholar]
- Marteinsdottir G, Begg GA. 2002. Essential relationships incorporating the influence of age, size and condition on variables required for estimation of reproductive potential in Atlantic cod Gadus morhua . Mar Ecol Prog Ser 235: 235–256. [CrossRef] [Google Scholar]
- Martins AS, Haimovici M. 2017. Seasonal mesoscale shifts of demersal nekton assemblages in the subtropical South-western Atlantic. Mar Biol Res 13: 88–97. [CrossRef] [Google Scholar]
- Martins AS, Haimovici M. 2020. Key prey indicates high resilience on marine soft bottom habitats. Mar Environ Res 159: 104963. [CrossRef] [PubMed] [Google Scholar]
- Machado DV. 2021. Diversidade genética e estrutura populacional da castanha (Umbrina canosai) no Atlântico Sudoeste, inferida por microssatélites [Masters thesis]. Instituto de Oceanografia, Universidade Federal do Rio Grande − FURG. [Google Scholar]
- Militelli MI, Macchi GJ, Rodrigues KA. 2013. Comparative reproductive biology of Sciaenidae family species in the Rio de la Plata and Buenos Aires Coastal Zone, Argentina. J Mar Biolog Assoc 93: 413–423. [CrossRef] [Google Scholar]
- Miranda LV, Haimovici M. 2007. Changes in the population structure, growth and mortality of stripped weakfish Cynoscion guatucupa (Sciaenidae, Teleostei) of Southern Brazil between 1976 and 2002. Hydrobiologia 589: 69–78. [CrossRef] [Google Scholar]
- Morrongiello JR, Thresher RE. 2015. A statistical framework to explore ontogenetic growth variation among individuals and populations: a marine fish example. Ecol Monogr 85: 93–115. [CrossRef] [Google Scholar]
- Palumbi SR. 2004. Why mothers matter. Nature 430: 621–622. [CrossRef] [PubMed] [Google Scholar]
- Pauly D, Zeller D. 2017. Comments on FAOs state of world fisheries and aquaculture (SOFIA 2016). Mar Policy 77: 176–181. [CrossRef] [Google Scholar]
- Punt AE, Castillo-Jordán C, Hamel OS, Cope JM, Maunder MN, Ianelli JN. 2021. Consequences of error in natural mortality and its estimation in stock assessment models. Fish Res 233: 105759. [CrossRef] [Google Scholar]
- R Core Team. 2019. R: A language and environment for statistical computing. R Foundation for Statistical Computing, Vienna, Austria. Available at https://www.R-project.org/. [Google Scholar]
- Reynolds JD. 2003. Life histories and extinction risk. In: Blackburn TM, Gaston JK (Eds.), Macroecology. UK: Blackwell, Oxford, pp. 195–217. [Google Scholar]
- Reynolds JD, Mace GM, Redford KH, Robinson JG. (Eds.). 2001. Conservation of Exploited Species. Cambridge: Cambridge University Press. [Google Scholar]
- Ricker WE. 1975. Computation and interpretation of biological statistics of fish populations. Ottawa: Department of the environment fisheries and marine service, Bulletin 191. [Google Scholar]
- Roff DA. 2002. Life History Evolution. Sunderland: Sinauer Associates Inc. [Google Scholar]
- Rowe S, Hutchings JA. 2003. Mating systems and the conservation of commercially exploited marine fish. Trends Ecol Evol 18: 567–572. [CrossRef] [Google Scholar]
- Rowe DK, Thorpe JE, Shanks AM. 1991. Role of fat stores in the maturation of male Atlantic salmon (Salmo salar) Parr. Can J Fish Aquat Sci 48: 405–413. [CrossRef] [Google Scholar]
- Ruarte C, Lasta C, Carozza C. 2004. Pescadilla de red (Cynoscion guatucupa). In: Sanchez RP, Bezzi I, Boschi EE (Eds.), El mar argentino y sus recursos pesqueros. Tomo 4. Los peces marinos de interes pesquero. Caracterizacion biologica y evaluacion del estado de explotacion. Mar del Plata, Publicaciones especiales. INIDEP pp. 271–281. [Google Scholar]
- Saborido-Rey F, Trippel EA. 2013. Fish reproduction and fisheries. Fish Res 138: 1–4. [CrossRef] [Google Scholar]
- Sánchez MF, Mari N, Lasta CA, Giangiobbe A. 1991. Alimentación de la corvina rubia (Micropogonias furnieri) en la Bahía Samborombón. Fren Mar 8: 43–50. [Google Scholar]
- Sharpe DMT, Hendry AP. 2009. Life history change in commercially exploited fish stocks: an analysis of trends across studies. Evol Appl 2: 260–275. [CrossRef] [PubMed] [Google Scholar]
- Stawitz CC, Haltuch MA, Johnson KF. 2019. How does growth misspecification affect management advice derived from an integrated fisheries stock assessment model? Fish Res 213: 12–21. [CrossRef] [Google Scholar]
- Stewart J. 2011. Evidence of age-class truncation in some exploited marine fish populations in New South Wales, Australia. Fish Res 108: 209–213. [CrossRef] [Google Scholar]
- Sturtz S, Ligges U, Gelman A. 2005. R2WinBUGS: A package for running WinBUGS from R. J Stat Softw 12: 1–16. [CrossRef] [Google Scholar]
- Then AY, Hoenig JM, Hall NG, Hewitt DA. 2015. Evaluating the predictive performance of empirical estimators of natural mortality rate using information on over 200 fish species. ICES J Mar Sci 72: 82–92. [CrossRef] [Google Scholar]
- Thomas A, O'Hara B, Ligges U, Sturtz S. 2006. Making BUGS Open. R News 6: 12–17. [Google Scholar]
- Trippel EA. 1999. Estimation of stock reproductive potential: history and challenges for Canadian Atlantic gadoid stock assessments. J Northwest Atl Fish Sc 25: 61–81. [CrossRef] [Google Scholar]
- Trippel EA, Kjesbu OS, Solemdal P. 1997. Effects of adult age and size structure on reproductive output in marine fishes. In: Chambers RC, Tripple EA (Eds.), Early Life History and Recruitment in Fish Populations. London: Chapman and Hall, pp. 31–62. [CrossRef] [Google Scholar]
- Van Denderen PD, Bolam SG, Hiddink JG, Jennings S, Kenny A, Rijnsdorp AD, Van Kooten T. 2015. Similar effects of bottom trawling and natural disturbance on composition and function of benthic communities across habitats. Mar Ecol Prog Ser 541: 31–43. [CrossRef] [Google Scholar]
- Vasconcellos M, Haimovici M, Ramos K. 2014. Pesca de emalhe demersal no sul do Brasil: evolução, conflitos e (des)ordenamento. In: Haimovici M, Andriguetto JM, Sunye PS. (Eds.), A Pesca Marinha e Estuarina no Brasil: Estudos de Caso. Rio Grande, Editora da FURG, pp 29–40. [Google Scholar]
- Venables WN, Ripley BD. 2002. Modern Applied Statistics with S, 4th edn. New York: Springer. [CrossRef] [Google Scholar]
- Vooren CM. 1983. Seleção pela malha na pesca de arrasto da Castanha Umbrina canosai, Pescada Cynoscion striatus e Pescadinha Macrodon ancylodon no Rio grande do Sul. Rio Grande, Documentos Técnicos de Oceanografia. [Google Scholar]
- Vooren CM, Klippel S. 2005. Ações para Conservação de Tubarões e Raias no Sul do Brasil. Porto Alegre, Igaré. [Google Scholar]
- Wootton RJ. 1998. Ecology of Teleost Fishes, 2nd edn. Dordrecht: Kluver Academic Publishers. [Google Scholar]
- Yesaki M, Bager KJ. 1975. Histórico da evolução da pesca industrial em Rio Grande. Rio Grande: Série Documentos Técnicos SUDEPE/PDP n° 11. [Google Scholar]
- Zar JH. 1999. Biostatistical Analysis, 4th edn. Upper Saddle River: Prentice Hall. [Google Scholar]
Cite this article as: Haimovici M, Kikuchi E, Cardoso LG. 2022. Changes in the population structure and life history associated with long-term intense fishing of the Argentinian croaker Umbrina canosai in southern Brazil. Aquat. Living Resour. 35: 12
All Tables
Number of Umbrina canosai sampled along southern Brazil for the analysis of its life-history and population structure.
Von Bertalanffy's growth parameters and their 95% credible intervals for females, males and pooled sex of Umbrina canosai from southern Brazil sampled in different sampling periods between 1976 and 2019.
Generalized Linear Models results for the relationship between gonadosomatic index (GSI) and the different sampling periods (1976-84 and 2011-18) and populational variables (length, age and weight) of sexually mature females of Umbrina canosai. Estimates and statistical significance of the fixed factors are shown for each variable. The AIC (Akaike's information criterion) are shown in the last column.
Logistic model parameters (β1 and β0 ), the calculated length and age at first maturity (L50 mm; A50 yr) and the length and age at which 95% of the specimens were mature (L95 mm; A95 yr) for Umbrina canosai landed in Rio Grande in two time periods: 1976-1984 and 2011-2018. All parameters and indices are presented as the mean of their posterior distributions and the 2.5 % (Cr I 2.5%) and 97.5% (Cr I 97.5%) credibility intervals.
Percentages of females in 30 mm TL interval classes and age of Umbrina canosai in the landings of commercial fishing along Southern Brazil landed in 1976-1984 and 2011-2018. χ2 and P(χ2, 95%) are the scores of 2 × 2 contingency tables to test the differences between periods and the corresponding 95% probabilities. *indicate significant differences.
All Figures
|
Fig. 1 Stocks distribution range and sampling area of Umbrina canosai along southern Brazil. |
| In the text | |
|
Fig. 2 Recorded landings of the Argentine croaker Umbrina canosai along all its distribution range from 1959 to 2019 (along the last six decade). |
| In the text | |
|
Fig. 3 Relative monthly frequency of opaque (black columns) and translucent (grey columns) borders (edges) of the sectioned otoliths of Umbrina canosai sampled in southern Brazil (n = 19,916). |
| In the text | |
|
Fig. 4 Relationship between the gonadosomatic indices and macroscopic maturity stages for males (n = 5971) and females (n = 6900) Umbrina canosai from southern Brazil. Vertical bars represent 95% confidence intervals of GSI. |
| In the text | |
|
Fig. 5 Mean total length (left) and weight at age (right) by age classes of the Umbrina canosai along ten sampling periods from Southern Brazil. |
| In the text | |
|
Fig. 6 Von Bertalanffy's growth curves for males and females of Umbrina canosai from southern Brazil sampled in different time periods between 1976 and 2019. |
| In the text | |
|
Fig. 7 Monthly mean gonadosomatic indices and condition factors of Umbrina canosai in southern Brazil sampled between 1976 and 2019 in three total length strata: 180–269 mm in blue, 270–359 mm in orange and over 360 mm in green. Vertical bars represent 95% confidence intervals. |
| In the text | |
|
Fig. 8 Mean gonadosomatic index by total length, weight and age of sexually mature females of Umbrina canosai captured in the spawning season along Southern Brazil in 1976–1984 (in black) and 2011–2018 (in gray) periods. Vertical bars represent the 95% confidence intervals. |
| In the text | |
|
Fig. 9 Maturity-at-length (left) and maturity-at-age (right) ogives and corresponding probability densities fitted to data from 1976–1984 (dashed line) and 2011–2018 (full line) of females (upper panels) and males (lower panels) of Umbrina canosai sampled in southern Brazil. |
| In the text | |
|
Fig. 10 Percentage of females of Umbrina canosai larger than 180 mm TL in 30 mm TL interval classes (left) and in age classes (right) in the landings of commercial fishing along Southern Brazil in 1976–1984 (in black) and 2011–2018 (in gray). Vertical bars represent the 95% confidence intervals. |
| In the text | |
|
Fig. 11 Relative frequency percentage of total length, in 30 mm bins and age for Umrbrina canosai along southern Brazil in the landings of pair trawl, otter trawl and gillnet industrial fisheries along Southern Brazil in ten sampling periods between 1976 and 2019. |
| In the text | |
|
Fig. 12 (a) Instantaneous total mortality coefficients (Z) of Umrbrina canosai aged 3 to 10 yr, fished along southern Brazil and their 95% credibility intervals. (b) Exploitation rates considering a natural mortalities of 0.248 yr−1 (lower values) and 0.161 yr−1 (higher values). (c) Natural logarithms of relative frequencies at age per year classes in ten sampling periods between 1976 and 2019. |
| In the text | |
|
Fig. 13 Spawning potential ratio and their 95% confidence intervals of the Argentinian croaker Umbrina canosai from Southern Brazil considering a natural mortalities of 0.248 yr−1 (black) and 0.161 yr−1 (gray). |
| In the text | |
Current usage metrics show cumulative count of Article Views (full-text article views including HTML views, PDF and ePub downloads, according to the available data) and Abstracts Views on Vision4Press platform.
Data correspond to usage on the plateform after 2015. The current usage metrics is available 48-96 hours after online publication and is updated daily on week days.
Initial download of the metrics may take a while.