| Issue |
Aquat. Living Resour.
Volume 33, 2020
|
|
|---|---|---|
| Article Number | 11 | |
| Number of page(s) | 9 | |
| DOI | https://doi.org/10.1051/alr/2020012 | |
| Published online | 22 September 2020 | |
Research Article
A case study for application of DNA barcoding in identifying species and genetic diversity of fish from the Suez city market, Egypt★
1
Zoology Department, Faculty of Science, Al-Azhar University, Cairo Branch, Egypt
2
Molecular Biology and Biotechnology Laboratory, Department of Zoology, Faculty of Science, Menoufia University, 32511 Shebin El-Kom, Menoufia, Egypt
3
Zoology Department, Faculty of Science, Al-Azhar University, Assiut Branch, Egypt
* Corresponding author: This email address is being protected from spambots. You need JavaScript enabled to view it.
Handling Editor: Carlos Saavedra
Received:
23
May
2020
Accepted:
31
August
2020
Abstract
The Red Sea is one of the key areas of biodiversity in the world. It is a hotspot for speciation and biological invasions. In the current work, a pilot, random sampling trial was carried out to characterize some species in the landings reaching the fish market in Suez city, which is one of the largest fish markets in the Northern Red Sea. Samples of different fish species were subjected to the standard procedures of DNA barcoding, applying the sequencing of the cytochrome oxidase subunit 1 mitochondrial gene (COI). DNA barcoding could successfully identify all the targeted fishes to the species-level (>98%). The results exhibited a taxonomically-versatile commercial trends in this market, being the collected species belonging to 7 different fish families and 3 orders. These species were Coris aygula, Papilloculiceps longiceps, Priacanthus sagittarious, Gerres longirostris, Alepes djedaba, Psettodes erumei Cheilinus trilobatus, Calotomus viridescens, and Pardachirus marmoratus. Haplotype diversities in the first six species were moderate. However, their nucleotide diversities were low. This may have resulted from fishing from bottlenecked populations, or from areas that do not hinder the genetic flow. Also, possible cryptic speciation could be detected in P. sagittarius, P. erumei and G. longirostris. Applying the DNA barcoding for species identification in Suez city fish market could then detect various aspects of fish species diversity. More works using the applied analyses can be strongly recommended to aid proper conservation and management of economic fisheries in the Red Sea.
Key words: DNA barcoding / fish market / genetic diversity / molecular authentication / Suez
Data are available in SEANOE repository under the DOI: https://doi.org/10.17882/76103
© EDP Sciences 2020
1 Introduction
The Red Sea is considered an extension for the northwestern Indian Ocean, with Bab el Mandeb strait forming the major historical connection between the two water bodies. Its two northern branches, the relatively shallow Gulf of Suez and the deep Gulf of Aqaba, have received special attention regarding species biodiversity and biological invasions. The Red Sea is part of the Great Rift Valley; with about 2200 km in length, 355 km in width (at its widest point), and 438,000 km2 in surface area (Eschmeyer et al., 2010). The Red Sea is blessed with an incredible natural beauty of biological diversity. Coral reefs, mangrove forests, seagrass beds, salt marshes and saltpans are distributed throughout the region. These unique habitats support a diverse range of marine life, including sea turtles, dugongs, dolphins, and many endemic fish species (Gray, 1997). The high diversity of Red Sea species is partially caused by its comparatively high coverage of coral reefs, with more than 16,000 km2 (Roberts et al., 2002). Around 320 scleractinian corals were reported there (Veron et al., 2009), besides 1166 fish species (Bogorodsky and Randall, 2019).
Economically, the Red Sea fisheries contribute actively to the sector of fisheries in Egypt, both for significant total catch and for the large number of economically beneficial species, for example the different species of groupers, snappers and emperors (Families Serranidae, Lutjanidae and Lethrinidae, respectively). Fisheries in the Red Sea are of considerable socio-economic importance as a source for national food security and income for rural communities (Sonnewald and El-Sherbiny, 2017). According to the FAO data (2010–2020), the Red Sea fisheries represented the second most abundant resources for fish landing in Egypt, contributing about 40% to the total marine production in the country. The Gulf of Suez providing 14.4% of this percentage. The Egyptian fleet in the Red Sea encomapassed 542 longline vessels, 846 vessels using trammel nets and other gears, 178 trawlers and 113 purse seine vessels. The average number of crew on each boat ranges between 5–45 persons according to the fishing gear used and the engine power of the boat (FAO 2010–2020). Hence, it appears clearly that the fisheries in this area provide work opportunities and key source of income for many families.
The Red Sea gains specific importance for two further points which are fundamentally related to biodiversity, that are the presence/spreading of invasive species, and the lack of adequate tools for markets control there. Marine biological invasions are representing a key topic in fisheries management. This is especially due to their direct relation with the changing global climates, besides the intensive anthropic economic activities (Hulme et al., 2008). Some of the very famous species that invaded the Mediterranean from the Red Sea included the variable mussel Brachidontes pharaonis (Sirna Terranova et al., 2006; Mohammed-Geba et al., 2016), the blue crab Portunus pelagicus (Corsini-Foka et al., 2004), the Rabbitfishes Siganus rivulatus and Siganus luridus (Hassan et al., 2003), the dusky sweeper Pempheris rhomboidea (Bariche et al., 2015). Fish markets surveillance in the Egyptian Red Sea are still lacking of modern tools. For the best of authorś knowledge, only two works were done in this field. The first was carried out by Galal-Khallaf et al. (2017) who applied single nucleotide polymorphisms and their subsequent restriction fragmentś length polymorphism analyses (SNP-RFLP and −TRFLP) to characterize major groupers-snapper-emperor species present in Hurghada city (Egypt, coordinates: 27.262444, 33.817340). The second was of Galal-Khallaf et al. (2019) who applied DNA barcodes and mitochondrial markers for analysis of grouper landed in Hurghada and Shalateen fishing ports (Shalatien City coordinates: 23.122681, 35.630547).
DNA barcoding, is a key diagnostic and taxonomic approach which promises fast, accurate and automated species identifications by focusing analysis on a short standardized segments of the genome (Hebert et al., 2003). Polymerase chain reaction (PCR) amplification for these DNA fragments, and their subsequent sequencing and analysis through comparison to international genetic databases, like Barcode of Life (BOLD) and GenBank, have revolutionized the traceability and authenticity of finfish and shellfish species in global markets. DNA barcodes have been applied to identify over 6000 fish species, including 400 New Zealand, 207 Australian, 250 South African and 100 Pacific Canadian species (Lakra et al., 2011). Also, it revealed different levels of fraud in the fish filets (Galal-Khallaf et al., 2014; Di Pinto et al., 2015). Moreover, mislabeling in seafoods markets identified in different countries like Canada, South Korea, and Brazil (Almerón-Souza et al., 2018; Hu et al., 2018; Do et al., 2019). DNA barcoding gap analysis is also frequently appended to these genetic identification. The barcoding gap is defined as the relation between the maximum intraspecific distances within each species, and the minimum interspecific distance with its nearest neighbor (Pandey et al., 2020). The accuracy of application of certain genetic marker as a DNA bracode depends especially in presence of significant discordance between the “within” species genetic distances from one side, and the genetic distances “between” closer species from the other (Meyer and Paulay, 2005).
In the biggest Egyptian fish market in the North of the Red Sea, in the Suez City, many fish species from different areas of the Red Sea, the Mediterranean Sea, and the Egyptian Lakes are landed. The current work aimed to investigate the efficiency of DNA barcoding protocol in characterizing different species present in these commercial landings through random sampling. The results were expected to be used for providing recommendations regarding the utility of DNA barcoding in assessment of species presence and genetic diversity. Such work can be considered as a case study that can be applied in other similar markets in the area and the world that are receiving landings from regions considered as hot spots for species diversity, endemism, and invasions.
2 Materials and methods
2.1 Collection of samples
In the period of peaking of fish landings in Suez City (Fig. 1), Egypt, i.e. from December 2017 to February 2018, nine different fish species were randomly collected (Fig. 2). Five individuals from each species were photographed and subjected to initial morphological identification for species. The initial identification was to the genus level. The sampled genera were Coris, Cheilinus, Calotomus, Papilloculiceps, Priacanthus, Gerres, Alepes, Pardachirus, and Psettodes. Then, caudal fin clips (weighing about 100 mg each) were excised, placed in absolute ethyl alcohol (96% ethanol) in 1.5 mm Eppendorf tubes, and transferred to the Molecular Biology and Biotechnology Lab of Zoology Dept., Faculty of Science, Menoufia University in Menoufia Governorate, together with samples of the entire fishes, for DNA barcoding, which was expected to provide identification for the sampled fishes to the species level.
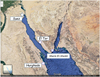 |
Fig. 1 Map for Suez city location in the Red Sea (white star) and some of the ley Red Sea cities from where Suez City market receive its landings. Photo credits GoogleMaps™ (details below the map). |
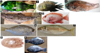 |
Fig. 2 Photos for the sampled fish species from Suez city market in the Red Sea. 1. Coris aygula, 2. Cheilinus trilobatus, 3. Calotomus viridescens, 4. Papilloculiceps longiceps, 5. Priacanthus sagittarious, 6. Gerres longirostris, 7. Alepes djedaba, 8. Pardachirus marmoratus, and 9. Psettodes erumei. |
2.2 DNA barcoding procedures
2.2.1 DNA extraction
DNA extraction was done using conventional salting out procedure as described by Mohammed-Geba et al. (2016). Briefly, total genomic DNA was purified from 15 mg of each fin clip. Fin clips were lysed individually using 200 µL of TNES-urea buffer and 1.2 U Proteinase K solution (ThermoFischer Scientific), with incubation at 55 °C for 60 min. 54 µL of 5 M NaCl were then added, the tubes were thoroughly mixed by inversion (by vortex), then centrifuged at 4000 g for 10 min. The supernatant from each sample was transferred to other 1.5 mL eppendorf tube, and the DNA was then precipitated by adding 200 µL of cold isopropanol (at −20 °C) with shacking by inversion. The tubes were centrifuged at 11,000 g for 10 min, and the supernatant was completely removed. The DNA pellet was washed by 400 µL of 70% Ethanol, centrifuged for 5 min at 11,000 g and poured completely from ethanol, then 30 µL of Tris EDTA buffer (10 mM TRIS–HCL pH8, 2 mM EDTA pH8 and 19.720 µL of sterile double distilled H2O) were added to reconstitute the DNA pellet.
2.2.2 Amplification of barcode gene fragment
The partial 5′ barcode region sequence of the mitochondrial COI gene in each sample was amplified by PCR using the set of primers, described by Ward et al. (2005), namely: wCoI-Fw: 5́-TCAACCAACCACAAAGACATTGGCAC-3́, and wCoI-Rv: 5́-TAGACTTCTGGGTGGCCAAAGAATCA-3́. The amplification reactions were set up as 100 ng of template DNA from each sample, 1× MyTaq™ Red Mix (Bioline), 0.5 µM of each primer, and 200 ng mL−1 of bovine serum albumin (BSA), to a total volume of 25 µL. PCRs were carried out in the thermal cycler TC512 (Techne, UK). The PCR program included an initial preheating/polymerase activating step at 95 °C for 5 min, followed by 40 cycles of amplification (30 sec. at 95 °C for denaturation,30 sec. at 56 °C for annealing, and 30 sec. at 72 °C for extension), then a final extension step for 10 min at 72 °C. The amplified products were visualized using 1% agarose gel electrophoresis stained by 0.5 μg μL−1 of ethidium bromide. PCR products were then sent to Macrogen Inc., South Korea, for sequencing, applying conventional Sanger chain termination sequencing method.
2.2.3 Analyses of COI sequences
Mitochondrial COI gene sequences were reviewed and manually trimmed whenever necessary. Sequences edition was carried out using Chromas Lite software version 2.6.5 (Technelysium- Pty Ltd, available from the URL http://technelysium.com.au/), then the results were compared to the international DNA barcode databases relevant to the species assessed, that are GenBank and barcode of life (BOLD).
In order to calculate different population and genetic richness parameters for each species identified, COI sequences from all samples of each species were separately aligned using CLUSTAL W (Thompson et al., 1994) integrated to Mega 6.06 software (Tamura et al., 2013). The alignment was uploaded to the software DNAsp6 (Rozas et al., 2017) in order to determine the existing haplotypes, besides key population analysis such like the haplotype diversity index (Hd), nucleotide diversity index (Pi) and Fu Fs neutrality statistic for population expansion.
Later on, and to carry out phylogenetic analysis, genetic distances, and barcoding gap analysis, COI sequences obtained from the same hypothesized species in different areas of the world were downloaded from GenBank database. Besides, a single COI sequence from Epinephelus summana (Perciformes:Serranidae) was also retrieved from GenBank to serve as an outgroup for the subsequent phylogenetic analysis. All sequences were aligned using CLUSTAL W in the Mega 6.06 platform (Tamura et al., 2013). The alignment created for these species was used to calculate the genetic pairwise distances through three models: Jukes-Cantor (JC), p-distances, and Kimura two-parameters (K2P), as way to infer the presence of barcoding gap through the relation between maximum intraspecific and minimum interspecific values. Then, the same alignment was uploaded as a nexus format to MrBayes 3.2.1 software (Ronquist et al., 2012), in order to confirm the identity of our Egyptian species using Bayesian inference (BI) for phylogenetic relations. A prior identification of the best nucleotide substitution model was carried out using JModelTest software V. 2.1.10 (Darriba et al., 2012). Later, viz in the MrBayes 3.2.1 platform, four Markov Chains Monte Carlo (MCMC) chains were analyzed for 10 million (ngen = 10,000,000) generations, saving a tree each 1000 generations. The subsequent analyses were carried out after assuring an average standard deviation of split frequencies below 0.001. The number of burn-ins was identified using Tracer 1.7 (Rambaut et al., 2018). Tracer 1.7 exhibited that 25% of the saved trees are to be discarded as burn-ins. This information was transferred to MrBayes 3.2.1. for constructing the summarized tree, which was then viewed using FigTree v 1.3.1 (Rambaut, 2009).
3 Results
3.1 DNA barcoding
The barcoding was done randomly for 5 specimens from each species, so as to authenticate the code. We generated barcodes for 9 different species, in 7 families and 3 orders. These families included: (1) Labridae, represented by Coris aygula, Cheilinus trilobatus and Calotomus viridescens; (2) platycephalidae, represented by Papilloculiceps longiceps; (3) Priacanthidae, represented by Priacanthus sagittarius; (4) Gerridae, represented by Gerres longirostris; (5) Carangidae, represented by Alepes djedaba; (6) Soleidae, represented by Pardachirus marmoratus; and (7) Psettodidae, represented by Psettodes erumei. Latin, English common and Egyptian commercial names for all species are shown in Table 1. The generated barcodes that were submitted to the GenBank matched perfectly with that of the initial morphological identification. After considering a species level of minimum barcode identity of 98% upon COI databases comparison, and further confirming the identity of the species using morphological screening, the sequences were deposited in the GenBank database under accession numbers MT905032-MT905058. The same sequences were submitted to the BOLD with the project code RedSF. We could not found any previous Egyptian barcodes for these species in both GenBank and BOLD. The closest GenBank reference sequences exhibited 98–100% identity with all the samples we collected from Suez City fish market (Tab. 2). However, 3 species exhibited lower similarities with the same species that were collected from different areas in the Indian Ocean and previously deposited in the GenBank database early, i.e. between 2010 and 2014. These species were P. erumei, P. sagittarius, and G. longirrostris. P. erumei exhibited 97.45% identity with specimens obtained from Taiwan, Indonesia, and Australia (acc. No. MK617169.1, KP856823, and EF609441.1). P. sagittarius exhibited 96% sequence identity with specimens from the same species collected from India (acc. No. KF815028.1). G. longirostris exhibited 94% sequence identity with specimens from Australia and South Africa (acc. No. KP194171.1 and JF493521.1).
Premature stop codons, as well as nucleotides insertion or deletions, could not be detected in the obtained barcodes. Analysing the genetic distances within and among the species identified through P-distances, K2P and JK models revealed the presence of a clear and significant barcoding gap, that was almost identical among all assessed models (Fig. 3). All the points in the barcode gap analysis, except G. longirostris, were above the slope, indicating the presence of the barcode gap.
Latin, English common, Egyptian commercial, and International Union for Conservation of Nature (IUCN)-Red list state of conservation of the fishes identified in the current work.
COI sequences identities among the samples collected from Suez city fish market in the current study and their closest counterparts from different areas in the world.
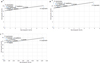 |
Fig. 3 Analysis of barcoding gap using the models Jukes-Cantor (a), p-distances (b) and Kimura-2 Parmeters (K2P). |
3.2 Genetic divergence among species
The mean genetic distances based on the three models, i.e. P-distances, K2P and JK, exhibited very similar values and trends (Fig. 3, Supplementary Tables 1–3). The highest interspecific divergence was recorded between P. erumei and P. marmoratus (19–29%), while the least interspecific divergence was recorded between C. aygula in one hand and all other species except Papilloculiceps longiceps and P. marmoratus in the other (17–24%). Likewise, A. djedaba exhibited 17–24% divergence with all species but G. longirostris and P. marmoratus (Supplementary Tables 1–3).
3.3 Genetic diversity within species
Different degrees of genetic diversities could be identified for the sampled species. Papilloculiceps longiceps exhibited a haplotype diversity (Hd) of 0.9, and a nucleotide diversity (Pi) of 0.00259 (Fu Fs: ‑1.648). Coris aygula had an Hd of 0.7 and a Pi of 0.00301 (Fu Fs: ‑0.469). Priacanthus sagittarius had an Hd of 1 and a Pi of 0.00852 (Fu Fs: ‑1.481). Gerres longirostris had an Hd of 1 and a Pi of 0.00302 (Fu Fs: ‑3.304). Alepes djedaba had an Hd of 1 and a Pi of 0.01756 (Fu Fs: 0.314). Psettodes erumei had an Hd of 0.7 and a Pi of 0.01029 (Fu Fs: 2.678). Calotomus viridescens and Pardachirus marmoratus exhibited only single haplotype per each. Pardachirus marmoratus exhibited the lowest intraspecific distances (0%), while G. longirostris exhibited the highest degree of intraspecific divergence (7–8%, among the three different substitution models).
3.4 Phylogenetic analysis
Phylogenetic analysis (Fig. 4) coincided with Genbank/BOLD comparison, being all species collected from Suez City market and their counterparts in the world, more precisely in the Indian and Pacific Oceans and their related seas and gulfs, clustering together in monophyletic clades with high bootstrap values (>50% in all cases). Yet, subclades were found for many of these species, chiefly G. longirostris, A. djedaba, C. trilopbatus, and P. erumei. The species that belong to the family Labridae, i.e. C. aygula, C. trilobatus, and C. viridescens were present all in the same clade together, with a bootstrap value of 74%. Also, close proximity could be identified between representatives of the family Carangidae, i.e. Alepes djedaba; and Psettodidae, i.e. Psettodes erumei (Fig. 4).
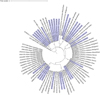 |
Fig. 4 BI phylogenetic analysis for the samples collected in the current study. four Markov Chains Monte Carlo (MCMC) chains were analyzed for 10 million (ngen = 10,000,000) generations. Bootstrap values are shown above the branches. Samples collected from Suez City market are highlighted by light blue. |
4 Discussion
The randomly sampled fish specimen from Suez city market could be successfully identified, with 98–100% identities based on BLAST and BOLD comparisons. Despite all species exhibited high DNA barcode identity with their recent references, some previously released sequences of some species exhibited low identities with our samples. Controversies in morphology are frequent, yet they are nowadays plausibly resolved through applying genetic markers, specifically the DNA barcoding (Krishnamurthy and Francis 2012; Pandey et al., 2020). The high resolution that DNA barcoding exhibits is based upon its dependence on the highly conserved sequences of the COI gene. This, if coupled with having good morphological knowledge about the target species, is strongly recommended to provide accurate species identification (Bhattacharya et al., 2016). Furthermore, a key problem in the fish identification studies is the phenotypic polymorphism in the same species in geographically close or distant regions, thus DNA barcoding is of a crucial importance to unify the nomenclature of such different phenotypes (Keat-Chuan et al., 2017). For the best of authorś knowledge, this work is the first to provide barcodes of the assessed species from the Egyptian waters. Hence, the current work provided valuable tools for aiding future trials for proper species identification at taxonomic and molecular levels, with their direct relation to conservation of natural biodiversity and controlling species use in markets. Moreover, the presence barcoding gap for all assessed species clearly indicate the success of partial COI 5́ region barcodes to discriminate fish species in that market and other similar fish markets in the Red Sea, even if their fishes as some of those in Suez City market that are being landed after some time of fishing, that may attain 10–15 days of storage in the boat́s board (Prof. Alaa G.M. Osman, personal communication).
With regard to the pairwise distances and phylogenetic analysis, some peculiarities could also be identified. First, the pairwise distances as assessed using K2P, elucidated clear hierarchical increase in K2P mean divergence across different taxonomic levels, being the intraspecific genetic distances ranging between 0 and 0.078, and the interspecific genetic distances ranging between 0.2 and 0.3. This was in accordance with the presence of clear barcoding gap for the species studied herein. Such increase could be previously identified in several fish species, including marine reef bony fishes, freshwater bony fishes, and chondrichthys (Thomas Jr et al., 2014; Vella et al., 2017; Fadli et al., 2020; Pandey et al., 2020), Second, the phylogenetic placement of some different species corresponded with very recent works regarding the taxonomy of those species. This was the case of P. erumei (Pleuronectoidae) and A. djedaba (Carangidae), the taxa that were found to be closely related at both genomic and morphological levels (Girard et al., 2020). Third, cryptic speciation might exist in some species owing to high interspecific K2P values, chiefly within P. sagittarius (2%), P. erumei (4%) and G. longirostris (8%). Presence of cryptic species within this market can be expected, as most of its landings come from the Red Sea, which is one of the key extensions of the Indian Ocean. DNA barcodes revealed various cases of cryptic species in landing from the Indian Ocean and its related environments. For example, DNA sequencing of market samples could elucidate cryptic speciation within the long face emperor (Lethrinus olivaceus) in the Indo-West Pacific (Borsa et al., 2013). Also, it could reveal the cryptic speciation between populations of the yellowfin hind, Cephalopholis hemistiktos in the Red Sea and Gulf of Aden from one side, and the Gulf of Oman and Arabian Gulf in the other (Priest et al., 2016). Likewise, the sardines of the species Sardinella gibbosa that were collected from locations across the Philippine archipelago (Thomas Jr et al., 2014). Another possible explanation also for the high conspecific variations in those three species; i.e. P. sagittarius, P. erumei and G. longirostris; might be a microevolutionary structure resulting from long-distance separation, oceanic currents variations, or even historical changes in oceanic water levels, chiefly the Pleistocene glaciations (Colborn et al., 2001). This has also been elucidated in other Indo-Pacific fishes, i.e. those of the Indo-Malay Philippines Archipelago, as well as several Indo-Pacific marine invertebrates as sea urchins, giant clams, and starfishes (Colborn et al., 2001; Hubert et al., 2012).
Analysis of genetic diversity also provided interesting results. Haplotypes diversity was the highest in P. Sagittarius, G. longirostris, and A. djedaba. Papilloculiceps longiceps, C. aygula, and P. erumei had also high Hd levels. Except A. djedaba and P. erumei, all these species showed negative Fu Fs values that were significantly different from zero, suggesting that these landings came from populations that are recently expanding. However, the low nucleotide diversities among different haplotypes of these may point to either the fishing of these species from geographical areas that do not restrict the gene flow, or their fishing was from populations that are facing genetic bottlenecks. However, the low number of samples genotyped from each species cannot provide conclusive evidence about which of these evolutionary processes are causing the low intraspecific nucleotide diversities. Presence of intraspecific variations and phylogenetic separation among different haplotypes of most species, as found in our phylogenetic analysis, may indicate cryptic speciation in the studied species. Such notion has also been identified upon population and phylogenetic analyses of DNA barcodes for different Australian sharks and rays from Australia (Ward et al., 2008), several freshwater species from Ranganadi River in India (Pandey et al., 2020).
In conclusions, the current work provides first data on the utility of DNA barcoding for identifying Red Sea species diversity, phylogenetic relationships, and genetic richness using market samples. Similar works in other fish markets in the area, and even a more extended work in that same market, are needed to provide further knowledge about species diversity and cryptic speciation in the Red Sea as one of the key regions of biodiversity and species endemism in the world.
Supplementary Material
Table S1. P-distances genetic.
Table S2. JK genetic distances.
Table S3. K2P genetic distances.
Access Supplementary MaterialAcknowledgements
The authors would like to appreciate their deep thanks for Dr. Ezzat Mohammed-AbdAllah, from the Faculty of Science of Al-Azhar University (Assiut's branch), for his efforts and precious aids during sample collection and initial morphological identification.
References
- Almerón-Souza F, Sperb C, Castilho CL, Figueiredo PI, Gonçalves LT, Machado R, Fagundes NJ. 2018. Molecular Identification of Shark Meat From Local Markets in Southern Brazil Based on DNA Barcoding: Evidence for Mislabeling and Trade of Endangered Species. Front Genetics 9. [Google Scholar]
- Bariche M, Torres M, Smith C, Sayar N, Azzurro E, Baker R, Bernardi G. 2015. Red Sea fishes in the Mediterranean Sea: a preliminary investigation of a biological invasion using DNA barcoding. J Biogeogr 42: 2363–2373. [Google Scholar]
- Bhattacharya M, Sharma AR, Patra BC, Sharma G, Seo EM, Nam JS, Lee SS. 2016. DNA barcoding to fishes: current status and future directions. Mitochondrial DNA Part A 27: 2744–2752. [CrossRef] [Google Scholar]
- Bogorodsky SV, Randall JE. 2019. Endemic Fishes of the Red Sea. In Oceanographic and Biological Aspects of the Red Sea 239–265. Cham: Springer. [CrossRef] [Google Scholar]
- Borsa P, Hsiao DR, Carpenter KE, Chen WJ. 2013. Cranial morphometrics and mitochondrial DNA sequences distinguish cryptic species of the longface emperor (Lethrinus olivaceus), an emblematic fish of Indo-West Pacific coral reefs. Comp Rend Biol 336: 505 –514. [CrossRef] [Google Scholar]
- Colborn J, Crabtree RE, Shaklee JB, Pfeiler E, Bowen BW. 2001. The evolutionary enigma of bonefishes (Albula spp.): cryptic species and ancient separations in a globally distributed shorefish. Evolution 55: 807–820. [CrossRef] [PubMed] [Google Scholar]
- Corsini-Foka M, Kondilatos G, Economidis PS. 2004. Occurrence of the lessepsian species Portunus pelagicus (Crustacea) and Apogon pharaonis (Pisces) in the marine area of Rhodes Island. Mediterranean Mar Sci 5: 83–90. [CrossRef] [Google Scholar]
- Darriba D, Taboada GL, Doallo R, Posada D. 2012. jModelTest 2: more models, new heuristics and parallel computing. Nat Methods 9: 772. [Google Scholar]
- Di Pinto A, Marchetti P, Mottola A, Bozzo G, Bonerba E, Ceci E, Tantillo G. 2015. Species identification in fish fillet products using DNA barcoding. Fish Res 170: 9–13. [Google Scholar]
- Do TD, Choi TJ, Kim JI, An HE, Park YJ, Karagozlu MZ, Kim CB. 2019. Assessment of marine fish mislabeling in South Korea's markets by DNA barcoding. Food Control 100: 53–57. [Google Scholar]
- Eschmeyer WN, Fricke R, Fong GD, Polack DA. 2010. Marine fish diversity: history of knowledge and discovery (Pisces). Zootaxa 2525: 19–50. [Google Scholar]
- Fadli N, Nor SAM, Othman AS, Sofyan H, Muchlisin ZA. 2020. DNA barcoding of commercially important reef fishes in Weh Island, Aceh, Indonesia. PeerJ 8: e9641. [CrossRef] [PubMed] [Google Scholar]
- FAO 2010–2020. Fishery and Aquaculture Country Profiles. Egypt (2010). Country Profile Fact Sheets. In: FAO Fisheries Division [online]. Rome. Updated 1 May 2010. [Cited 29 August 2020]. http://www.fao.org/fishery/ [Google Scholar]
- Galal-Khallaf A, Ardura A, Mohammed-Geba K, Borrell YJ, Garcia-Vazquez E. 2014. DNA barcoding reveals a high level of mislabeling in Egyptian fish fillets. Food Control 46: 441 –445. [Google Scholar]
- Galal-Khallaf A, Mohammed-Geba K, Osman AG, AbouelFadl KY, Borrell YJ, Garcia-Vazquez E. 2017. SNP-based PCR-RFLP, T-RFLP and FINS methodologies for the identification of commercial fish species in Egypt. Fish Res 185: 34–42. [Google Scholar]
- Galal-Khallaf A, Osman AG, El-Ganainy A, Farrag MM, Mohammed-AbdAllah E, Moustafa MA, Mohammed-Geba K. 2019. Mitochondrial genetic markers for authentication of major Red Sea grouper species (Perciformes: Serranidae) in Egypt: A tool for enhancing fisheries management and species conservation. Gene 689: 235 –245. [Google Scholar]
- Girard MG, Davis MP, Smith WL. 2020. The Phylogeny of Carangiform Fishes: Morphological and Genomic Investigations of a New Fish Clade. Copeia 108: 265–298. [Google Scholar]
- Gray JS. 1997. Marine biodiversity: patterns, threats and conservation needs. Biodivers Conserv 6: 153–175. [Google Scholar]
- Hassan M, Harmelin-Vivien M, Bonhomme F. 2003. Lessepsian invasion without bottleneck: example of two rabbitfish species (Siganus rivulatus and Siganus luridus). J Exp Mar Biol Ecol 291: 219–232. [Google Scholar]
- Hebert PD, Cywinska A, Ball SL. 2003. Biological identifications through DNA barcodes. Proc Biol Sci R Soc 270: 313–321. [CrossRef] [Google Scholar]
- Hu Y, Huang SY, Hanner R, Levin J, Lu X. 2018. Study of fish products in Metro Vancouver using DNA barcoding methods reveals fraudulent labeling. Food Control 94: 38–47. [Google Scholar]
- Hubert N, Meyer CP, Bruggemann HJ, Guerin F, Komeno RJ, Espiau B, Planes S. 2012. Cryptic diversity in Indo-Pacific coral-reef fishes revealed by DNA-barcoding provides new support to the centre-of-overlap hypothesis. PLoS one 7: e28987. [CrossRef] [PubMed] [Google Scholar]
- Hulme PE, Bacher S, Kenis M, Klotz S, Kuhn I, Minchin D, Nentwig W, Olenin S, Panov V, Pergl J, Pyšek P, Roques A, Sol D, Solarz W, Vila M. 2008. Grasping at the routes of biological invasions: a framework for integrating pathways into policy. J Appl Ecol 45: 403–414. [Google Scholar]
- Keat-Chuan Ng C, Aun-Chuan Ooi P, Wong WL, Khoo G. 2017. A review of fish taxonomy conventions and species identification techniques. Surv Fish Sci 4: 54–93. [Google Scholar]
- Krishnamurthy PK, Francis RA. 2012. A critical review on the utility of DNA barcoding in biodiversity conservation. Biodivers Conserv 21 : 1901–1919. [Google Scholar]
- Lakra WS, Verma MS, Goswami M, Lal KK, Mohindra V, Punia P, et al. 2011. DNA barcoding Indian marine fishes. Mol Ecol Resour 11: 60 –71. [Google Scholar]
- Meyer CP, Paulay G. 2005. DNA barcoding: error rates based on comprehensive sampling. PLoS Biol 3: e422. [CrossRef] [PubMed] [Google Scholar]
- Mohammed-Geba K, Hassab El-Nabi SE, El-Desoky MS. 2016. Development of cytochrome-c-oxidase 1 specific primers for genetic discrimination of the European eel Anguilla anguilla (Linnaeus, 1758). J Biosci Appl Res 2: 258 –262. [CrossRef] [Google Scholar]
- Pandey PK, Singh YS, Tripathy PS, Kumar R, Abujam SK, Parhi J. 2020. DNA Barcoding and Phylogenetics of Freshwater Fish Fauna of Ranganadi River, Arunachal Pradesh. Gene 144860. [Google Scholar]
- Priest MA, DiBattista JD, McIlwain JL, Taylor BM, Hussey NE, Berumen ML. 2016. A bridge too far: dispersal barriers and cryptic speciation in an Arabian Peninsula grouper (Cephalopholis hemistiktos). J Biogeogr 43: 820 –832. [Google Scholar]
- Rambaut A. 2009. FigTree, version 1.3. 1. Computer program distributed by the author, website: http://treebioedacuk/software/figtree/ [accessed January 4, 2011]. [Google Scholar]
- Rambaut A, Drummond AJ, Xie D, Baele G., Suchard MA. 2018. Posterior summarization in Bayesian phylogenetics using Tracer 1.7. System Biol 67: 901–904. [Google Scholar]
- Roberts CM, McClean CJ, Veron JEN, et al. 2002. Marine biodiversity hotspots and conservation priorities for tropical reefs. Science 295: 1280–1284. [Google Scholar]
- Ronquist F, Teslenko M, van der Mark P, Ayres D, Darling A, Höhna S, Larget B, Liu L, Suchard MA, Huelsenbeck JP. 2012. MrBayes 3.2: efficient Bayesian phylogenetic inference and model choice across a large model space. System Biol 61: 539–542. [CrossRef] [PubMed] [Google Scholar]
- Rozas J, Ferrer-Mata A, Sánchez-DelBarrio JC, Guirao-Rico S, Librado P, Ramos-Onsins SE, Sánchez-Gracia A. 2017. DnaSP 6: DNA sequence polymorphism analysis of large datasets. Mol Biol Evol 34: 3299–3302. [CrossRef] [PubMed] [Google Scholar]
- Sirna Terranova M, Lo Brutto S, Arculeo M, Mitton JB. 2006. Population structure of Brachidontes variabilis (P. Fisher, 1870) (Bivalvia, Mytilidae) in the Mediterranean Sea and evolution of a novel mtDNA polymorphism. Mar Biol 150: 89–101. [Google Scholar]
- Sonnewald M, El-Sherbiny MM. 2017. Editorial: Red Sea biodiversity. Mar Biodiver 47: 991–993. [CrossRef] [Google Scholar]
- Tamura K, Stecher G, Peterson D, Filipski A, Kumar S. 2013. MEGA6: molecular evolutionary genetics analysis version 6.0. Mol Biol Evol 30: 2725 –2729. [CrossRef] [PubMed] [Google Scholar]
- Thomas Jr RC, Willette DA, Carpenter KE, Santos MD. 2014. Hidden diversity in sardines: genetic and morphological evidence for cryptic species in the goldstripe sardinella, Sardinella gibbosa (Bleeker, 1849). PloS ONE 9: e84719. [CrossRef] [PubMed] [Google Scholar]
- Thompson JD, Higgins DG, Gibson TJ. 1994. CLUSTAL W: improving the sensitivity of progressive multiple sequence alignment through sequence weighting, position-specific gap penalties and weight matrix choice. Nucl Acids Res 22: 4673–4680. [CrossRef] [PubMed] [Google Scholar]
- Vella A, Vella N, Schembri S. 2017. A molecular approach towards taxonomic identification of elasmobranch species from Maltese fisheries landings. Mar Genomics 36: 17 –23. [Google Scholar]
- Veron JEN, Devantier LM, Turak E. et al., 2009. Delineating the coral triangle. Galaxea. J Coral Reef Studies 11: 91–100. [CrossRef] [Google Scholar]
- Ward RD, Zemlak TS, Innes BH, Last P, Hebert PDN. 2005 DNA barcoding Australia's fish species. Philos Trans Royal Soc B 360: 1847–1857. [Google Scholar]
- Ward RD, Holmes BH, White WT, Last PR. 2008. DNA barcoding Australasian chondrichthyans: results and potential uses in conservation. Mar Freshw Res 59: 57 –71. [Google Scholar]
Cite this article as: Abdalwahhab O, Galal-Khallaf A, El-Latif Saber SA, Osman AG, Mohammed-Geba K. 2020. A case study for application of DNA barcoding in identifying species and genetic diversity of fish from the Suez city market, Egypt. Aquat. Living Resour. 33: 11
All Tables
Latin, English common, Egyptian commercial, and International Union for Conservation of Nature (IUCN)-Red list state of conservation of the fishes identified in the current work.
COI sequences identities among the samples collected from Suez city fish market in the current study and their closest counterparts from different areas in the world.
All Figures
|
Fig. 1 Map for Suez city location in the Red Sea (white star) and some of the ley Red Sea cities from where Suez City market receive its landings. Photo credits GoogleMaps™ (details below the map). |
| In the text | |
|
Fig. 2 Photos for the sampled fish species from Suez city market in the Red Sea. 1. Coris aygula, 2. Cheilinus trilobatus, 3. Calotomus viridescens, 4. Papilloculiceps longiceps, 5. Priacanthus sagittarious, 6. Gerres longirostris, 7. Alepes djedaba, 8. Pardachirus marmoratus, and 9. Psettodes erumei. |
| In the text | |
|
Fig. 3 Analysis of barcoding gap using the models Jukes-Cantor (a), p-distances (b) and Kimura-2 Parmeters (K2P). |
| In the text | |
|
Fig. 4 BI phylogenetic analysis for the samples collected in the current study. four Markov Chains Monte Carlo (MCMC) chains were analyzed for 10 million (ngen = 10,000,000) generations. Bootstrap values are shown above the branches. Samples collected from Suez City market are highlighted by light blue. |
| In the text | |
Current usage metrics show cumulative count of Article Views (full-text article views including HTML views, PDF and ePub downloads, according to the available data) and Abstracts Views on Vision4Press platform.
Data correspond to usage on the plateform after 2015. The current usage metrics is available 48-96 hours after online publication and is updated daily on week days.
Initial download of the metrics may take a while.