Free Access
Fig. 13
Download original image
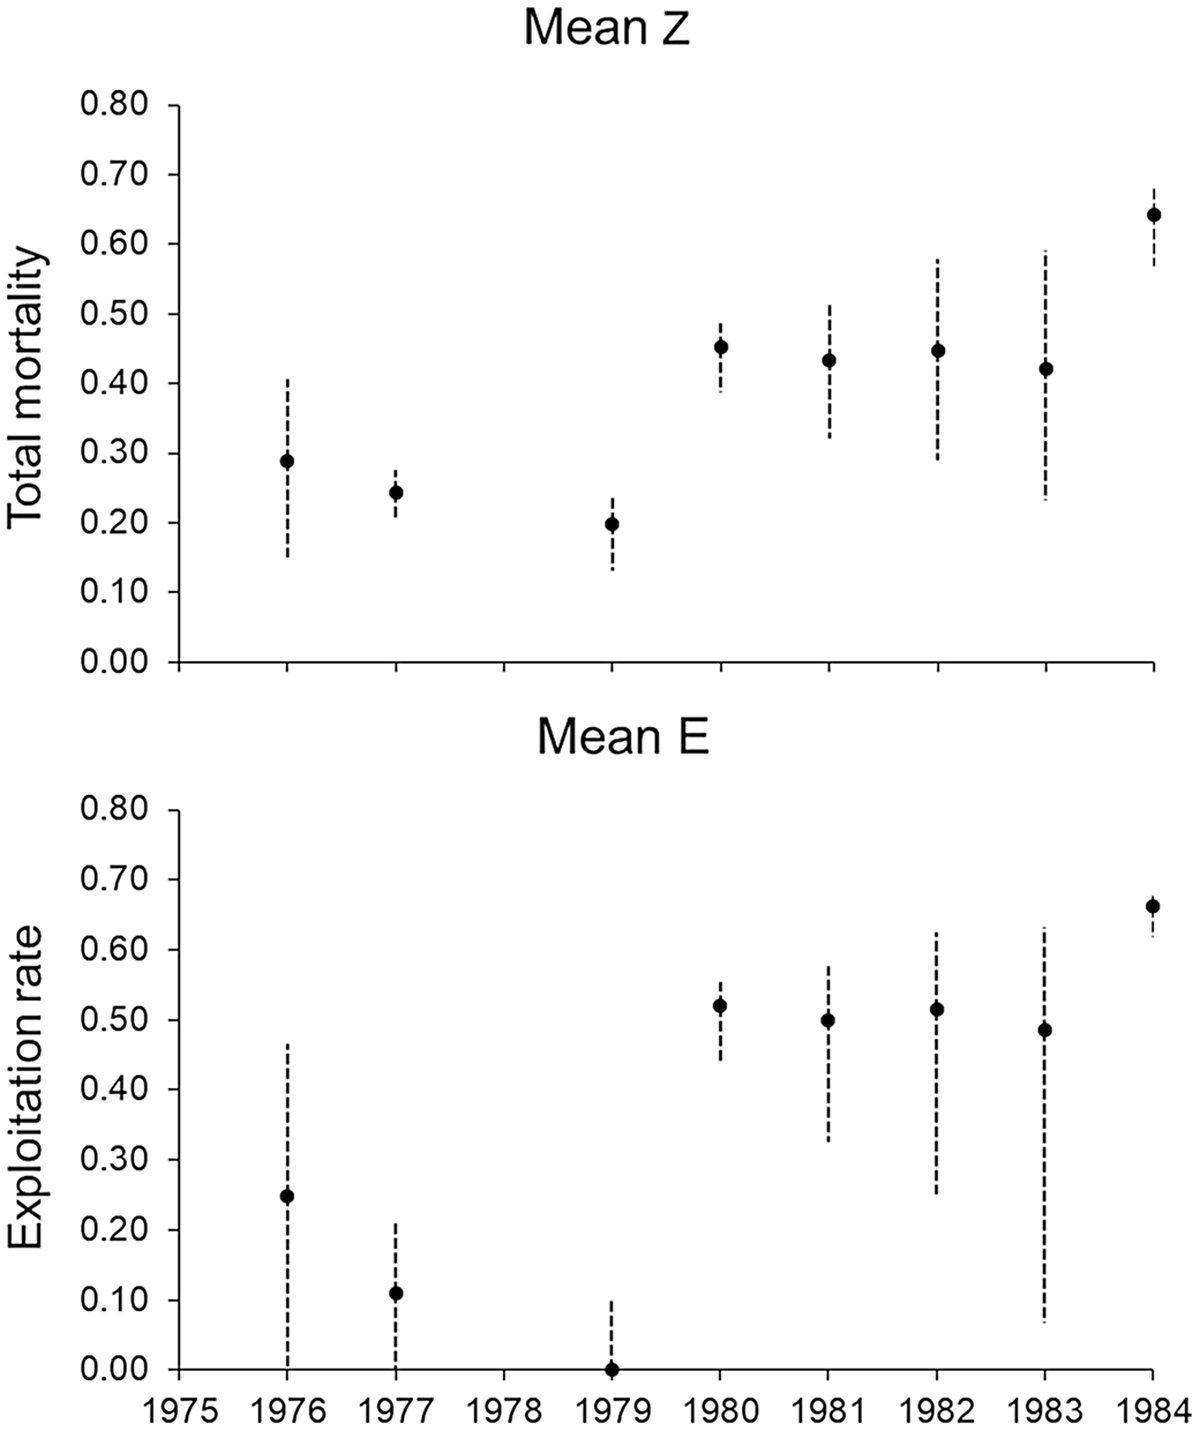
Annual total instantaneous mortality coefficient Z (upper panel) and exploitation rate E (lower panel) of Pagrus pagrus fished in southern Brazil between 1976 and 1984. Vertical bars represent 95% bootstrap confidence intervals.
Current usage metrics show cumulative count of Article Views (full-text article views including HTML views, PDF and ePub downloads, according to the available data) and Abstracts Views on Vision4Press platform.
Data correspond to usage on the plateform after 2015. The current usage metrics is available 48-96 hours after online publication and is updated daily on week days.
Initial download of the metrics may take a while.