


| Issue |
Aquat. Living Resour.
Volume 39, 2026
|
|
|---|---|---|
| Article Number | 16 | |
| Number of page(s) | 16 | |
| DOI | https://doi.org/10.1051/alr/2026009 | |
| Published online | 11 June 2026 | |
Research Article
Towards sustainable management of the Cunene horse mackerel (Trachurus trecae) in Guinea-Bissau waters
1
Department of Oceanography and Fisheries, Faculty of Sciences and Technology, University of the Azores, Horta, Azores, Portugal
2
Instituto Nacional de Investigação das Pescas e Oceanografia - INIPO, Av. Amílcar Cabral, Rua 12 Bissau, CP 102 - Bissau, Guinea-Bissau
3
School of Aquatic and Fishery Sciences, University of Washington, Seattle, United States
4
University of the Azores, Institute of Marine Sciences - OKEANOS, Rua Professor Doutor Frederico Machado 4, 9900-140 Horta, Portugal
5
CIBIO, Research Centre in Biodiversity and Genetic Resources, InBio Associate Laboratory, BIOPOLIS Program in Genomics, Biodiversity and Land Planning; UNESCO Chair – Land Within Sea: Biodiversity & Sustainability in Atlantic Islands, University of the Azores, Rua da Mãe de Deus, 9500-321 Ponta Delgada, Portugal
* Corresponding author: This email address is being protected from spambots. You need JavaScript enabled to view it.
Received:
13
December
2025
Accepted:
18
May
2026
Abstract
This study assessed the status of the Cunene horse mackerel (Trachurus trecae) stock in Guinea-Bissau (2018–2023) using fishery-dependent and independent data. Catches ranged from 29.1 kt (kilotones) in 2020 to 10.2 kt in 2023, dominated by Chinese (57.2%) and Guinean (22.6%) fleets. Fishing was concentrated between January and May, mainly in the 10–12°N and 16–18°W area, with demersal trawl accounting for 52.1% of catches. Biological parameters revealed negative allometry with b = 2.80 [2.75–2.84], L50 = 20.0 [19.6–20.3] cm for grouped sexes, L∞ of 48.8 [46.4–52.2] cm, K of 0.55 [0.34–0.74] yr−1, and M of 0.67 [0.47–0.87] yr−1, indicating a “fast” life history. Length-based indicators show reduced yields and loss of large spawners, suggesting current exploitation patterns might be unsustainable, but results were considerably sensitive to life history parameter values, particularly L∞ and L50, which warrants continued data collection. These findings call for immediate science-based management, which might include seasonal closures, reduced fishing effort, improved gear selectivity, and enhanced monitoring. Enhanced institutional capacity and regional cooperation are critical to strengthening monitoring efforts.
Key words: Horse mackerel / life history / stock assessment / sustainable fisheries management / West Africa
Handling Editor: Nicolas Bez
© D. Nonque et al., Published by EDP Sciences 2026
 This is an Open Access article distributed under the terms of the Creative Commons Attribution License (https://creativecommons.org/licenses/by/4.0), which permits unrestricted use, distribution, and reproduction in any medium, provided the original work is properly cited.
1 Introduction
Fishing plays a central role in the global economy and food security, providing livelihoods and supplying animal protein to over three billion people (Béné et al., 2015). In 2022, global production reached 91 Mt (megatonnes), corresponding to USD 157 billion, of which 80 Mt originated from marine fisheries and 11 Mt from inland fisheries (FAO, 2024). Since 1961, global fish consumption has grown at an average annual rate of 3%, exceeding the population growth rate of 1.6%, and reached 165 Mt in 2022 for human consumption, with a per capita average of 20.7 kg (FAO, 2024).
The persistent expansion of demand has placed significant pressure on fishery resources, resulting in a decline in the proportion of sustainably exploited stocks. In 1990, around 90% of global stocks were considered sustainable, decreasing to 62.3% in 2021 (FAO, 2024). The United Nations warns that more than two-thirds of fishery resources are currently overexploited, posing a direct threat to food security (FAO, 2024). In addition to providing about 15% of the world's animal protein and 6% of total protein intake, aquatic foods contribute key nutrients such as omega-3 fatty acids, minerals, and vitamins and play a significant role in poverty reduction and improving living conditions (FAO, 2024).
In Guinea-Bissau, fishing is a key pillar of the national economy and local livelihoods, supported by the high productivity of its exclusive economic zone (EEZ). This area, considered one of the richest in West Africa, includes ecosystems such as mangroves and extensive fishing grounds that support both national and foreign fleets, providing income to thousands of families (Popoola and Olajuyigbe, 2023). The fisheries sector is strategic for Guinea-Bissau, with industrial landings valued at EUR 310 million per year, exceeding cashew exports (EUR 201 million/year) (IMF, 2023). However, the absence of an industrial port and European certification prevents formalization, resulting in annual losses equivalent to 20.8% of gross domestic product (IMF, 2023).
This economic relevance is nevertheless embedded in a governance and operational context characterized by limited monitoring capacity, enforcement constraints, and infrastructural deficits that reduce value capture from landings and create conditions conducive to illegal, unreported, and unregulated fishing (CSRP, 2014; Okafor-Yarwood, 2019; Dittel, 2022; IMF, 2023). Within this setting, Trachurus trecae is predominantly exploited by foreign industrial fleets operating under access agreements, consistent with broader regional dynamics in which distant-water fleets play a prominent role in West African fisheries (Intchama et al., 2018; Pauly et al., 2014).
These constraints translate into persistent pressures on sustainability and food security. Overfishing, driven by high demand for high-value species, has led to the overexploitation or depletion of several stocks, with impacts on biodiversity and the regenerative capacity of populations (Belhabib et al., 2018). Destructive practices such as bottom trawling degrade critical coastal ecosystems – including mangroves and benthic habitats – resulting in reduced productivity, particularly for demersal species (Polidoro et al., 2017; Virdin et al., 2019).
Global warming and ocean pollution are profoundly altering marine ecosystems, causing species to shift into new areas, disrupting reproductive cycles, and inducing physiological stress in sensitive organisms (Cheung et al., 2009; Poloczanska et al., 2016). These changes compromise the stability of resource abundance and distribution, create regional disparities in catch availability, and reduce the predictability of stocks (Pinsky et al., 2018; Free et al., 2019). Consequently, traditional management models have become insufficient, requiring adaptive strategies capable of responding to species redistribution and the increasing uncertainty associated with climate change (Goodman et al., 2025).
Limitations in scientific information represent an additional constraint. Accurate species identification at landings is hindered by high diversity and morphological similarities among species and subspecies, requiring specialized taxonomic expertise. The lack of advanced training among observers, outdated nomenclatures, and the use of local names for multiple species result in inconsistent records, affecting the quality of species-specific estimates and fishing effort data. As a result, the actual status of several populations remains uncertain, and reliance on aggregated assessments limits the development of robust models.
Among national fisheries, demersal resources are of economic and ecological relevance due to their association with shelf and slope habitats, exposure to bottom gears, and contribution to coastal community incomes. Survey data collected within Guinea-Bissau's EEZ have documented the diversity and composition of these communities. During a campaign conducted in November 2023, 423 species were recorded, including 287 fish species from 118 families, 85 crustacean species from 36 families, and 51 mollusc species from 27 families, at depths ranging from less than 50 to 1000 meters (Yraola et al., 2024). Fish dominated the biomass captured, accounting for approximately 95% of the total, followed by crustaceans (4%) and molluscs (1%). Although fish predominate in biomass, crustaceans and cephalopods remain among the most commercially valuable groups in the region (Yraola et al., 2024).
Among the demersal fish recorded during scientific surveys, the Cunene horse mackerel (Trachurus trecae) stands out, showing a consistent increase in its relative share of estimated demersal fish biomass, from 58% in 2018 to 66% in 2022 and 69% in 2023. This indicates high availability and spatial aggregation within the Guinea-Bissau EEZ (Yraola et al., 2019, 2023, 2024). Ecologically, the species occupies intermediate trophic levels, contributes to zooplankton regulation, and influences predator populations (Gushchin and Corten, 2017). Thus, biomass fluctuations driven by exploitation or environmental variability tend to affect the balance of the region's upwelling ecosystems (Cury et al., 2000). Economically, T. trecae is a commercially important resource, with a first-sale average price estimated at USD 3 per kg in 2024. It is in high demand on the domestic market and holds export significance, contributing substantially to the profitability of fishing operations and to the national fisheries economy (Barros et al., 2021). Despite its importance, the stock's status regarding sustainability remains unknown due to incomplete and poorly disaggregated landing and effort records, uncertainties in species identification, and non-standardized abundance indicators with irregular and insufficient temporal and spatial coverage to support consistent assessments.
This study aims to assess the stock status of T. trecae in Guinea-Bissau using recent available data and approaches appropriate for data-limited stocks. Specifically, we characterize the fishery, estimate key life history parameters required for assessment, and apply the length-based indicators (LBI) to assess stock status. LBI enables inferences on conservation, sustainability, yield optimization, and proximity to conditions compatible with maximum sustainable yield (MSY) without directly estimating MSY (Froese, 2004; ICES, 2015). Their use is further supported by simulation studies demonstrating that LBIs can reliably track trends in fishing mortality (F) and perform as well as, or better than, more complex methods when equilibrium assumptions are violated (e.g., changes in recruitment, gear selectivity, and measurement error), making them suitable for data- and capacity-limited contexts (Kell and Sharma, 2025). Interpretation of LBIs, however, assumes near-equilibrium conditions (e.g., roughly constant recruitment and mortality during the analysis period) and stable selectivity. Deviations from these assumptions, along with the quality and representativeness of the length data, influence diagnostic robustness (ICES, 2015). The analysis is based primarily on fishery-dependent data, complemented by fishery-independent data from scientific surveys. The aim is to provide scientific evidence to inform management decisions consistent with sustainability.
The present assessment is framed for the Guinea-Bissau EEZ, reflecting the spatial coverage of the fishery-dependent monitoring and the scientific surveys available for 2018–2023. Stock status is therefore inferred for this assessment area as an operational management unit. At the same time, biological stock limits for T. trecae in West Africa remain unresolved, and population genetic evidence from other parts of the species range indicates that spatial structuring at management-relevant scales is plausible, underscoring the need for caution when extrapolating results beyond the assessed domain (Sardinha and Nævdal, 2002; Mota et al., 2024).
2 Methods
2.1 Study area
Guinea-Bissau is located on the West African coast, bordered to the north by Senegal, to the south and east by Guinea-Conakry, and to the west by the Atlantic Ocean. It lies between 10°59' and 12°20' N and near 13°40' W, covering a land area of approximately 36,125 km. The coastline is deeply indented, with numerous islands and islets. The maximum extent of the mainland is approximately 300 km from north to south and 270 km from east to west (FAO, 2025).
The straight baselines established in 1985 define the maritime boundaries of Guinea-Bissau, starting from the Bijagós Archipelago and the border with the Republic of Guinea. The maritime territory spans 107,301 km, of which 87,406 km correspond to the EEZ, 6184 km to territorial waters, and 13,711 km to internal waters, with a total volume of 208 billion m. About 60% of the marine area lies at depths shallower than 3000 meters (Pacheco, 2024).
2.2 Data sources
The data used in this study were provided by the Ministry of Fisheries of Guinea-Bissau through the National Institute for Monitoring and Control of Fisheries Activities (INFISCAP) and the National Institute for Fisheries and Oceanographic Research (INIPO), covering fishery-dependent records (onboard observation of commercial vessels) and fishery-independent records (scientific surveys in the EEZ).
2.2.1 Fishery-dependent data
The fishery-dependent component relied on the National Onboard Observer Program. The program includes nine primary certified observers (with designated alternates). Under Decree-Law No. 4/96 (August) and the conditions stipulated in vessel licenses, vessels engaged in fishing operations carried an onboard observer during the fishing season (typically 3–6 months), with observers deployed on a rotating basis across vessels. Observer coverage, defined as the number of licensed vessels carrying an observer divided by the total number of licensed vessels, averaged 72% and ranged from 50% to 81% (Supplementary Tab. S1).
For each haul, operational and catch variables are recorded, including geographic coordinates, depth, fishing duration (hours), gear type, and species-specific catches in kilograms. These records are formalized (boarding certificate) and submitted monthly to INIPO, where statistical technicians validate and consolidate the data for the Fisheries Yearbooks. Data collected between 2018 and 2023 formed the basis for the spatiotemporal characterization of the fishery and for the catch and effort series by gear and fleet segment.
As part of the Scientific Observation Program, biological samples were also collected directly from the catches, totaling 732 samples over the study period. Measurements include, among others, total length (cm), sex, and gonad maturity stage. In this study, length data of T. trecae collected between 2021 and 2023 were used to describe population size structure and support growth parameter estimation and stock assessment.
2.2.2 Fishery-independent data
The fishery-independent component comprises scientific resource assessment surveys conducted in the EEZ, coordinated by INIPO's Marine Resources Division. These surveys use standardized bottom trawls with controlled duration and speed and stratified sampling by depth (Supplementary Fig. S1). These surveys lacked standardized spatial and temporal coverage, with irregular sampling in both space and time, data gaps across different observer programs, and inconsistencies across databases such as conflicting species naming. In addition, the species' schooling behavior further complicates the use of abundance surveys, as it implies time-varying catchability that is difficult to account for without high-resolution data (Sobrino et al., 2022). Because of these uncertainties caused by irregular study design and data conflicts, we decided not to include relative abundance data in this study. For this study, 2025 survey data was only used to estimate the length-weight relationship and length at 50% maturity, as sampling during this year was considered reliable. Total length was measured to the nearest 0.1 cm using an ichthyometer and weight to the nearest 0.1 g using a balance. Gonads were macroscopically staged according to Maier's eight-point maturity key (Maier, 1908; Tab. 1), a typical and fairly satisfactory system for total spawners (Holden and Raitt, 1974). Maturity estimates were provided both separately and grouped by sex.
Macroscopic gonadal maturity scale used in this study (Maier, 1908), with stage codes and corresponding descriptions.
2.3 Data analysis
2.3.1 Fishery characterization
We derived descriptive indicators to support the spatiotemporal analysis of fishing activity: (i) annual catch of T. trecae (tonnes) by country, obtained by summing haul-level catches attributed to vessel flags; (ii) annual number of vessels with positive records of T. trecae by country, determined by counting unique vessel identifiers; (iii) annual spatial distribution of catches, mapped based on haul coordinates; (iv) monthly catch (tonnes) by gear type; and (v) monthly effort (fishing hours) by gear type. Fishing effort was defined as the total fishing hours per gear type combination, and vessel flag was used to assign national attribution in fleet-level aggregations.
2.3.2 Weight–length relationship
The weight–length relationship was estimated for combined sexes using biological data from the 2025 scientific survey. The exponential model  was fitted, where W is total weight (g), L is total length (cm), a is the scaling coefficient, and b is the allometric exponent (Froese, 2006). Natural logarithmic transformation was applied to linearize the model:

Parameters were estimated by ordinary least squares. Original-scale values were obtained by back-transformation:  , and b equals the slope. 95%confidence intervals (95% CI) were estimated for both parameters. The isometry hypothesis (
 ) was tested using a t-test with
  (rejected when P < 0.05). Model fit quality was assessed using the coefficient of determination
  , interpreted as the proportion of variance in
  explained by
  . Analyses were conducted in R (R Core Team, 2025), using the stats package.
2.3.3 Length structure
After filtering out implausible values, individuals were grouped into 1 cm classes defined by integer boundaries covering the full observed range. For each year, frequency distributions were constructed to describe the size composition of the catches.
To align these distributions with annual total landings, a raising procedure was applied. Mean weight per class was estimated using the weight–length relationship derived in this study, and annual raising factors were calculated such that the weighted sum of weights per class matched reported total landings. The resulting raised distributions represent the size composition of landings for each year.
2.3.4 Length at maturity
The length at maturity ( ) was defined as the length at which an individual has a 50% probability of being mature. Estimates were obtained for pooled sexes and both males and females separately.
The data were collected during a research survey in Guinea-Bissau's EEZ. Although surveys can introduce seasonal bias when sampling is restricted to narrow time windows, in this case, the data covered February to April, coinciding with the species' main reproductive period (Ndjaula et al., 2013; Baião, 2015), ensuring that both mature and immature individuals were present – an essential condition for robust  estimation.
Individuals classified as stages I–II were considered immature, and those in stages IV–VII mature. Stage III, whose descriptive attributes indicate immaturity (Tab. 1), was excluded from the analysis because exploratory analyses showed its length distribution overlapped that of mature fish, increasing misclassification risk and degrading the model fit.
A logistic regression was fitted to the binary maturity classification (0 = immature, 1 = mature) using the model:

where L is total length (1-cm class interval),  is the intercept, and
  is the slope. The length at 50% maturity was calculated as:

Estimation was performed in R using the sizeMat package (Torrejon-Magallanes, 2020). Uncertainty was quantified by implementing a non-parametric bootstrapping procedure with 999 iterations with a 95% CI reported for  . For each iteration, a random sample (n) was drawn with replacement equal to the total number of available data points for each group (Ncombined = 310, Nfemales = 141, Nmales = 169). All 999 iterations were retained.
2.3.5 Growth parameters
Growth parameters were estimated using the von Bertalanffy growth function (von Bertalanffy, 1938):

where  is the length at age t (years),
  is the asymptotic length (cm), i.e., the length that individuals would approach if growth continued indefinitely; K is the growth coefficient (yr−1); and
  is the theoretical age at which length would be zero.
Length frequency data from individuals sampled between 2021 and 2023 under the Scientific Observation Program were aggregated into 2 cm classes. The growth function was fitted using the Electronic Length Frequency Analysis (ELEFAN) method, optimized with a genetic algorithm via the R package TropFishR (Taylor and Mildenberger, 2017). Uncertainty was quantified by bootstrap (n = 200) with replacement using the fishboot package (Schwamborn et al., 2019), yielding empirical distributions and 95% CI for  and K.
A plus group was defined at 46.5 cm, grouping all individuals ≥46.5 cm into the final length class. This was done to reduce instability in the distribution tails and prevent sparse counts from distorting the model fit.
2.3.6 Natural mortality
Natural mortality (M), defined as the mortality rate from causes other than fishing (e.g., predation, disease, senescence, and environmental variability), was estimated using empirical methods (Tab. 2), given the impracticality of direct measurement in the wild. Input parameters included the von Bertalanffy growth coefficients ( , K) and maximum longevity (
 ), approximated as
  (Pauly, 1983). To reduce the influence of outliers and obtain a more robust reference value, the final estimate of M was taken as the median of values obtained from the different equations.
Empirical methods used to estimate natural mortality (M) of Trachurus trecae in Guinea-Bissau.
2.3.7 Stock status assessment
Stock status was assessed using LBI with catch length frequency data (Scientific Observation Program, 2021–2023) and compared to predefined reference points. For each year, we used the length distributions (Sect. 2.3.3) along with the estimated life-history parameters: length at maturity ( , Sect. 2.3.4), von Bertalanffy growth parameters (
 and K, Sect. 2.3.5), and natural mortality (M, Sect. 2.3.6). Lengths were grouped into 2 cm classes.
  ,
,  , and
, and  were obtained directly from the annual length distributions.
  , the length at first capture was inferred from the descending limb of the length distribution (Tab. 3; ICES, 2015). For these analyses, we used the length at maturity estimate for pooled sexes.
Indicator ratios were then compared with theoretical expectations associated with three objectives: conservation (“let them spawn” and “let the mega-spawners live”), yield optimization (“let them grow”), and proximity to MSY-compatible conditions (Tab. 3). Results were presented using a traffic-light scheme (green = meets objective, red = does not), following literature conventions (Caddy et al., 2005).
To determine how uncertainty in input parameters affects the length-based indicators, we performed sensitivity analyses by iteratively changing M/K, length at maturity, and L∞ values up and down 5%, 10%, 15%, 20%, and 25% from the default values, one at a time while keeping the others constant. For each indicator, % deviations from the baseline scenario were calculated (Santos et al., 2026). We did not include the parameters of the length-weight relationship in the analyses, as changes in the exponent will not affect the relative contribution of each length class to the total numbers according to our raising procedure used to align the length compositions with reported landings.
Length-based indicators (LBI) used to assess the stock status of Trachurus trecae in Guinea-Bissau.
2.3.8 Rules about the number of significant digits
Statistical software provides numbers with as many digits as allowed by the computational environment, which can imply a false level of precision relative to the natural variability common in biological data. To avoid reporting unrealistic levels of precision while preserving the mathematical correctness of our models, we report quantities expressed in kilotonnes (thousands of tonnes), for example, with a maximum of one decimal degree.
3 Results
3.1 Fishery characterization
3.1.1 Annual catches
Between 2018 and 2023, T. trecae catches within Guinea-Bissau's EEZ totalled 117 kt, with annual values of 17, 19, 29, 22, 19, and 10 kt. Catch distribution by country was highly concentrated, with China accounting for 57.2% of the total and Guinea-Bissau for 22.6% (Fig. 1).
China maintained consistently high catch volumes between 2018 and 2022 (11.6–12.7 kt/yr), followed by a reduction to 7 kt in 2023, representing a − 38.7% decrease compared to 2020. Guinea-Bissau recorded between 3 and 5.3 kt/yr with a declining trend at the end of the series. The third-highest contribution came from Comoros, due to a single large event in 2020 (10 kt). Spain ranked fourth overall, peaking in 2020 with 3.8 kt. Additional records included Cameroon (2.3 kt in 2021) and Russia (2 kt in 2019), along with several minor contributors such as Senegal. Other countries – Angola, Ivory Coast, Gambia, Guinea, South Korea, Italy, Mauritania, Morocco, Palau, Samoa, and São Tome – were recorded in isolated years with low catch volumes.
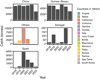 |
Fig. 1 Annual catch of Trachurus trecae (tonnes) by country in the coastal zone of Guinea-Bissau, 2018–2023. |
3.1.2 Number of vessels
From 2018 to 2023, 179 distinct vessels were identified as active in the T. trecae fishery. Of these, China accounted for 100 (54.3%), Guinea-Bissau 25 (13.6%), Senegal 15 (8.2%), and Spain 14 (7.6%). Other countries included Comoros (5 vessels); Guinea (4); Cameroon and Russia (3 each); Belize, Gambia, and Mauritania (2 each); and Angola, Italy, Ivory Coast, South Korea, Morocco, Palau, Samoa, and São Tome (1 each). Annually, China maintained the largest fleet presence, with 46, 49, 69, 75, 58, and 43 vessels from 2018 to 2023, respectively (Fig. 2). Guinea-Bissau registered 8–16 vessels per year. Spain participated from 2019 to 2023, with declining numbers over time. Senegal increased its presence until 2022 but was absent in 2023. Other countries were present only sporadically.
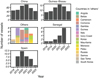 |
Fig. 2 Annual number of vessels by country landing Trachurus trecae in the coastal zone of Guinea-Bissau, 2018–2023. |
3.1.3 Catch areas
Annual catch maps (2018–2023) revealed a consistent spatial pattern, with catches concentrated between 10–12°N and 16–18°W, roughly aligned with the 17°W meridian (Fig. 3). In 2020, a notable peak occurred in the northern portion of this core area (≈12°N). In other years, the distribution remained centered within this band, with lower catch levels and no major spatial shifts. Peripheral areas were observed intermittently, varying in extent and intensity.
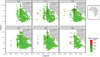 |
Fig. 3 Spatial distribution of annual Trachurus trecae catches (tonnes) in the coastal zone of Guinea-Bissau, 2018–2023. The black point in the 2020 panel represents an outlier where catches equaled 3285 tonnes. |
3.1.4 Fishing gears
Trachurus trecae was captured using four main gear types between 2018 and 2023. Demersal trawls contributed the largest share, with 58.7 kt (52.1% of total T. trecae catch) and 307,691 h of effort (61.7%). Pelagic trawls accounted for 36.7 kt (32.6%) and 49,232 h (9.9%); cephalopod trawls for 14.1 kt (12.6%) and 126,659 h (25.4%); and shrimp trawls for 3 kt (2.7%) and 15,420 h (3.1%).
Annual peak catches of T. trecae by gear type occurred in 2022 for demersal trawls (13.2 kt) and in 2020 for pelagic (10.9 kt), cephalopod (10 kt), and shrimp trawls (2.6 kt). Maximum fishing effort followed similar patterns: demersal trawls in 2022 (75,396 h), cephalopod and shrimp trawls in 2020 (72,149 and 11,521 h, respectively), and pelagic trawls in 2019 (11,179 h).
Monthly catch and effort patterns showed higher values between January and May, followed by a marked decline from June onward (Figs. 4 and 5). Demersal trawls reached peak catches in March (13.2 kt) and April (13 kt), with the highest effort in the same months. Pelagic trawl catches peaked in February (7.5 kt) and May (6.2 kt), with effort concentrated in May and March. Cephalopod trawls recorded peak T. trecae catches in March (3.3 kt) and April (2.4 kt), with the highest effort in April (18,838 h) and March (16,072 h). Shrimp trawls contributed mainly in 2020, with peak catches in April (638 t) and May (595 t).
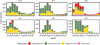 |
Fig. 4 Monthly catch of Trachurus trecae (tonnes) by gear type in the coastal zone of Guinea-Bissau, 2018–2023. |
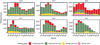 |
Fig. 5 Monthly fishing effort directed at Trachurus trecae (hours) by gear type in the coastal zone of Guinea-Bissau, 2018–2023. |
3.2 Weight–length relationship
The weight–length relationship of T. trecae (Fig. 6) was described by the model  , with
  (95% CI: 0.014–0.019) and
  (95% CI: 2.75–2.84). The exponent b was significantly less than 3 (t = − 9.129; P < 0.001), indicating negative allometry. The model showed high explanatory power (R2 = 0.98, n = 311).
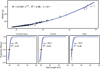 |
Fig. 6 Length-weight relationship (top) and maturity ogives (bottom) for Trachurus trecae were estimated from specimens collected during the 2025 scientific survey off the coast of Guinea-Bissau. Lines represent the expected value, while shaded areas are the 95% confidence intervals for the mean predicted weight at a given length. |
3.3 Length at maturity
The logistic models showed reasonable fits to the maturity data for grouped sexes (R2 = 0.54), females (R2 = 0.63), and males (R2 = 0.48). The estimated length at first maturity for T. trecae was 20.0 cm for grouped sexes (95% CI: 19.6–20.3 cm), 20.5 for females (95% CI: 20–20.9 cm), and 19.6 for males (95% CI: 18.7––20.1 cm) (Fig. 6).
3.4 Length composition
Length–frequency distributions varied across years (Fig. 7). In 2021, lengths of T. trecae ranged from 15–49 cm, showing a multimodal pattern with high frequencies in the 25–35 cm range and the presence of larger individuals (≥40 cm). In 2022, the range was 16–45 cm, with a wide but irregular distribution. In 2023, lengths ranged from 22 to 36 cm, with most individuals between 24 and 28 cm and limited occurrence of larger sizes.
 |
Fig. 7 Length-frequency distribution (2-cm class interval) of Trachurus trecae in the coastal zone of Guinea-Bissau, 2021–2023. |
3.5 Growth parameters
Based on aggregated length-frequency data from 2021 to 2023, von Bertalanffy growth parameters for T. trecae were estimated as L∞ = 48.8 cm (95% CI: 46.4–52.2 cm) and K = 0.55 yr−1 (95% CI: 0.34–0.74 yr−1) (Fig. 8). The distribution of estimates showed a well-defined peak for  and greater dispersion for K, indicating more uncertainty in the latter.
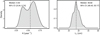 |
Fig. 8 Estimated density distributions for von Bertalanffy growth parameters of Trachurus trecae obtained by bootstrap resampling (n = 200) using the ELEFAN method. Black dashed lines represent the median estimate. |
3.6 Natural mortality
Estimated values for natural mortality (M, yr−1) were: 0.46 (Alverson and Carney, 1975); 0.60 and 0.58 (Hoenig, 1983); 1.02 (Pauly, 1980); 0.79 and 0.74 (Then et al., 2015). The median value was 0.67.
3.7 Stock status
LBI for T. trecae in 2021–2023 highlight three main points. For immature conservation, both 2021 and 2023 met reference points, with Lc/L50 and L25%/L50 above the threshold. In 2022, Lc/L50 fell below the reference (0.85), although L25%/L50 remained at 1.25. For the conservation of large spawners, 2021 met both criteria (Lmax5%/L∞; Pmega). In 2022, only Lmax5%/L∞ was met (0.92), while Pmega was very close to the threshold. In 2023, neither criterion was met. For yield and MSY compatibility, Lmean/Lopt was above the target in 2021 (1.16) and at the target in 2022 (1), falling below in 2023 (0.93). Lmean/LF = M indicated MSY-compatible levels in 2021 and 2022 (1.25–1.30) but fell below the threshold in 2023 (0.93). Thus, 2021 met all reference points. In 2022, indicators failed for immature conservation and large spawner preservation, while yield was suboptimal though still compatible with MSY. In 2023, indicators for large spawners and yield fell below expected values (Tab. 4).
Sensitivity analyses on the length-based indicators showed moderate-high deviations from the baseline scenario, with increased divergences as input parameters further deviate from the default. Pmega was the most sensitive indicator, with close to 40% deviation from the base scenario when L∞ is varied by 10%, up to 100% deviation with 25% change. Effects of varying L∞ on Pmega were asymmetrical, with a higher impact from positive biases Varying M/K also had a large but symmetrical impact on Pmega, with up to 50% deviations from baseline when M/K is negatively or positively biased by 25%. The remaining indicators were also moderately sensitive to changes in the length at maturity and L∞, but not M/K (Fig. 9).
Sensitivity analyses on the length-based indicators showed moderate-high deviations from the baseline scenario, with increased divergences as input parameters further deviate from the default. Pmega was the most sensitive indicator, with close to 40% deviation from the base scenario when L∞ is varied by 10%, up to 100% deviation with 25% change. Effects of varying L∞ on Pmega were asymmetrical, with a higher impact from positive biases. Varying M/K also had a large but symmetrical impact on Pmega, with up to 50% deviations from baseline when M/K is negatively or positively biased by 25%. The remaining indicators were also moderately sensitive to changes in the length at maturity and L∞, but not M/K (Fig. 9).
Length-based indicator status for Trachurus trecae in Guinea-Bissau, 2021–2023. Green cells indicate values within expected reference ranges (sustainable), while red cells indicate potential overexploitation.
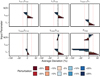 |
Fig. 9 Sensitivity of LBI indicators to input parameter variability. The x-axis represents the percentage deviation from the baseline scenario following iterative changes of −25, −20, −15, −10, −5, +5, +10, +15, +20, and +25% in M/K, length at maturity, and L∞, applied one at a time while keeping the remaining parameters constant. |
4 Discussion
This study assesses exploitation patterns and stock status of T. trecae in the EEZ of Guinea-Bissau from 2018 to 2023. Spatially, fishing activity was concentrated between 10–12°N and 18–16°W, an area characterized by high coastal productivity due to nutrient-rich upwelling, freshwater inputs, and estuarine exchange (Barri, 2008; Yraola et al., 2025). These environmental features support feeding, growth, and reproduction but also attract concentrated fishing effort, particularly between February and April, coinciding with the reproductive peak. This temporal overlap exacerbates the risk of recruitment overfishing (Cury and Roy, 1989; de Mitcheson et al., 2008).
Biologically, T. trecae is a benthopelagic carangid distributed from Morocco to Angola (Bianchi et al., 1999; Smith-Vaniz et al., 2015), typically occurring between 47 and 340 m depth, with occasional records near 900 m (Yraola et al., 2025). Although specific studies on T. trecae are lacking, closely related species such as T. trachurus and T. mediterraneus show clear ontogenetic shifts in habitat, with juveniles inhabiting shallower coastal waters and adults moving to deeper offshore zones (Abaunza et al., 2003; Rodríguez, 2016). Due to the taxonomic proximity to these species, juveniles of T. trecae might also be more likely to inhabit coastal areas before migrating to the deep. This age-related spatial segregation increases the vulnerability of juveniles to fishing pressure, particularly given that fishing activity in this study was concentrated in coastal areas where juveniles are likely to occur, raising concerns about the potential for growth and recruitment overfishing. Functionally, the species occupies an intermediate trophic level, facilitating energy transfer between lower and higher trophic levels; therefore, fluctuations in its abundance can have cascading effects throughout the food web, with implications for both ecosystem dynamics and fisheries productivity (Cury et al., 2000).
The species' strong schooling behavior adds complexity to assessment efforts, as aggregation influences catchability and can distort abundance estimates derived from fishery-dependent data (Hilborn and Walters, 1992). Catch per unit effort (CPUE) is often used as a proxy for abundance; however, its reliability is contingent on appropriate standardization. Without accounting for factors such as gear type, fishing area, seasonality, and fleet composition, CPUE may reflect changes in fishing efficiency rather than true biomass trends. Standardized indices using generalized linear or additive models are therefore recommended to isolate effort-related variability and provide more robust abundance indicators (Hoyle et al., 2024). However, due to severe sampling inconsistencies in the fishery-independent data, we were unable to use it to derive stock status. As sampling programs aiming to provide estimates of relative abundance are underway, future years with standardized sampling effort will become increasingly available to provide information on stock status as data conflicts are resolved and potential flaws in study design are addressed. We recommend this abundance data should be used in conjunction with other available information to build an ensemble of integrated models that vary in assumptions and data requirements to provide a more comprehensive assessment of stock status and its associated uncertainty. Gear-specific dynamics revealed substantial differences in effort allocation, catch volume, and selectivity. Demersal trawls contributed the majority of T. trecae catches (52.1%) and accounted for 61.7% of total effort, indicating their dominant role in exploitation but also a lower catch efficiency relative to pelagic gears. Pelagic trawls, though responsible for a smaller share of catches (32.6%), operated with significantly less effort (9.9%), suggesting higher efficiency per unit of effort when targeting midwater aggregations. Cephalopod and shrimp trawls, responsible for 12.6% and 2.7% of catches, respectively, also recorded notable T. trecae bycatch, especially given their targeting of other species. These patterns highlight the importance of gear-specific management approaches that address both directed and incidental catch and account for differences in efficiency, selectivity, and ecological impact.
Temporal trends in length composition revealed a progressive truncation of the size distribution between 2021 and 2023, with more noticeable differences in 2023. While the 2021 distribution still encompassed a broad size range, including adults, modal structure weakened in 2022, and by 2023, catches were dominated by individuals near the length at maturity. The absence of larger individuals and the decline of Pmega (proportion of mega-spawners) suggest reduced reproductive capacity that could lead to recruitment overfishing. The species' life-history traits – fast growth (K = 0.55 yr−1), moderate/small asymptotic length (L∞ = 48.82), high fecundity, and short lifespan (as per the high natural mortality) – are characteristic of r-strategists, which generally display high turnover and higher resilience under moderate fishing pressure (Quetglas et al., 2016). However, such resilience is contingent on maintaining a sufficient spawning biomass and avoiding persistent removal of mature individuals, particularly during peak reproductive periods (King and McFarlane, 2003).
Natural mortality (M = 0.668 year−1) falls within expected ranges for small tropical pelagics (Pauly, 1980; Then et al., 2015) and implies lower standing biomass and high turnover. Yet, the high population productivity does not ensure sustainability in the absence of management, particularly given the loss of large spawners and the seasonal targeting of reproductive aggregations. LBI show a clear downward trend: values in 2021 were consistent with sustainable exploitation, but those from 2022 and 2023 indicate overfishing could have occurred during these years, with declining Lmean/Lopt and Lmean/LF = M ratios and Pmega reaching zero by 2023. These findings align with earlier assessments of T. trecae in Guinea-Bissau, which reported fluctuations in catch levels, seasonal pulses in availability, and signs of overfishing. For instance, biomass estimates in 2020 from a surplus production model using fishery-dependent CPUE placed the stock slightly above BMSY (biomass at maximum sustainable yield), while fishing mortality (F) exceeded FMSY by approximately 46%, suggesting overexploitation (Sobrino et al., 2022). As shown by the sensitivity analysis, the high uncertainty in life history traits considerably affects LBI outputs and therefore stock status, warranting a precautionary approach to management going forward and increased data collection to further refine life history parameters. Our results agree with previous literature showing length-based models are highly sensitive to input parameters (Santos et al., 2026; Medeiros-Leal et al., 2023).
A similar overfishing status has been reported in other regions of West Africa, particularly in an assessment covering the area from the southern border of Senegal to the northern Atlantic border of Morocco, including the Canary Islands (FAO, 2020). However, these findings contrast with an evaluation focused specifically on Senegalese waters, which reported stocks in good condition (Baldé et al., 2022). This discrepancy likely reflects differences in geographic coverage, species migratory behavior, and assessment methodologies. While the FAO (2020) used the Schaefer Dynamic Production Model, the study by Baldé et al. (2022) applied the Length-based Bayesian Biomass (LBB) model (Froese et al., 2018), which has been increasingly questioned due to its assumptions and sensitivity in data-limited and spatially dynamic fisheries (Pons et al., 2020; Wang et al., 2025).
In Guinea-Bissau, the interpretation of both the present study and the assessment by Sobrino et al. (2022) must consider methodological limitations. Earlier studies were affected by effort aggregation across fleets, assumptions of constant catchability (q), and limited standardization of fishery-dependent abundance indices – each of which can distort reference point estimates. Similarly, length-based methods are sensitive to the choice of life-history parameters, particularly L∞ and the M/K ratio. The present study estimated L∞ at 48.82 cm and K at 0.55 yr−1, values higher than those reported for Mauritania, Senegal, and Angola (Ba et al., 1990; Baião, 2015; Baldé et al., 2022), yet biologically plausible for the region.
Recent findings by Medeiros-Leal et al. (2023) highlight the susceptibility of certain LBIs – especially Pmega and Lmax5%/L∞ – to bias in the initial selection of L∞ and M/K, whereas indicators of immature individual protection (e.g., Lc/Lmat, L25%/Lmat) are less affected. In particular, Pmega was shown to be the most sensitive indicator to growth input uncertainty, while MSY-related metrics were comparatively robust. Given these insights, the declining trend in Pmega observed here should be interpreted cautiously, although the consistency with multiple complementary indicators (including Lmean/Lopt and Lmean/LF = M) strengthens the overall conclusion of increasing exploitation pressure. Future work should incorporate uncertainty analysis or Bayesian frameworks to quantify the impact of input variation and enhance reliability in length-based stock assessments.
Management of T. trecae in Guinea-Bissau occurs within a legal-administrative national framework oriented toward sustainable use. Key instruments include the General Fisheries Law (Decree-Law No. 10/2011; Republic of Guinea-Bissau, 2011), specific regulations for industrial and artisanal fleets, minimum landing sizes, and seasonal closures introduced in 2022. Total allowable catches (TACs) and quotas are defined by fleet category and supported by the National Institute for Fisheries and Oceanographic Research (INIPO), which contributes scientific and statistical inputs (Republic of Guinea-Bissau, 2022). Satellite-based vessel monitoring systems (VMS), electronic reporting (ERS), and traceability requirements have also been implemented under international agreements such as the Sustainable Fisheries Partnership Protocol with the European Union (Council of the European Union, 2007; EU, 2024). Guinea-Bissau is further engaged in regional and international mechanisms, including the Sub-Regional Fisheries Commission (CSRP), which promotes harmonized legislation and regional cooperation, and the United Nations Convention on the Law of the Sea (UNCLOS), which outlines sovereign and shared responsibilities for the conservation of marine resources within the EEZ (UN, 1982; CSRP, 2014). Despite these advances, effective implementation remains limited by persistent structural challenges, such as insufficient institutional capacity, weak enforcement, and gaps in data transparency.
Interpretation of the length-based results should be restricted to the Guinea-Bissau assessment area represented by the available data. Because biological stock boundaries are not estimated in this study, connectivity with adjacent waters or within-area spatial structure cannot be excluded and may influence local size composition through movement and availability. In such circumstances, pooled length indicators may mask spatially structured depletion or overstate local trends if availability changes independently of underlying biomass. Evidence of non-panmixia reported elsewhere for T. trecae supports treating the present inference as area-specific and motivates future stock identification work in the region to strengthen management advice (Sardinha and Nævdal, 2002; Mota et al., 2024).
Within this assessment area, the exploited component of T. trecae within Guinea-Bissau's EEZ shows clear signs of overexploitation. Progressive truncation of the size structure and the decline in length-based indicators, together with the predominance of immature individuals, indicate increasing fishing pressure and reduced reproductive capacity. Despite life-history traits associated with relatively high turnover, sustained removals during peak reproductive periods, combined with weak enforcement and limited management effectiveness, are likely to undermine sustainability. Reversing this trend will require effective implementation of science-based management measures such as fishery closures, effort controls, and improved gear selectivity. Strengthened monitoring relies on enhanced institutional capacity and regional cooperation, critical to securing the long-term viability of this economically and ecologically important resource.
Acknowledgments
The authors thank all who participated in data collection in the fisheries sector and during the scientific surveys. They also thank Dr. Iça Barri from INIPO – Instituto Nacional de Investigação, Pesquisa e Oceanografia of Guinea-Bissau for his collaboration. OKEANOS research unit received national funds through the FCT - Fundação para a Ciência e Tecnologia, I.P. by project reference UID/05634/2025 (DOI: 10.54499/UID/05634/2025), and from the Regional Directorate for Science, Innovation and Development of the Azores Government through the PROSCIENTIA Incentive System under project M1.1.A/FUNC.UI&D/014/2025. Work supported by National Funds through FCT-Fundação para a Ciência e a Tecnologia in the scope of the project UID/50027/2025-Rede de Investigação em Biodiversidade e Biologia Evolutiva and Azorean regional funds through DRCID (M1.1.A/FUNC.UI&D/015/2025/RTF/001/Apoio UI&D).
Conflicts of interest
The authors declare no conflict of interest.
Data availability statement
The data that support the findings of this study are available from the corresponding author upon reasonable request.
Ethics approval
No ethical approval was required as this study is non-experimental.
Supplementary Material
Table S1. Annual coverage of licensed vessels by the onboard observer program from 2018 to 2023. Values are the number of vessels monitored with onboard observers and the total number of licensed vessels operating in each year.
Fig. S1. Sampling stations of the Scientific Resource Assessment Survey in Guinea-Bissau's EEZ, coordinated by INIPO (Fisheries Resources Service).
Access Supplementary MaterialReferences
- Abaunza P, Gordo L, Karlou-Riga C, Murta A, Eltink ATGW, García Santamaría MT, Zimmermann C, Hammer C, Lucio P, Iversen SA, Molloy J, Gallo E. 2003. Growth and reproduction of horse mackerel, Trachurus trachurus (Carangidae). Rev. Fish Biol. Fish. 13: 27–61. [Google Scholar]
- Alverson DL, Carney MJ. 1975. A graphic review of the growth and decay of population cohorts. J. Cons. Int. Explor. Mer. 36: 133–143. [Google Scholar]
- Ba I, Mylnikov N, Djigo Y. 1990. Détermination de l'âge des chinchards (Trachurus trachurus et Trachurus trecae) de la ZEE mauritanienne par otolithométrie. Bull. Sci. CNROP. 21: 7–14. [Google Scholar]
- Baião NF. 2015. Crescimento, ecologia alimentar e reprodução de Trachurus trecae (Cadenat, 1949), na costa sul de Angola–Namibe. Master thesis, Universidade do Algarve. [Google Scholar]
- Baldé BS, Brehmer P, Diaw PD. 2022. Length-based assessment of five small pelagic fishes in the Senegalese artisanal fisheries. PLOS One. 17: e0279768. [Google Scholar]
- Barri I. 2008. Recursos pesqueiros, estuarinos e marinhos da Guiné-Bissau. Dissertação de mestrado, Universidade de Aveiro. [Google Scholar]
- Barros M de (Ed.), Carvalho F, Menut A. 2021. Diagnosis of the fisheries situation in Guinea-Bissau. Ministry of Fisheries, Republic of Guinea-Bissau. [Google Scholar]
- Belhabib D, Greer K, Pauly D. 2018. Trends in industrial and artisanal catch per effort in West African fisheries. Conserv. Lett. 11: e12360. [Google Scholar]
- Belhabib D, Sumaila UR, Pauly D. 2015. Feeding the poor: Contribution of West African fisheries to employment and food security. Ocean Coast. Manag. 111: 72–81. [Google Scholar]
- Béné C, Barange M, Subasinghe R, Pinstrup-Andersen P, Merino G, Hemre G-I, Williams M. 2015. Feeding 9 billion by 2050–Putting fish back on the menu. Food Secur. 7: 261–274. [Google Scholar]
- Bianchi G, Carpenter KE, Roux J-P, Molloy FJ, Boyer D, Boyer HJ. 1999. FAO species identification guide for fishery purposes: Field guide to the living marine resources of Namibia. Rome, FAO. [Google Scholar]
- Caddy JF, Wade E, Surette T, Hebert M, Moriyasu M. 2005. Using an empirical traffic light procedure for monitoring and forecasting in the Gulf of St. Lawrence fishery for the snow crab, Chionoecetes opilio. Fish. Res. 76: 123–145. [Google Scholar]
- Cheung WWL, Lam VWY, Sarmiento JL, Kearney K, Watson R, Pauly D. 2009. Projecting global marine biodiversity impacts under climate change scenarios. Fish Fish. 10: 235–251. [Google Scholar]
- Council of the European Union. 2007. Council Decision of 4 December 2007 concerning the conclusion of the Agreement in the form of an Exchange of Letters on the provisional application of the Protocol setting out the fishing opportunities and financial contribution provided for in the Fisheries Partnership Agreement between the European Community and the Republic of Guinea-Bissau for the period 16 June 2007 to 15 June 2011 (2007/854/EC). Off. J. Eur. Union L 342: 1–2. [Google Scholar]
- CSRP. 2014. Strategy to combat IUU fishing in the CSRP zone. Sub-Regional Fisheries Commission, Department of Monitoring and Control of Fisheries Management (DSCSA), Banjul, Gambia. [Google Scholar]
- Cury PM, Bakun A, Crawford RJM, Jarre A, Quiñones RA, Shannon LJ, Verheye HM. 2000. Small pelagics in upwelling systems: Patterns of interaction and structural changes in “wasp-waist” ecosystems. ICES J. Mar. Sci. 57: 603–618. [Google Scholar]
- Cury P, Roy C. 1989. Optimal environmental window and pelagic fish recruitment success in upwelling areas. Can. J. Fish. Aquat. Sci. 46: 670–680. [Google Scholar]
- De Mitcheson YS, Cornish A, Domeier M, Colin PL, Russell M, Lindeman KC. 2008. A global baseline for spawning aggregations of reef fishes. Conserv. Biol. 22: 1233–1244. [Google Scholar]
- Dittel ML. 2022. Fishy business: How the sustainable fishery partnership agreement between the European Union and Guinea-Bissau delays fulfillment of human rights obligations. Undergraduate thesis, Columbia University, Institute for the Study of Human Rights. [Google Scholar]
- EU. 2024. Protocol on the implementation of the Fisheries Partnership Agreement between the European Community and the Republic of Guinea-Bissau (2024–2029). Off. J. Eur. Union L 2589: 1–42. [Google Scholar]
- FAO. 2020. Report of the FAO Working Group on the Assessment of Small Pelagic Fish off Northwest Africa, Banjul, the Gambia, 26 June–1 July 2018. FAO Fish. Aquac. Rep. R1247, Rome, FAO. [Google Scholar]
- FAO. 2025. Fishery and Aquaculture Country Profiles: Guinea-Bissau (2018). Fisheries and Aquaculture Division, Rome, FAO. [Google Scholar]
- FAO. 2024. The state of world fisheries and aquaculture 2024: Blue transformation in action. Rome, FAO. [Google Scholar]
- Free CM, Thorson JT, Pinsky ML, Oken KL, Wiedenmann J, Jensen OP. 2019. Impacts of historical warming on marine fisheries productivity. Science. 363: 979–983. [Google Scholar]
- Froese R. 2004. Keep it simple: Three indicators to deal with overfishing. Fish Fish. 5: 86–91. [Google Scholar]
- Froese R. 2006. Cube law, condition factor and weight–length relationships: History, meta-analysis and recommendations. J. Appl. Ichthyol. 22: 241–253. [CrossRef] [Google Scholar]
- Froese R, Winker H, Coro G, Demirel N, Tsikliras AC, Dimarchopoulou D, Scarcella G, Probst WN, Dureuil M, Pauly D. 2018. A new approach for estimating stock status from length-frequency data. ICES J. Mar. Sci. 75: 2004–2015. [Google Scholar]
- Goodman MC, Reum JCP, Barnes CL. 2025. Climate covariate choice and uncertainty in projecting species range shifts: A case study in the Eastern Bering Sea. Fish Fish. 26: 389–403. [Google Scholar]
- Gushchin AV, Corten A. 2017. Feeding of pelagic fish in waters of Mauritania: 3–Atlantic chub mackerel (Scomber colias), Atlantic horse mackerel (Trachurus trachurus), Cunene horse mackerel (Trachurus trecae). J. Ichthyol. 57: 410–423. [Google Scholar]
- Hilborn R, Walters CJ. 1992. Quantitative fisheries stock assessment: choice, dynamics and uncertainty. New York, Springer. [Google Scholar]
- Hoenig JM. 1983. Empirical use of longevity data to estimate mortality rates. Fish. Bull. 82: 898–903. [Google Scholar]
- Holden MJ, Raitt DFS (Eds.). 1974. Manual of fisheries science. Part 2–Methods of resource investigation and their application. Rome, FAO. [Google Scholar]
- Hoyle SD, Campbell RA, Ducharme-Barth ND, Grüss A, Moore BR, Thorson JT, Tremblay-Boyer L, Winker H, Zhou S, Maunder MN. 2024. Catch per unit effort modelling for stock assessment: A summary of good practices. Fish. Res. 269: 106860. [Google Scholar]
- ICES. 2015. Report of the Fifth Workshop on the Development of Quantitative Assessment Methodologies based on Life-history Traits, Exploitation Characteristics and other Relevant Parameters for Data-limited Stocks (WKLIFE V), 5–9 October 2015, Lisbon, Portugal. ICES CM 2015/ACOM:56, 157 pp., Copenhagen, ICES. [Google Scholar]
- IMF. 2023. Guinea-Bissau: Request for a three-year arrangement under the Extended Credit Facility – Press release and staff report. IMF Staff Country Rep. 2023/087, Washington DC, IMF. [Google Scholar]
- Intchama JF, Belhabib D, Tomás Jumpe RJ. 2018. Assessing Guinea-Bissau's legal and illegal unreported and unregulated fisheries and the surveillance efforts to tackle them. Front. Mar. Sci. 5: 79. [Google Scholar]
- Jones S. 1992. Guinea-Bissau. In: Sayer JA, Harcourt CS, Collins NM (Eds.), The conservation atlas of tropical forests: Africa. London, Palgrave Macmillan, pp. 240–247. [Google Scholar]
- Kell LT, Sharma R. 2025. An evaluation of the robustness of length-based stock assessment approaches for sustainable fisheries management in data and capacity limited situations. Sustainability. 17: 4791. [Google Scholar]
- King JR, McFarlane GA. 2003. Marine fish life history strategies: Applications to fishery management. Fish. Manag. Ecol. 10: 249–264. [Google Scholar]
- Maier HN. 1908. Beiträge zur Altersbestimmung der Fische. I. Allgemeines. Die Altersbestimmung nach Otolithen bei Scholle und Kabeljau. Arb. Dtsch. Wiss. Komm. Meeresforsch. 5: 57–115. [Google Scholar]
- Medeiros-Leal W, Santos R, Peixoto UI, Casal-Ribeiro M, Novoa-Pabon A, Sigler MF, Pinho M. 2023. Performance of length-based assessment in predicting small-scale multispecies fishery sustainability. Rev. Fish Biol. Fish. 33: 819–852. [Google Scholar]
- Mota KG, Perazza CA, Vaz Velho F, Sardinha M L, Morais L, Vaini JO, Hallerman E, Hilsdorf AWS. 2024. Population genetic diversity of Cunene horse mackerel Trachurus trecae on the Angolan coast. Implications for management and conservation. Fish. Res. 277: 107069. [Google Scholar]
- Ndjaula H, Krakstad JO, Kjesbu O. 2013. Reproductive biology of horse mackerel Trachurus capensis and Trachurus trecae in Namibia and Angola. Afr. J. Mar. Sci. 35: 141–150. [Google Scholar]
- Okafor-Yarwood I. 2019. Illegal, unreported and unregulated fishing, and the complexities of the sustainable development goals (SDGs) for countries in the Gulf of Guinea. Mar. Policy. 100: 124–132. [Google Scholar]
- Pacheco MB. 2024. Medidas da terra e do mar da CPLP: Apontamento. 1ª ed., Lisboa, Edições da Marinha & Instituto Hidrográfico. [Google Scholar]
- Pauly D. 1980. On the interrelationships between natural mortality, growth parameters, and mean environmental temperature in 175 fish stocks. J. Cons. Int. Explor. Mer. 39: 175–192. [Google Scholar]
- Pauly D. 1983. Some simple methods for the assessment of tropical fish stocks. FAO Fish. Tech. Pap. 234, Rome, FAO. [Google Scholar]
- Pauly D, Belhabib D, Blomeyer R, Cheung WWL, Cisneros-Montemayor AM, Copeland D, Harper S, Lam VWY, Mai Y, Le Manach F, Österblom H, Mok KM, van der Meer L, Sanz A, Shon S, Sumaila UR, Swartz W, Watson R, Zhai Y, Zeller D. 2014. China's distant-water fisheries in the 21st century. Fish Fish. 15: 474–488. [Google Scholar]
- Pinsky ML, Reygondeau G, Caddell R, Palacios-Abrantes J, Spijkers J, Cheung WWL. 2018. Preparing ocean governance for species on the move. Science. 360: 1189–1191. [Google Scholar]
- Polidoro BA, Ralph GM, Strongin K, Harvey M. 2017. The status of marine biodiversity in the Eastern Central Atlantic (West and Central Africa). Aquat. Conserv. Mar. Freshw. Ecosyst. 27(S1): 106–120. [Google Scholar]
- Poloczanska ES, Burrows MT, Brown CJ, García Molinos J, Halpern BS, Hoegh-Guldberg O, Kappel CV, Moore PJ, Richardson AJ, Schoeman DS, Sydeman WJ. 2016. Responses of marine organisms to climate change across oceans. Front. Mar. Sci. 3: 62. [Google Scholar]
- Pons M, Cope JM, Kell LT. 2020. Comparing performance of catch-based and length-based stock assessment methods in data-limited fisheries. Can. J. Fish. Aquat. Sci. 77: 1026–1037. [Google Scholar]
- Popoola OO, Olajuyigbe AE. 2023. Operationalizing the blue economy in the Gulf of Guinea, Africa. Front. Polit. Sci. 5: 1070508. [Google Scholar]
- Quetglas A, Rueda L, Alvarez-Berastegui D, Guijarro B, Massutí E. 2016. Contrasting responses to harvesting and environmental drivers of fast and slow life history species. PLOS ONE. 11: e0148770. [Google Scholar]
- R Core Team. 2025. R: A language and environment for statistical computing. Vienna, R Foundation for Statistical Computing. [Google Scholar]
- Republic of Guinea-Bissau. 2011. Decree-Law No. 10/2011 approving the General Fisheries Law. Suppl. Bol. Of. Repub. Guiné-Bissau No. 23. [Google Scholar]
- Republic of Guinea-Bissau. 2022. Decree No. 21/2022 creating the National Institute for Fisheries and Oceanography Research (INIPO). Suppl. Bol. Of. Repub. Guiné-Bissau No. 48 (4th Suppl.), Part I: 1–13. [Google Scholar]
- Rodríguez JAC. 2016. Life history traits and spatial patterns of five mid-size pelagic fish species of the Gulf of Cadiz. Master's thesis, Universidad de Cádiz. [Google Scholar]
- Santos R, de Barros M, Medeiros-Leal W. 2026. Advancing stock assessment in the Azores through an ensemble approach based on length-based models. Reg. Stud. Mar. Sci. 96: 104859. [Google Scholar]
- Sardinha MI, Nævdal G. 2002. Population genetic studies of horse mackerel Trachurus trecae and Trachurus trachurus capensis off Angola. S. Afr. J. Mar. Sci. 24: 49–56. [Google Scholar]
- Schwamborn R, Mildenberger TK, Taylor MH. 2019. Assessing sources of uncertainty in length-based estimates of body growth in populations of fishes and macroinvertebrates with bootstrapped ELEFAN. Ecol. Model. 393: 37–51. [Google Scholar]
- Smith-Vaniz WF, Monteiro V, Camara K, Sidibe A, Sylla M. 2015. Trachurus trecae. The IUCN Red List of Threatened Species 2015: e.T21113110A43157620. [Google Scholar]
- Sobrino I, Intchama J, Lino PG. 2022. Relatório da 8ª Reunião do Comité Científico Conjunto sobre o Acordo de Parceria para Pesca Sustentável entre a República da Guiné-Bissau e a União Europeia. Centro de Investigação Pesqueira Aplicada (CIPA), Bissau, Guiné-Bissau. [Google Scholar]
- Taylor MH, Mildenberger TK. 2017. Extending electronic length frequency analysis in R. Fish. Manag. Ecol. 24: 230–238. [Google Scholar]
- Temudo MP, Cabral AI. 2017. The social dynamics of mangrove forests in Guinea-Bissau, West Africa. Hum. Ecol. 45: 307–320. [Google Scholar]
- Then AY, Hoenig JM, Hall NG, Hewitt DA. 2015. Evaluating the predictive performance of empirical estimators of natural mortality rate using information on over 200 fish species. ICES J. Mar. Sci. 72: 82–92. [Google Scholar]
- Torrejon-Magallanes J. 2020. sizeMat: An R package to estimate size at sexual maturity. Vienna, R Foundation for Statistical Computing. [Google Scholar]
- UN. 1982. United Nations Convention on the Law of the Sea. Montego Bay, Jamaica, United Nations. [Google Scholar]
- Virdin J, Kobayashi M, Akester S, Vegh T. 2019. West Africa's coastal bottom trawl fishery: Initial examination of a trade in fishing services. Mar. Policy. 108: 103632. [Google Scholar]
- von Bertalanffy L. 1938. A quantitative theory of organic growth (Inquiries on growth laws. II). Hum. Biol. 10: 181–213. [Google Scholar]
- Wang K, Zhang C, Ji Y, Xu B, Xue Y, Ren Y. 2025. Navigating life-history parameter uncertainty in data-limited fisheries: A comparative analysis of length-based stock assessment methods. Rev. Fish Biol. Fish. 35: 1711–1733. [Google Scholar]
- Yraola IS, Barri I, Cantos CB, Gomes JP, Dafé CS. 2023. Relatório da campanha de avaliação dos stocks demersais na Zona Económica Exclusiva da Guiné-Bissau. Ministério das Pescas – Centro de Investigação Pesqueira Aplicada (CIPA), Bissau, Guiné-Bissau. [Google Scholar]
- Yraola IS, Barri I, Jumpe RJT, Nbunde MA, Cantos CB, Dafé C, Jaló D, Trindade NL, Intchama JF. 2024. Relatório da campanha de avaliação dos stocks demersais na Zona Económica Exclusiva da Bissau 1123. Ministério das Pescas e Economia Marítima – Instituto Nacional de Investigação das Pescas e Oceanografia (INIPO), Cádiz, Espanha. [Google Scholar]
- Yraola IS, Barri I, N'Bundé MA, Jimenez JG, Cantos CB. 2019. Relatório da campanha de avaliação dos stocks demersais na Zona Económica Exclusiva da Guiné-Bissau. Ministério das Pescas – Centro de Investigação Pesqueira Aplicada (CIPA), Cádiz, Espanha. [Google Scholar]
- Yraola IS, Barri I, Nbundé MA, Cantos CB, Intchama JF, Gomes JP, Burgos MC. 2025. Relatório da campanha de avaliação dos stocks demersais na Zona Económica Exclusiva da Guiné-Bissau. Ministério das Pescas e Economia Marítima – Instituto Nacional de Investigação das Pescas e Oceanografia (INIPO), Bissau, Guiné-Bissau. [Google Scholar]
Cite this article as: Nonque D, de Barros M, Martins A, Santos R. 2026. Towards sustainable management of the Cunene horse mackerel (Trachurus trecae) in Guinea-Bissau waters. Aquat. Living Resour. 39: 16. https://doi.org/10.1051/alr/2026009
All Tables
Macroscopic gonadal maturity scale used in this study (Maier, 1908), with stage codes and corresponding descriptions.
Empirical methods used to estimate natural mortality (M) of Trachurus trecae in Guinea-Bissau.
Length-based indicators (LBI) used to assess the stock status of Trachurus trecae in Guinea-Bissau.
Length-based indicator status for Trachurus trecae in Guinea-Bissau, 2021–2023. Green cells indicate values within expected reference ranges (sustainable), while red cells indicate potential overexploitation.
All Figures
|
Fig. 1 Annual catch of Trachurus trecae (tonnes) by country in the coastal zone of Guinea-Bissau, 2018–2023. |
| In the text | |
|
Fig. 2 Annual number of vessels by country landing Trachurus trecae in the coastal zone of Guinea-Bissau, 2018–2023. |
| In the text | |
|
Fig. 3 Spatial distribution of annual Trachurus trecae catches (tonnes) in the coastal zone of Guinea-Bissau, 2018–2023. The black point in the 2020 panel represents an outlier where catches equaled 3285 tonnes. |
| In the text | |
|
Fig. 4 Monthly catch of Trachurus trecae (tonnes) by gear type in the coastal zone of Guinea-Bissau, 2018–2023. |
| In the text | |
|
Fig. 5 Monthly fishing effort directed at Trachurus trecae (hours) by gear type in the coastal zone of Guinea-Bissau, 2018–2023. |
| In the text | |
|
Fig. 6 Length-weight relationship (top) and maturity ogives (bottom) for Trachurus trecae were estimated from specimens collected during the 2025 scientific survey off the coast of Guinea-Bissau. Lines represent the expected value, while shaded areas are the 95% confidence intervals for the mean predicted weight at a given length. |
| In the text | |
|
Fig. 7 Length-frequency distribution (2-cm class interval) of Trachurus trecae in the coastal zone of Guinea-Bissau, 2021–2023. |
| In the text | |
|
Fig. 8 Estimated density distributions for von Bertalanffy growth parameters of Trachurus trecae obtained by bootstrap resampling (n = 200) using the ELEFAN method. Black dashed lines represent the median estimate. |
| In the text | |
|
Fig. 9 Sensitivity of LBI indicators to input parameter variability. The x-axis represents the percentage deviation from the baseline scenario following iterative changes of −25, −20, −15, −10, −5, +5, +10, +15, +20, and +25% in M/K, length at maturity, and L∞, applied one at a time while keeping the remaining parameters constant. |
| In the text | |
Current usage metrics show cumulative count of Article Views (full-text article views including HTML views, PDF and ePub downloads, according to the available data) and Abstracts Views on Vision4Press platform.
Data correspond to usage on the plateform after 2015. The current usage metrics is available 48-96 hours after online publication and is updated daily on week days.
Initial download of the metrics may take a while.