


Fig. 3
Download original image
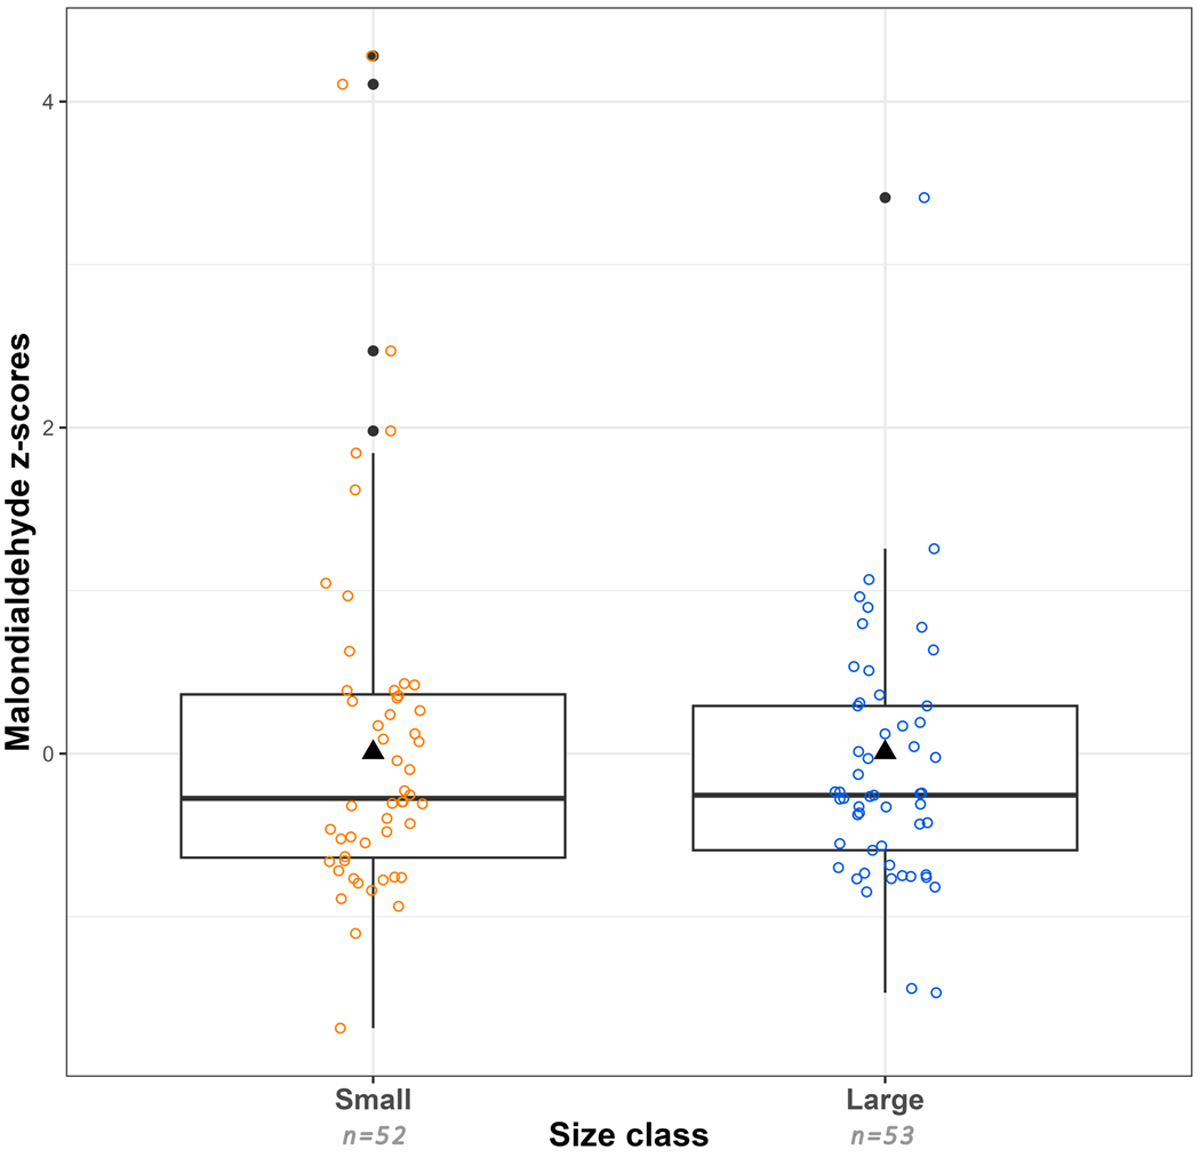
Differences in sardines’ malondialdehyde z-scores regarding their size class. Sample sizes “n” within each group are specified below each boxplot. Black triangles represent malondialdehyde values predicted by the final model within each group.
Current usage metrics show cumulative count of Article Views (full-text article views including HTML views, PDF and ePub downloads, according to the available data) and Abstracts Views on Vision4Press platform.
Data correspond to usage on the plateform after 2015. The current usage metrics is available 48-96 hours after online publication and is updated daily on week days.
Initial download of the metrics may take a while.