| Issue |
Aquat. Living Resour.
Volume 30, 2017
|
|
|---|---|---|
| Article Number | 9 | |
| Number of page(s) | 10 | |
| DOI | https://doi.org/10.1051/alr/2017004 | |
| Published online | 30 March 2017 | |
Research Article
Trophic ecology of commercial-size meagre, Argyrosomus regius, in the Bay of Biscay (NE Atlantic)★
1
IFREMER, Unité Halieutique Gascogne Sud (HGS), Laboratoire Ressources Halieutiques de La Rochelle (LRHLR),
Place Gaby Coll,
17137
L'Houmeau, France
2
IFREMER, Unité Biogéochimie et Écotoxicologie (BE), Laboratoire de Biogéochimie des Contaminants Métalliques (LBCM),
rue de l'Ile d'Yeu, BP 21105,
44311
Nantes Cedex 03, France
3
LIENSs, UMR 7266 CNRS-Université La Rochelle,
2 rue Olympe de Gouges,
17000
La Rochelle, France
4
Observatoire PELAGIS, UMS 3462 CNRS-Université La Rochelle,
5 allée de l'océan,
17000
La Rochelle, France
⁎ Corresponding author: This email address is being protected from spambots. You need JavaScript enabled to view it.
Received:
5
September
2016
Accepted:
27
January
2017
Abstract
In the north-eastern Atlantic, meagre (Argyrosomus regius) is one of the largest fish living on the shelf and this species has important commercial interest. Over the past two decades, large variations in meagre abundance have been observed with pluri-annual cycles but the factors involved in such variations are still unclear. Trophic interactions between meagre and other species (both prey and competitors) might be one explanatory variable of the observed variations in meagre recruitment and abundance. In the present study, we described the diet of commercial-size meagre in the Bay of Biscay from stomach content and stable isotope analyses, and explored its dietary ontogeny. We found that commercial-size meagres were mostly piscivorous with a diet dominated by clupeiform fish (mainly anchovy and sardine) completed by demersal fish (mainly pout and whiting). Cannibalism also accounted for a non-negligible part of the diet. Interestingly, stable isotope and stomach content analyses showed only a very slight increase in prey length and trophic level during the ontogeny of large meagre after 50 cm of total length and despite a 3 fold-change of the individual length in our sampling. Our results suggested that specific trophic interactions (i.e. bottom-up control by clupeiform fish on meagre population, competitive effects on piscivorous populations or top-down control by meagre on clupeiform fish populations) may occur in the Bay of Biscay and can impact meagre abundance dynamics. Our study underlined the interest to enhance ecological knowledge of prey-predator relationships in the development of ecosystem-based approach to understand trophic controls impacting aquatic living resources and fishery economy.
Key words: Diet / SIAR / Ontogeny / Marine top predators / Sciaenidae
Supporting information is only available in electronic form at www.alr-journal.org.
© EDP Sciences 2017
1 Introduction
A major issue for marine ecosystems is to allow the long-term sustainability of exploited resources while maintaining biodiversity and habitat conservation. Anthropogenic pressures can impact marine biodiversity and one of the most important is probably overfishing (Jackson et al., 2001; Curtin and Prellezo, 2010). Fishery management is evolving towards Ecosystem Approach to Fisheries (EAF) in order to limit negative effects on marine environment because fisheries operate within a complex array of species interactions, hence a more holistic approach incorporating biological interactions is recommended (Botsford et al., 1997). Among species interactions, trophic relationships can particularly play a dominant role in structuring marine fish populations. Specifically, predation by piscivorous fish may have a dramatic influence on ecosystem dynamics (Bax, 1998; Frank et al., 2005) and changes in the abundance of one species can affect an entire ecosystem. A better knowledge of species interactions is consequently a major issue of the EAF in order “to balance diverse societal objectives, by taking into account the knowledge and uncertainties about biotic, abiotic and human components of ecosystems and their interactions and applying an integrated approach to fisheries within ecologically meaningful boundaries” (FAO, 2008).
The high diversified marine fauna from the Bay of Biscay (north-eastern Atlantic) has supported numerous fisheries over a long period of time (Lorance et al., 2009) and still is largely exploited. The five highest landed value species exploited in the Bay of Biscay in 2012–2014 are common sole (Solea solea), hake (Merluccius merluccius), sea bass (Dicentrarchus labrax), Norway lobster (Nephrops norvegicus) and monkfish (Lophius spp.) (SIH Ifremer, http://sih.ifremer.fr). Meagre (Argyrosomus regius) has a secondary importance in commercial species but locally and seasonally it may be a major target species of some fleets. It is one of the fish species exhibiting the longest maximum length, up to 230 cm (Quéro et al., 2003), but also an important length at first sexual maturity (around 60 cm for male and >80 cm for female; Sourget and Biais, 2009). As a consequence, catches are largely composed by juveniles. The quality of its flesh is greatly appreciated making this species a valuable resource, especially in the south part of the Bay of Biscay. Meagre is found from Mauritania to the Bay of Biscay in the Eastern Atlantic and in the Mediterranean Sea (Egypt) (Quéro et al., 2003; González-Quirós et al., 2011; Morales-Nin et al., 2012). It is a migratory species that, in the Bay of Biscay, spreads from south Brittany to north Spain, mainly in coastal area. Juveniles live and grow in the Gironde Estuary (Quéro, 1989; Quéro and Vayne, 1989, 1985). Large variations of meagre landings have been observed with 7–8 years cycles, associated with a production increase from 200 metric tons in 2000–2003 to 1200–1400 metric tons in 2005–2008 (Sourget and Biais, 2009) before decreasing at 600–900 tons in 2009–2015. This dynamic might be explained by a stock-recruitment relationship (Sourget and Biais, 2009). In the 2003–2005 phase of abundance increase, reproduction might have been supported by one or two consecutive cohorts of genitors which might have produced a high abundance of juveniles. Trophic interactions between meagre and other species (both prey and competitors including fisheries) might also be strongly linked to the variations in meagre recruitment and abundance.
The present study aims at a better understanding of these trophic interactions and their role in the dynamic of the Bay of Biscay fisheries resources stocks, considering the importance of this knowledge for an EAF management. To this goal, we investigated for the first time the feeding ecology of commercial-size meagre on the continental shelf of the Bay of Biscay by combining two techniques: analysis of stomach contents and carbon (C) and nitrogen (N) stable isotope analysis (SIA). We also assessed some ontogenetic trends in meagre diet.
2 Materials and methods
2.1 Collection and preparation of samples
The stomach contents of 262 meagres that ranged from 25 to 136 cm in size were collected in 2010 and 2011, mostly during the second quarter of the year (Table 1). The fish were caught during scientific campaigns conducted by IFREMER (Institut Français de Recherche pour l'Exploitation de la Mer) or IRSTEA (Institut de Recherche en Sciences et Technologies pour l'Environnement et l'Agriculture) in the Bay of Biscay, and also sampled on French fish auction markets located in the south part of the Bay (Fig. 1). The exact location of caught were not always known, but all meagres have been sampled from the FAO area VIIIb (Fig. 1). The stomachs were ligatured and individually stored deep-frozen (−20 °C) in polythene bags until further analyses. For SIA, a standard piece of dorsal muscle was taken from 21 individuals sampled during the second quarter of 2010 over a wide range of sizes (36–136 cm total length, TL). For logistical reasons, these muscle samples were preserved in alcohol (70% ethanol) until further treatment before SIA.
Summary of meagre sampled for stomach content analysis.
 |
Fig. 1 Map of the Bay of Biscay with FAO fishing areas. Stars indicate fish auction markets where meagres have been sampled (CM: Charente-Maritime, AC: Arcachon Bay, PA: Pyrénées-Atlantiques). |
2.2 Stomach content analysis
Stomach content analysis described the diet in terms of prey occurrence, relative abundance, calculated mass and size distribution, following a standard procedure for marine top predators (Pierce and Boyle, 1991; Pusineri et al., 2005; Spitz et al., 2013). Diagnostic hard parts were recovered from stomachs and stored dry for fish bones and otoliths or in 70% ethanol for cephalopod beaks and crustacean remains. Prey items were identified to the lowest possible taxon by using published guides (Clarke, 1986; Härkönen, 1986; Lagardère, 1971; Tuset et al., 2008) and our reference collection of specimens caught in the Bay of Biscay and adjacent Atlantic areas. Items identified as longline bait were discarded. Diagnostic hard parts (i.e. otoliths, beaks and carapaces) and entire prey items were measured by using a digital vernier calliper (±0.2 mm). Allometric relationships were used to back calculate individual prey size and body mass using relationships that either came from the literature (Clarke, 1986; Härkönen, 1986) or were fitted from measurements performed on specimens of our reference collection.
The occurrence of a prey species is the number of stomachs in which this species was observed. The relative abundance of a species is the total number of individuals from this species found throughout the total number of prey. The biomass is given by the sum of body mass for each individual belonging to the same species throughout the sample set. These three indices can be expressed by their percentage frequency with, respectively, percentage of occurrence (%O), percentage by number (%N) and percentage by biomass (%M):
 where ni is the number of stomachs where the prey i was found and N the total number of stomachs;
 where xi is the number of prey i found and X the total number of prey;
 where xi,j is the number of prey i found in the sample j and
  average individual body mass of prey i in sample j.
Confidence intervals (95% CI) for the percentages by number and by biomass were generated for each prey species by bootstrap simulations of sampling errors (Reynolds and Aebischer, 1991) written using R (R Development Core Team, 2011). Random samples were drawn with replacement, and the procedure was repeated 1000 times. The lower and upper bounds of the 95% CI were the 25th and 975th values previously ranked in increasing order.
2.3 Stable isotope analyses (SIA)
In the last decades, SIA of carbon (C) and nitrogen (N) in consumers' tissues proved to be powerful for describing the trophic ecology of marine organisms or trophic relationships within a given ecosystem, representing an alternative or a complementary tool to the traditional methods of dietary studies such as gut or stomach contents analyses (Michener and Lajtha, 2007). This is because the enrichment in 13C and 15N between a source and its consumer (i.e. between two trophic levels) is relatively predictable. It is lower for C (generally 1–2‰) than for N (2.5–4‰, on average) (Minagawa and Wada, 1984; Vanderklift and Ponsard, 2003; Caut et al., 2009). Carbon isotopic signatures are considered as a tracer of the primary producers at the base of food webs, and consequently a tracer of the foraging habitat of consumers (e.g. benthic versus pelagic or neritic versus oceanic) (Cherel and Hobson, 2007; France, 1995). Nitrogen isotopic signatures are widely used as a proxy for the trophic position or to calculate trophic levels (Le Loc'h et al., 2008; Post, 2002; Vander Zanden et al., 2011). Isotopic signatures provide information on the food assimilated at a time scale that depends on the turnover of the tissue analysed (Buchheister and Latour, 2010; Hobson and Clark, 1992; Tieszen et al., 1983). In fish muscle for instance, C and N half-lives were shown to vary from few weeks to months, depending on species (Buchheister and Latour, 2010; Guelinckx et al., 2007; Suzuki et al., 2011).
Although they could have been partly extracted by alcohol preservation of SIA samples, lipids (Kelly et al., 2006) were further extracted from muscle samples using cyclohexane (Chouvelon et al., 2014). Lipids are effectively highly depleted in 13C relative to other tissue components (DeNiro and Epstein, 1977) and differences in lipid burden may thus constrain the comparison of isotopic data between individuals with different fat contents, while the trophic source does not change. Subsamples (0.40 ± 0.05 mg) of lipid-free powder were then weighed in tin cups. SIA was performed on these subsamples with a Thermo Scientific Delta V Advantage mass spectrometer coupled to a Thermo Scientific Flash EA1112 elemental analyser. Results are expressed as isotope ratios δX (‰) relative to international standards (Pee Dee Belemnite for C and atmospheric N2 for N) according to the formula:
 where X = 13C or 15N and R = 13C/12C or 15N/14N (Peterson and Fry, 1987).
Replicate measurements of internal laboratory standards (acetanilide) indicated an analytical precision of <0.15‰ for both δ13C and δ15N values.
Finally, preservation in alcohol is not common and may impact isotope values − notably because it may extract some polar lipids (Kelly et al., 2006; see above). To ensure the validity of our isotopic data in terms of interpretation and/or further comparison with literature (generally using frozen-preserved samples), we assessed the potential effect of 70% ethanol preservation from an opportunistic sampling of 46 juveniles individuals (32–40 cm TL only) collected in 2011, for which muscle subsamples were both frozen-preserved and 70% ethanol preserved. The δ13C and δ15N values obtained for both subsamples were compared. Detailed results for this assessment of alcohol preservation effect are given in on-line material (Fig. S1). Briefly, a significant effect of the preservation method (storage in 70% ethanol versus freezing at −20 °C) was found for both δ13C and δ15N values (Student t-tests for paired samples, p < 0.001 for both C and N), although more important for N. There was a clear trend towards higher δ13C (but by only 0.1‰ on average) and δ15N values (by 0.6‰ on average) in alcohol-preserved subsamples. The Pearson correlation coefficient between 70% ethanol- and frozen-preserved subsamples was also highly significant for both elements (R2 = 0.795 and R2 = 0.809 for δ13C and δ15N respectively, both p < 0.001), highlighting a quite identical effect of preservation for all samples. When necessary (i.e. for SIAR modelling using prey data from literature, see above), meagre data from 2010 and used in the present study were thus corrected from the preservation effect, following the equation parameters for the corresponding relationships (i.e. derived from the 2011 samples dedicated to the assessment of alcohol preservation, see on-line material):


2.4 Data analysis
As data did not satisfy condition for parametric statistics, the Spearman correlation coefficient test was used to analyse the relationship between predator (meagre) length and prey length. Only fish were considered here as prey to ensure consistency in the prey length dataset.
Gaussian Generalized Additive Models (GGAMs) were fitted to identify size-related trends in isotope values (Zuur et al., 2007) using the mgcv package in R (R Development Core Team, 2011). GGAMs are non-parametric generalizations of multiple linear regressions; they are particularly helpful in capturing and modelling non-linear relationships (Zuur, 2012). Total length (TL) of individuals was considered as a continuous explanatory variable in the models, as well as δ15N or δ13C values allowing direct comparison with other predatory fish species investigated in the Bay of Biscay (Chouvelon et al., 2014). The inclusion of δ15N or δ13C values as supplemental explanatory variables (i.e. other than TL) effectively allows integrating information about the foraging habitat of individuals (i.e. neritic versus oceanic domain) in the Bay of Biscay, because both isotope values were found to decrease significantly in organisms found further offshore in this ecosystem (Chouvelon et al., 2012; Nerot et al., 2012). It finally enables to model size-related relationships (i.e. TL effect) on isotope values, once the effect of the foraging habitat − and thus the potential bias linked to isotope baseline spatial variability − has been taken into account. Two original models were therefore tested:

 where ‘s’ stand for the ‘smoothing function’ applied by GGAMs for the relationships between the variable to explain (δ13C or δ15N) and the explanatory variables (TL and δ15N or δ13C). A model validation was applied by checking normality and homogeneity in models' residuals with no violation of independence (Zuur et al., 2007; Zuur, 2012). As all individuals collected in 2010 and originally considered for SIA (N = 21) in the present study followed the same treatment (70% ethanol-preservation and lipid-extraction), the “raw” isotope data measured on these samples were considered comparable and were used in this assessment of isotopic changes with ontogeny/increasing size of individuals. Moreover, only these individuals from 2010 were considered because they presented a wide range of sizes. The inclusion of juvenile individuals from 2011 and dedicated to the preservation effect assessment (N = 46, TL range = 32–40 cm) was effectively tested, but induced bias in terms of meagre sizes considered and consequently violation of model assumptions; they were thus not kept.
2.5 Isotopic mixing model
A Bayesian isotopic mixing model was applied using the SIAR package (Parnell et al., 2010) to estimate the proportional contribution of prey (sources) to the isotopic signature of adult meagre (mixture). SIAR takes the isotopic signatures of a predator and its potential prey and fits a Bayesian model to generate the probability of each source proportion in the diet of the predator, based upon a Gaussian likelihood with a mixture Dirichlet-distributed prior on the mean. A strong advantage of the use of SIAR in isotopic modeling is its ability to account for variation in trophic enrichment factors (TEFs), as well as variation in prey and predator isotopic signatures. Hence, SIAR has become the most popular tool for interpreting prey-predator relationships from stable isotope signatures (Jaeger et al., 2009; Mèndez-Fernandez et al., 2012; Spitz et al., 2013). Here, in order to create accurate mixing models, the potential preys were first grouped into five forage species types according to their habitat and ecology. The five groups were denoted as: pelagic fish from the shelf, demersal and benthic fish from the shelf, coastal fish, cephalopods, and crustaceans. These groups and associated isotopic values were the ones used in Spitz et al. (2013) for adult sea bass diet in the Bay of Biscay, and were previously checked for statistical differences in δ13C and δ15N values. Detailed results can be found in on-line material but briefly, isotope values of prey groups significantly differed (Kruskal–Wallis tests followed by multiple tests with Holm's adjustment method: p = 0.002 for δ13C and p = 0.003 for δ15N; Table S1, Fig. S2). These differences are largely explained by the documented spatial variations of isotope values in the Bay of Biscay (Chouvelon et al., 2012), which actually drove the determination of such groups by Spitz et al. (2013) to be relevant for SIAR. As SIAR models are sensitive to assumptions regarding TEFs, we performed two mixing models using slightly different TEFs for fish muscle tissue from the literature (Pinnegar and Polunin, 1999; Sweeting et al., 2007a,b). Finally, as in the case of the assessment of potential ontogenetic changes in isotope values, only individuals from 2010 were considered. Furthermore, following the latter results, SIAR was applied on the two following groups: medium-sized individuals (36–60 cm TL), and large individuals (>60 cm TL). Values corrected from the alcohol preservation effect were used for isotopic modeling, because the prey samples whose isotopic data are used were frozen-preserved (Spitz et al., 2013).
3 Results
3.1 Stomachs content analysis
Food remains were retrieved from 163 out of 262 stomachs; 48% of examined stomachs were empty. A total of 648 prey individuals were found accounting for a total estimated biomass of approximately 10 kg (Table 2). Fish, cephalopods, crustaceans, polychaetes were identified and represented a species richness of at least 19 species. Fish dominated the diet in relative abundance (54.9%N) and in reconstructed biomass (84.5%M) in the diet of large meagre in the Bay of Biscay. Crustaceans represented 41.2%N but only 5.3%M, whereas cephalopods constituted 1.2%N and 10.1%M. Polychaetes accounted for a negligible fraction of the diet.
Anchovy (Engraulis encrasicolus) was the most frequent (41.3%O) and the most important prey both in terms of abundance (26.1%N) and ingested biomass (31.2%M). Despite a low relative abundance (3.1%N), sardine (Sardina pilchardus) ranked second in terms of ingested biomass with 21.2%M due to high individual weights. Two gadoids species, pout (Trisopterus luscus) and whiting (Merlangius merlangus) have a significant importance in the diet with respectively 11.6% and 4.8% in number, and 10.9% and 7.0% in biomass. Loligo spp. exhibited a very low abundance (0.3%N); however they reached 7.8% in biomass due to individual weights largely above those of other prey species. On the contrary, shrimps (Crangon spp. and undetermined shrimps) reached a significant abundance (18.7% and 15.9% respectively) but had a low contribution in terms of ingested biomass (1.9% and 1.7% respectively). A significant part of cannibalism has been observed accounting for 5.6% of ingested biomass. Finally, no significant difference have been detected in prey species composition within meagre size classes using either 20 cm size class or <60 cm versus >60 cm.
The body size of fish prey was distributed from 30 to 300 mm and the distribution appeared to be unimodal. The majority of fish prey individuals (63%) ranged from 70 to 120 mm (Fig. 2). No trend was observed in prey–predator length relationship (Fig. 3; only fish were considered here as prey). The Spearman correlation test between meagre length and fish prey length was only slightly significant (r2Spearman = 0.019), however this was probably due to the great number of values considered. As such, the smallest meagre (25–30 cm) appeared to feed on almost the same fish prey size range than the largest individuals (>100 cm).
Prey found in 163 non-empty stomach contents of Argyrosomus regius in Bay of Biscay. N: number of each prey, sd: standard deviation, CI95%: 95% confidence interval (CI), Unid.: unidentified.
 |
Fig. 2 Overall prey fish-size distribution expressed as percent number in stomach contents of meagre. |
 |
Fig. 3 Relationship between meagre (predator) length and prey fish length. |
3.2 C and N stable isotope ratios and mixing models
Commercial-size meagre presented mean δ13C values of −16.7 ± 0.8‰ and mean δ15N values of 15.0 ± 0.6‰. In GGAMs performed to explain isotope values variability, the total explained deviance was high (88.3% and 79.4% for δ13C and δ15N values, respectively). The effect of TL in explaining this variability was highly significant in both cases (p = 0.002 for both elements). The effect of the other element isotope values (effect of δ13C on δ15N values, and effect of δ15N on δ13C values) was also significant (p = 0.008 in the case of δ13C, p = 0.045 for δ15N). Overall, the relationships between muscle δ13C or δ15N values and TL showed an increase in isotope values with increasing size of meagre, although these relationships were not strictly linear in both cases. Isotope values (both δ13C and δ15N) effectively reached a plateau around 60–70 cm TL (Fig. 4).
When considering all individuals from 2010 analysed for SIA (N = 21, 36–130 cm TL), the mixing models estimated that pelagic fish were the main source in the meagre diet for the two different models applied, with a mean pelagic fish contribution ranging from 57.4 ± 11.8% to 74.4 ± 12.8% (Fig. 4). These mixing models suggested that fish prey in general represented around 80% of the diet and the part of crustaceans was limited from 5.0 ± 5.1% to 7.5 ± 6.4%. When considering only individuals >60 cm TL, pelagic fish remained the major prey group estimated by the models (43.9 ± 8.6% and 65.3 ± 5.1% on average for model 1 and model 2, respectively; Fig. 5). Alternatively, the contribution of cephalopods and crustaceans prey groups appeared not negligible in the diet of medium-sized individuals (36–60 cm TL). Estimated contributions varied between 23.0 ± 12.2% and 24.3 ± 13.6% on average for cephalopods, and between 18.7 ± 11.9% to 19.2 ± 12.2% for crustaceans, although pelagic fish still presented the highest estimated contributions to the diet of these medium-sized individuals (34.9 ± 1.5% and 33.9 ± 15.8% on average for model 1 and model 2, respectively; Fig. 5).
 |
Fig. 4 Relationships between δ13C values (left) or δ15N values (right) (‰) and total length (TL, cm) in meagre collected in 2010 for SIA (N = 21) and presenting a wide range of individual sizes. Results from the GGAM models (fitted to individual δ13C or δ15N values to identify size-related trends) are plotted on raw isotope data (i.e. 70% ethanol preserved) and TL data in the form of a smoother (i.e. polygon including 95% confidence interval), illustrating the modelled relationships between parameters (see text). |
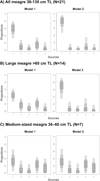 |
Fig. 5 Results of SIAR mixing models applied with different TEFs, showing the estimated proportions (with 50%, 75% and 95% confidence intervals) of each source/prey in the diet of meagre (size range = 36–130 cm TL) collected in 2010 in the Bay of Biscay and analysed for SIA. Data corrected from the effect of ethanol preservation were used (see text and Supplemental Material). (A) Models applied on all individuals analysed for SIA (N = 21); (B) Models applied on large individuals only (>60 cm; N = 14); Models applied on medium-sized individuals only (36–60 cm TL; N = 7). Prey groups (Spitz et al., 2013): 1 = Pelagic fish; 2 = Demersal and benthic fish; 3 = Coastal fish; 4 = Cephalopods; 5 = Crustaceans. TEFs: Model 1 = 1.7 ± 1.1‰ for δ13C and 3.2 ± 1.3‰ for δ15N (Sweeting et al., 2007a,b); Model 2 = 2.5 ± 0.1‰ for δ13C and 3.3 ± 0.2‰ for δ15N (Pinnegar and Polunin 1999). |
4 Discussion
4.1 General
The present work is the first dietary quantitative study on commercial-size meagre ranging from 25 to 130 cm in the Bay of Biscay. A large range of prey has been identified in the diet of commercial-size meagre, however we showed that they were mostly piscivorous with a diet dominated by clupeiform fish (mainly anchovy and sardine) completed by demersal fish (mainly pout and whiting), and cephalopods to a lesser extent. Cannibalism accounted for a non-negligible part of the diet (>5% of ingested biomass). Regarding isotopic signatures, meagre exhibited values from 14.3‰ to 16.8‰ for δ15N and from −18.7‰ to −15.8‰ for δ13C (corresponding to preservation-corrected values ranging from 13.7‰ to 16.4‰ for δ15N and from −19.1‰ to −15.7‰ for δ13C), which is characteristic of organisms from marine environment rather than fluvial-estuarine environment in the Bay of Biscay (Chouvelon et al., 2012; Pasquaud et al., 2008). Prey type preferences as revealed by stomach content analysis were supported by mean dietary contribution values proposed by isotopic mixing modelling, despite a low number of individuals considered for SIA. Interestingly, SIA and stomach contents analysis showed only a very slight increase both of ingested prey length and trophic level during the ontogeny of large meagre after 50 cm TL.
Several usual limitations are inherent to stomach and stable isotope analyses. Firstly, the spatio-temporal design of the sampling can affect the representativeness of dietary results. Here, our sampling covered two different years and all seasons although spring was over-represented. Sampling size limitation is often inherent to dietary investigation of marine top-predators and an extensive collection of samples is often impossible in a realistic period of time. Our sample size was nevertheless comparable to previous studies conducted on large piscivorous fish (Mahé et al., 2007; Pusineri et al., 2005; Spitz et al., 2013). Secondly, stomach content analyses are based on recovering and identification of undigested remains. The representativeness of the diet described by stomach contents analyses is often subjected to the difficulty of controlling the differential digestion stages of the various ingested prey (Pierce and Boyle, 1991; Tollit et al., 1997). The fishing gears (bottom line, trawling net or trammel) can also induce some selectivity in the fish population sampled, and hence can affect the stomach content composition. For example, trawling time can affect the repletion of stomach contents because digestion processes continue in the trawl and the capture stress may cause regurgitation (Sutton et al., 2004). In bottom line, pieces of cephalopods were used as bait which can select individuals feeding preferentially on cephalopods. Some sexual dietary differences or segregation in the foraging strategies of meagre can also exist, notably considering that the size at first maturity is different according to the sex (60 cm for males and >80 cm for females; Sourget and Biais, 2009).
Finally, SIA has also its own limitations, particularly because different prey compositions can lead to same isotopic signatures in the predator tissues (Bearhop et al., 2004). Assumptions associated with TEFs also increase the uncertainty in the ability of isotopic mixing modelling to determine potential dietary contributions (Bond and Diamond, 2011; Parnell et al., 2010). Indeed, TEFs may vary with increasing body mass (age) of individuals (Sweeting et al., 2007a, b) within a species, but also with food type (composition) or prey quality (Caut et al., 2009; Vanderklift and Ponsard, 2003). Despite these limitations, stomach content analysis combined to isotopic signatures represents a valuable approach to evaluate quantitatively the prey composition of top predators (Davis et al., 2012; Polito et al., 2011; Spitz et al., 2013). Hence, our results appeared to be sufficiently robust and congruent to describe quantitatively the general patterns of prey preferences in the diet of commercial-size meagre in the Bay of Biscay, but the sample size did not allow exploring possible dietary variation according to sex, depth, season or area for instance.
4.2 Ontogenic changes
Previous studies on the diet of meagre have been quantitatively investigated exclusively for young individual below 26 cm. In the Gironde and Tagus estuaries, Crangon crangon and Mysidacea were identified as the most important items for small juvenile meagre. Crustaceans represented more than 85% of the diet in these studies (Cabral and Ohmert, 2001; Pasquaud et al., 2008). However, Cabral and Ohmert (2001) showed that the relative proportion of fish in the diet increased with the size of juveniles, whereas Quéro and Vayne (1985) suggested that the diet of large individuals (>27 cm) included fish species such as clupeiforms, mullets or scads. In the present study, crustaceans did not constitute a major prey in the diet of commercial-size meagre, although a non-negligible contribution of crustaceans to the diet of medium-sized individuals (36–60 cm TL) was suggested by isotopic mixing modelling. Thus, our results support the hypothesis that the feeding behaviour of meagre changes towards a piscivorous diet during its ontogeny.
The piscivorous diet of commercial-sized meagre appeared to be relatively stable both in terms of prey species and prey size despites a 5 fold-range increase in meagre body size. Nevertheless, larger sample size for stomach contents might allow detecting some prey species modifications with increasing adult meagre size. Here, only isotopic signatures supported that the relative proportion of fish continued to increase until 60 cm-TL. Between the smallest (36 cm) and the largest individual (130 cm) analysed for stable isotope ratios, the difference in δ15N values was nearly 3‰, which corresponds to less than one trophic level if we consider the widely used 3.4‰-difference between two theoretical trophic levels (Post, 2002). More specifically, the major shift in both δ13C and δ15N values occurred between 40 cm-TL and 60 cm-TL individuals; then, isotope values did not vary greatly among individuals >60 cm TL, indicating no major shift in the trophic level in adult meagre above this size. In the Gironde Estuary, mean δ15N values between 10.5 and 12.5‰ were reported for smaller individuals, i.e. estuarine juveniles (5–30 cm; Pasquaud et al., 2008). Therefore, despite a low number of individuals analysed, SIA confirms that the most important dietary changes occur between the juvenile and adult stages in meagre (i.e. change from a diet mainly dominated by crustaceans to a diet dominated by fish), and no further major changes occur in adult individuals of 60–130 cm TL (piscivorous diet, and relatively constant prey-size range). Similar dietary shifts from crustaceans to fish have been already documented for other fish species such as Argyrosomus japonicus (Griffiths, 1997), hake (Mahé et al., 2007) or European sea bass (Spitz et al., 2013) using stomach content analyses. Furthermore, in the Bay of Biscay and from SIA in particular, ontogenic changes were studied for four other predatory fish, i.e. hake, whiting, horse mackerel Trachurus trachurus and anglerfish Lophius piscatorius (Chouvelon et al., 2014). Species-specific feeding strategies with increasing individual sizes were identified. As direct comparison, the ontogenetic changes observed here for meagre appear similar to those described for horse mackerel and anglerfish by Chouvelon et al. (2014), i.e. occurrence of a major shift in diet/trophic level between the smallest and medium-sized/pre-adult individuals, followed by no significant variations in stable isotope values (and thus, probably similar prey composition and prey size) above a certain predator size.
4.3 Implications for EAF
Clupeiform fish stocks support an abundant and diverse top predator community in the Bay of Biscay (Lassalle et al., 2011). Our results suggested that competitive relationships can occur between commercial-size meagre and other predator species such as hake and sea bass, two abundant commercial high trophic level fish in European Atlantic waters (Mahé et al., 2007; Spitz et al., 2013), or common dolphin (Meynier et al., 2008), the most abundant cetacean in the Bay of Biscay (Laran et al., 2017). Meagre have probably one of the lowest spawning biomass among this top predator community, hence this species should be more sensitive to direct trophic interactions with competitor species which could limit access to this resource. Moreover, frequent periods of low anchovy or/and sardine abundance (Petitgas, 2010) could exacerbate competition within the top predator community in the Bay of Biscay, and consequently impact meagre population dynamics.
Conversely, large abundance increases of the meagre population intensify the predation pressure exerted on these small pelagic fish. Hence, variations of meagre abundance could be an additional top-down control affecting the dynamics of clupeiform fish stocks and it might delay their recovery from low abundance levels.
However, the respective influence of prey and predators on population dynamics of other species is hard to disentangle without data allowing a modelling of species interactions, but these trophic interactions can have important socio-economic and management implications. Understanding and modelling trophic controls impacting aquatic living resources and fishery economics are therefore required to properly implement an EAF, and ultimately ensure long-term sustainability of marine ecosystems.
Supplementary Material
DOI: 10.1051/alr/2017004.s001
Access Supplementary MaterialAcknowledgements
The work was part of a research programme on coastal fishing resources and fisheries supported by the Région Poitou-Charentes (CPER 2007-2012). This research has also been supported by the European projects REPRODUCE (ERAC-CT-2006-025989, FP7) and FACTS (no. 244966, FP7) on the forage species-top predator interactions in the Bay of Biscay and adjacent Atlantic areas. We are particularly grateful to IRSTEA for their sampling during Sturveille surveys. Many thanks go to G. Guillou from the “Plateforme Analyses Isotopiques” of LIENSs for his help on stable isotope analysis.
References
- Bax NJ. 1998. The significance and prediction of predation in marine fisheries. ICES J Mar Sci 55: 997–1030. [Google Scholar]
- Bearhop S, Adams CE, Waldron S, Fuller RA, MacLeod H. 2004. Determining trophic niche width: a novel approach using stable isotope analysis. J Anim Ecol 73: 1007–1012. [Google Scholar]
- Bond AL, Diamond AW. 2011. Recent Bayesian stable-isotope mixing models are highly sensitive to variation in discrimination factors. Ecol Appl 21: 1017–1023. [CrossRef] [PubMed] [Google Scholar]
- Botsford LW, Castilla JC, Peterson CH. 1997. The management of fisheries and marine ecosystems. Science 277: 509–515. [Google Scholar]
- Buchheister A, Latour RJ. 2010. Turnover and fractionation of carbon and nitrogen stable isotopes in tissues of a migratory coastal predator, summer flounder (Paralichthys dentatus). Can J Fish Aquat Sci 67: 445–461. [Google Scholar]
- Cabral HN, Ohmert B. 2001. Diet of juvenile meagre, Argyrosomus regius, within the Tagus estuary. Cahiers Biol Mar 42: 289–293. [Google Scholar]
- Caut S, Angulo E, Courchamp F. 2009. Variation in discrimination factors (Δ15N and Δ13C): the effect of diet isotopic values and applications for diet reconstruction. J Appl Ecol 46: 443–453. [Google Scholar]
- Cherel Y, Hobson KA. 2007. Geographical variation in carbon stable isotope signatures of marine predators: a tool to investigate their foraging areas in the Southern Ocean. Mar Ecol Prog Ser 329: 281–287. [Google Scholar]
- Chouvelon T, Caurant F, Cherel Y, Simon-Bouhet B, Spitz J, Bustamante P. 2014. Species- and size-related patterns in stable isotopes and mercury concentrations in fish help refine marine ecosystem indicators and provide evidence for distinct management units for hake in the Northeast Atlantic. ICES J Mar Sci 71: 1073–1087. [Google Scholar]
- Chouvelon T, Spitz J, Caurant F, et al. 2012. Revisiting the use of δ15N in meso-scale studies of marine food webs by considering spatio-temporal variations in stable isotopic signatures − The case of an open ecosystem: The Bay of Biscay (North-East Atlantic). Progr Oceanogr 101: 92–105. [CrossRef] [Google Scholar]
- Clarke MR. 1986. A handbook for the identification of cephalopod beaks. Oxford: Clarendon Press. [Google Scholar]
- Curtin R, Prellezo R. 2010. Understanding marine ecosystem based management: a literature review. Mar Pol 34: 821–830. [CrossRef] [Google Scholar]
- Davis AM, Blanchette ML, Pusey BJ, Jardine TD, Pearson RG. 2012. Gut content and stable isotope analyses provide complementary understanding of ontogenetic dietary shifts and trophic relationships among fishes in a tropical river. Fresh Biol 57: 2156–2172. [CrossRef] [Google Scholar]
- DeNiro MJ, Epstein S. 1977. Mechanism of carbon isotope fractionation associated with lipid synthesis. Science 197: 261–263. [Google Scholar]
- FAO. 2008. Aménagement des pêches − l'approche écosystémique des pêches: bonnes pratiques de modélisation écosystémiques pour guider une approche écosystémique des pêches. Rome, Italy: FAO. [Google Scholar]
- France RL. 1995. Carbon-13 enrichment in benthic compared to planktonic algae: foodweb implications. Mar Ecol Prog Ser 124: 307–312. [Google Scholar]
- Frank KT, Petrie B, Choi JS, Leggett WC. 2005. Trophic Cascades in a Formerly Cod-Dominated Ecosystem. Science 308: 1621–1623. [Google Scholar]
- González-Quirós R, del Árbol J, del Mar García-Pacheco M, Silva-García AJ, Naranjo JM, Morales-Nin B. 2011. Life-history of the meagre Argyrosomus regius in the Gulf of Cádiz (SW Iberian Peninsula). Fish Res 109: 140–149. [Google Scholar]
- Griffiths MH. 1997. Influence of prey availability on the distribution of dusky kob Argyrosomus japonicus (Sciaenidae) in the Great Fish River estuary, with notes on the diet of early juveniles from three other estuarine systems. S Afr J Mar Sci 18: 137–145. [CrossRef] [Google Scholar]
- Guelinckx J, Maes J, Van Den Driessche P, Geysen B, Dehairs F, Ollevier F. 2007. Changes in delta C-13 and delta N-15 in different tissues of juvenile sand goby Pomatoschistus minutus: a laboratory diet-switch experiment. Mar Ecol Prog Ser 341: 205–215. [Google Scholar]
- Härkönen TJ. 1986. Guide to the otoliths of the bony fishes of the northeast Atlantic. Denmark: Danbiu. Aps. [Google Scholar]
- Hobson KA, Clark RG. 1992. Assessing avian diets using stable isotopes I: turnover of 13C in tissues. Condor 94: 181–188. [Google Scholar]
- Jackson JBC, Kirby MX, Berger WH, et al. 2001. Historical Overfishing and the Recent Collapse of Coastal Ecosystems. Science 293: 629–637. [Google Scholar]
- Jaeger A, Blanchard P, Richard P, Cherel Y. 2009. Using carbon and nitrogen isotopic values of body feathers to infer inter-and intra-individual variations of seabird feeding ecology during moult. Mar Biol 156: 1233–1240. [Google Scholar]
- Kelly B, Dempson JB, Power M. 2006. The effects of preservation on fish tissue stable isotope signatures. J Fish Biol 69: 1595–1611. [Google Scholar]
- Lagardère JP. 1971. Les crevettes des côtes du Maroc. Travaux de l'Institut Scientifique Cherifien et de la Faculté des Sciences 36: 1–140. [Google Scholar]
- Laran S, Authier M, Blanck A, et al. 2017. Seasonal distribution and abundance of cetaceans within French waters − Part II: The Bay of Biscay and the English Channel. Deep Sea Res II: Top Stud Oceanogr. in press. DOI:10.1016/j.dsr2.2016.12.012. [Google Scholar]
- Lassalle G, Lobry J, Le Loc'h F, et al. 2011. Lower trophic levels and detrital biomass control the Bay of Biscay continental shelf food web: implications for ecosystem management. Progr Oceanogr 91: 561–575. [CrossRef] [Google Scholar]
- Le Loc'h F, Hily C, Grall J. 2008. Benthic community and food web structure on the continental shelf of the Bay of Biscay (North Eastern Atlantic) revealed by stable isotopes analysis. J Mar Syst 72: 17–34. [Google Scholar]
- Lorance P, Bertrand J, Brind'Amour A, Rochet MJ, Trenkel V. 2009. Assessment of impacts from human activities on ecosystem components in the Bay of Biscay in the early 1990s. Aquat Liv Res 22: 409–431. [Google Scholar]
- Mahé K, Amara R, Bryckaert T, Kacher M, Brylinski JM. 2007. Ontogenetic and spatial variation in the diet of hake (Merluccius merluccius) in the Bay of Biscay and the Celtic Sea. ICES J Mar Sci 64: 1210. [Google Scholar]
- Mèndez-Fernandez P, Bustamante P, Bode A, et al. 2012. Foraging ecology of five toothed whale species in the Northwest Iberian Peninsula, inferred using carbon and nitrogen isotope ratios. J Exp Mar Biol Ecol 413: 150–158. [Google Scholar]
- Meynier L, Pusineri C, Spitz J, Santos MB, Pierce GJ, Ridoux V. 2008. Intraspecific dietary variation in the short-beaked common dolphin Delphinus delphis in the Bay of Biscay: importance of fat fish. Mar Ecol Prog Ser 354: 277–287. [Google Scholar]
- Michener R, Lajtha K. 2007. Stable isotopes in ecology and environmental science, 2nd ed. Malden, USA/Oxford, UK/Victoria, Australia: Blackwell Publishing Ltd. [CrossRef] [Google Scholar]
- Minagawa M, Wada E. 1984. Stepwise enrichment of 15N along food chains: further evidence and the relation between δ15N and animal age. Geochim Cosmochim Acta 48: 1135–1140. [Google Scholar]
- Morales-Nin B, Geffen AJ, Pérez-Mayol S, Palmer M, González-Quirós R, Grau A. 2012. Seasonal and ontogenic migrations of meagre (Argyrosomus regius) determined by otolith geochemical signatures. Fish Res 127: 154–165. [Google Scholar]
- Nerot C, Lorrain A, Grall J, et al. 2012. Stable isotope variations in benthic filter feeders across a large depth gradient on the continental shelf. Estuar Coast Shelf Sci 96: 228–235. [Google Scholar]
- Parnell AC, Inger R, Bearhop S, Jackson AL. 2010. Source partitioning using stable isotopes: coping with too much variation. PLoS ONE 5: e9672. [CrossRef] [PubMed] [Google Scholar]
- Pasquaud S, Elie P, Jeantet C, Billy I, Martinez P, Girardin M. 2008. A preliminary investigation of the fish food web in the Gironde estuary, France, using dietary and stable isotope analyses. Estuar Coast Shelf Sci 78: 267–279. [Google Scholar]
- Peterson BJ, Fry B. 1987. Stable isotopes in ecosystem studies. Annu Rev Ecol Systematics 18: 293–320. [CrossRef] [EDP Sciences] [Google Scholar]
- Petitgas P., ed. 2010. Life cycle spatial patterns of small pelagic fish in the Northeast Atlantic. ICES Cooperative Research Report. [Google Scholar]
- Pierce GJ, Boyle PR. 1991. A review of methods for diet analysis in piscivorous marine mammals. Oceanogr Mar Biol 29: 409–486. [Google Scholar]
- Pinnegar JK, Polunin NVC. 1999. Differential fractionation of δ13C and δ15N among fish tissues: implications for the study of trophic interactions. Funct Ecol 13: 225–231. [Google Scholar]
- Polito MJ, Trivelpiece WZ, Karnovsky NJ, Ng E, Patterson WP, Emslie SD. 2011. Integrating stomach content and stable isotope analyses to quantify the diets of pygoscelid penguins. PLoS ONE 6: e26642. [CrossRef] [PubMed] [Google Scholar]
- Post DM. 2002. Using stable isotopes to estimate trophic position: models, methods, and assumptions. Ecology 83: 703–718. [Google Scholar]
- Pusineri C, Vasseur Y, Hassani S, Meynier L, Spitz J, Ridoux V. 2005. Food and feeding ecology of juvenile albacore, Thunnus alalunga, off the Bay of Biscay: a case study. ICES J Mar Sci 62: 116. [Google Scholar]
- Quéro J-C. 1989. Sur la piste des maigres Argyrosomus regius (Pisces, Sciaenidae) du Golfe de Gascogne et de Mauritanie. Océanis 15: 161–170. [Google Scholar]
- Quéro JC, Porché P, Vayne JJ. 2003. Guide des poissons de l'Atlantique européen, les Guides du Naturaliste. Delachaux et Niestlé. [Google Scholar]
- Quéro J-C., Vayne J-J. 1985. Le Maigre, Argyrosomus regius (Asso, 1801) (Pisces, Perciformes, Sciaenidae) du Golfe de Gascogne et des eaux plus septentrionales. Rev Travaux Inst Pêches Marit 49: 35–66. [Google Scholar]
- Quéro J-C., Vayne JJ. 1989. Parlons maigres. Ann Soc Sci Char-Mar 7: 869–886. [Google Scholar]
- R Development Core Team. 2011. R: a language and environment for statistical computing. Vienna, Austria: R Foundation for Statistical Computing, ISBN 3-900051-07-0. [Google Scholar]
- Reynolds JC, Aebischer NJ. 1991. Comparison and quantification of carnivore diet by faecal analysis: a critique, with recommendations, based on a study of the fox Vulpes vulpes. Mam Rev 21: 97–122. [CrossRef] [Google Scholar]
- Sourget Q, Biais G. 2009. Ecologie, biologie et exploitation du maigre du golfe de Gascogne. Rapport final convention SMIDDEST–IFREMER–CNRS. [Google Scholar]
- Spitz J, Chouvelon T, Cardinaud M, Kostecki C, Lorance P. 2013. Prey preferences of adult sea bass Dicentrarchus labrax in the northeastern Atlantic: implications for bycatch of common dolphin Delphinus delphis. ICES J Mar Sci 70: 452–461. [Google Scholar]
- Sutton TM, Cyterski MJ, Ney JJ, Duval MC. 2004. Determination of factors influencing stomach content retention by striped bass captured using gillnets. J Fish Biol 64: 903–910. [Google Scholar]
- Suzuki KW, Kasai A, Nakayama K, Tanaka M. 2011. Differential isotopic enrichment and half-life among tissues in Japanese temperate bass (Lateolabrax japonicus) juveniles: implications for analyzing migration. Can J Fish Aquat Sci 62: 671–678. [Google Scholar]
- Sweeting CJ, Barry J, Barnes C, Polunin NVC, Jennings S. 2007a. Effects of body size and environment on diet-tissue δ15N fractionation in fishes. J Exp Mar Biol Ecol 340: 1–10. [Google Scholar]
- Sweeting CJ, Barry JT, Polunin NVC, Jennings S. 2007b. Effects of body size and environment on diet-tissue d13C fractionation in fishes. J Exp Mar Biol Ecol 352: 165–176. [Google Scholar]
- Tieszen LL, Boutton TW, Tesdahl KG, Slade NA. 1983. Fractionation and turnover of stable carbon isotopes in animal tissues: implications for δ13C analysis of diet. Oecologia 57: 32–37. [CrossRef] [PubMed] [Google Scholar]
- Tollit DU, Steward MJ, Thompson PM, Pierce GJ, Santos MB, Hughes S. 1997. Species and size differences in the digestion of otoliths and beaks: implications for estimates of pinniped diet composition. Can J Fish Aquat Sci 54: 105–119. [Google Scholar]
- Tuset VM, Lombarte A, Assis CA. 2008. Otolith atlas for the western Mediterranean, north and central eastern Atlantic. Scient Mar 72: 7–198. [Google Scholar]
- Vanderklift MA, Ponsard S. 2003. Sources of variation in consumer-diet δ15N enrichment: a meta-analysis. Oecologia 136: 169–182. [CrossRef] [PubMed] [Google Scholar]
- Vander Zanden MJ, Cabana G, Rasmussen JB. 2011. Comparing trophic position of freshwater fish calculated using stable nitrogen isotope ratios (δ15N) and literature dietary data. Can J Fish Aquat Sci 54: 1142–1158. [Google Scholar]
- Zuur AF. 2012. A Beginner's Guide to Generalized Additive Models with R. Newburgh, UK: Highland Statistics Limited. [Google Scholar]
- Zuur A, Ieno EN, Smith GM. 2007. Analysing ecological data. New York, USA: Springer Science & Business Media. [CrossRef] [Google Scholar]
Cite this article as: Hubans B, Chouvelon T, Begout M-L, Biais G, Bustamante P, Ducci L, Mornet F, Boiron A, Coupeau Y, Spitz J. 2017. Trophic ecology of commercial-size meagre, Argyrosomus regius, in the Bay of Biscay (NE Atlantic). Aquat. Living Resour. 30: 9
All Tables
Prey found in 163 non-empty stomach contents of Argyrosomus regius in Bay of Biscay. N: number of each prey, sd: standard deviation, CI95%: 95% confidence interval (CI), Unid.: unidentified.
All Figures
|
Fig. 1 Map of the Bay of Biscay with FAO fishing areas. Stars indicate fish auction markets where meagres have been sampled (CM: Charente-Maritime, AC: Arcachon Bay, PA: Pyrénées-Atlantiques). |
| In the text | |
|
Fig. 2 Overall prey fish-size distribution expressed as percent number in stomach contents of meagre. |
| In the text | |
|
Fig. 3 Relationship between meagre (predator) length and prey fish length. |
| In the text | |
|
Fig. 4 Relationships between δ13C values (left) or δ15N values (right) (‰) and total length (TL, cm) in meagre collected in 2010 for SIA (N = 21) and presenting a wide range of individual sizes. Results from the GGAM models (fitted to individual δ13C or δ15N values to identify size-related trends) are plotted on raw isotope data (i.e. 70% ethanol preserved) and TL data in the form of a smoother (i.e. polygon including 95% confidence interval), illustrating the modelled relationships between parameters (see text). |
| In the text | |
|
Fig. 5 Results of SIAR mixing models applied with different TEFs, showing the estimated proportions (with 50%, 75% and 95% confidence intervals) of each source/prey in the diet of meagre (size range = 36–130 cm TL) collected in 2010 in the Bay of Biscay and analysed for SIA. Data corrected from the effect of ethanol preservation were used (see text and Supplemental Material). (A) Models applied on all individuals analysed for SIA (N = 21); (B) Models applied on large individuals only (>60 cm; N = 14); Models applied on medium-sized individuals only (36–60 cm TL; N = 7). Prey groups (Spitz et al., 2013): 1 = Pelagic fish; 2 = Demersal and benthic fish; 3 = Coastal fish; 4 = Cephalopods; 5 = Crustaceans. TEFs: Model 1 = 1.7 ± 1.1‰ for δ13C and 3.2 ± 1.3‰ for δ15N (Sweeting et al., 2007a,b); Model 2 = 2.5 ± 0.1‰ for δ13C and 3.3 ± 0.2‰ for δ15N (Pinnegar and Polunin 1999). |
| In the text | |
Current usage metrics show cumulative count of Article Views (full-text article views including HTML views, PDF and ePub downloads, according to the available data) and Abstracts Views on Vision4Press platform.
Data correspond to usage on the plateform after 2015. The current usage metrics is available 48-96 hours after online publication and is updated daily on week days.
Initial download of the metrics may take a while.