| Issue |
Aquat. Living Resour.
Volume 30, 2017
International Meeting on Marine Research 2016
|
|
|---|---|---|
| Article Number | 15 | |
| Number of page(s) | 9 | |
| DOI | https://doi.org/10.1051/alr/2017016 | |
| Published online | 23 May 2017 | |
Research Article
Distribution patterns of marine cave fishes and the potential role of the cardinal fish Apogon imberbis (Linnaeus, 1758) for cave ecosystem functioning in the western Mediterranean☆
1
Université Côte d'Azur, UCA, CNRS, FRE 3729 ECOMERS,
Parc Valrose 28, Avenue Valrose,
06108
Nice, France
2
Consorzio Interuniversitario per le Scienze del Mare, CoNISMa,
Piazzale Flaminio 9,
00196
Rome, Italy
3
PSL Research University: EPHE-UPVD-CNRS, USR 3278 CRIOBE, Université de Perpignan,
58 Avenue Paul Alduy,
66860
Perpignan, France
4
Laboratoire d'Excellence « CORAIL»,
Perpignan, France
⁎ Corresponding author: This email address is being protected from spambots. You need JavaScript enabled to view it.
Received:
14
October
2016
Accepted:
9
April
2017
Abstract
Fish assemblages associated with 16 marine caves were investigated along the coasts of Spain, France and Italy. Sampling was done in caves that encompassed blind caves (one entrance) and caves with several openings, remarkably variable in morphology, overall extension, presence/absence of ceiling, and characteristics of the bottom. On the whole, 33 fish species were recorded. The distribution patterns of fish assemblages (both in terms of density and biomass) showed a significant variability at the regional (hundreds of kms) and local scale (kms/hundreds of meters), which confirms the great heterogeneity of the cave-associated communities. In terms of occurrence, only the cardinal fish Apogon imberbis and the gobid Corcyrogobius liechtensteini were found in all 16 caves, followed by Scorpaena notata and Serranus cabrilla (n = 15) and Diplodus vulgaris and Didogobius splechtnai (n = 11). A significant number of species were occasionally found, like Sarpa salpa and Diplodus annularis. They usually occur outside caves and could be considered as “sporadic cave visitors”. The high densities of A. imberbis and its frequency of occurrence shows that this species is by far the most represented fish within caves in the western Mediterranean. In spite of the conspicuous variation from cave to cave (from 10 to 70% of the whole fish biomass), a general pattern emerges showing that A. imberbis accounts for a significant proportion of the fish biomass. Average density and biomass of A. imberbis are significantly variable at regional scale (hundreds of kms), but not at local scale (kms/hundred meters). A similar pattern could be explained by multiple processes acting concurrently. Although further studies are needed (e.g. to prove nychthemeral movements inside–outside caves for feeding), this study shows that, based on its density and biomass, A. imberbis has the potential to fulfill a crucial trophic role within Mediterranean marine caves as a vector of organic matter.
Key words: fish fauna / cave habitats / spatial distribution / visual census / biodiversity
Supporting information is only available in electronic form at www.alr-journal.org.
© EDP Sciences 2017
1 Introduction
Along the coasts of the Mediterranean Sea, marine caves are widespread (see Giakoumi et al., 2013). While diving in marine caves is becoming more and more popular, scientific studies on their biological assemblages, especially across large scales, still remain fairly limited (Giakoumi et al., 2013; Gerovasileiou and Voultsiadou, 2014). Due to the high variability in terms of morphological structure and the unique complexity of each individual cave, it is difficult to provide a comprehensive and general definition of “marine cave”. Riedl (1966) and later Bianchi et al. (1996) provided an operative and general definition: a “marine cave” is a cavity of various origin, completely or partially submerged, characterized by (1) a ratio between “overall internal volume/surface of the opening” higher than 1 and (2) a width of the opening that should not exceed the mean width inside.
Marine caves host well diversified, unique and sensitive biological communities. This is attributed to the special ecological conditions inside (e.g. patterns of light extinction, water motion and distribution of trophic resources), and to the fact that many organisms living in marine caves are extremely fragile and potentially vulnerable to environmental change due to the stability the caves offers (e.g. Harmelin et al., 1985; Bianchi et al., 1994; Cicogna et al., 2003; Bussotti et al., 2006; Parravicini et al., 2010; Gerovasileiou and Voultsiadou, 2012; Navarro-Barranco et al., 2013). Inside the caves, unexpectedly diversified communities of sessile organisms often cover most of the available hard-substrate. Spatial distribution of sessile organisms inside the caves is not homogeneous: the light and water movement attenuation along the exterior–interior axis was considered as the driving force that partially explains such variability. The algal species occur in the entrance portions, while more inside, as the daylight decreases to complete dark, just sessile animals cover the available substrates (Riedl, 1966; Cinelli et al., 1977; Balduzzi et al., 1989; Bussotti et al., 2006 and references therein).
Marine caves in the Mediterranean Sea are also colonized by juveniles and adults of vagile species. They include many species of fish that encompass: (1) species exclusively inhabiting marine caves; (2) species associated to cryptic habitats; and (3) nectobenthic species usually inhabiting rocky reefs that can be occasionally found in caves, usually nearby the entrance (Bussotti et al., 2015).
Whole communities of species associated to marine caves significantly contribute to coastal marine biodiversity (e.g. Bianchi et al., 1996; Todaro et al., 2006; Gerovasileiou and Voultsiadou, 2012; Bussotti et al., 2015). They urgently deserve specific conservation plans while being exposed to increasing threats. Divers' frequentation is more and more popular and can severely impact fragile benthic organisms, via direct destruction of unexperienced divers, sediment resuspension from finning, and bubbles that accumulate forming air chambers on the vaults (Di Franco et al., 2009; Guarnieri et al., 2012). Changes in sedimentation regimes where the coastline is severely modified, e.g. by the construction of ports or breakwaters, may also cause dramatic increases of sedimentation inside the caves, which may sometimes almost fill the caves (see Nepote et al., 2016). To know more about the community structure and dynamics, as well as about the functioning of marine caves, may help set up more effective protection and management plans. This shall allow to go beyond the EU Habitat Directive 92/43EEC (where marine caves are cited but not listed among priority habitats) and the Barcelona Convention (UNEP-MAP-RAC/SPA, 2008; Giakoumi et al., 2013).
Regarding cave ecological functioning, little is known so far about the trophic connectivity “inside–outside”. This could be essential to understand how biological communities can be supported in the cave sectors where the light and water movements are scant if not null, thus producing oligotrophic conditions. On this line, some studies have documented the trophic role of cave-dwelling mysids that could transfer, via their nychthemeral migrations, particulate organic matter (POM) inside caves (Ledoyer, 1989; Coma et al., 1997; Rastorgueff et al., 2011). A similar role has been hypothesized also for the cardinal fish Apogon imberbis (Bussotti et al., 2002, 2003; Webster et al., 2010; Rastorgueff et al., 2015). There is suggestive evidence that this fish could move out from the caves at night to feed, and then return back into the caves at dawn (nychthemeral migration), deposing its dejections (i.e. valuable food source in the form of POM) at daytime inside the caves (Bussotti et al., 2003). A similar process could help mitigate the oligotrophic conditions generally occurring inside caves, especially in the most internal sectors of blind caves. One important proviso to support this hypothesis relies on the abundance and biomass of A. imberbis. Only if populations of this species show high relative abundances and biomasses, then A. imberbis could play a crucial trophic role for sustaining marine cave communities. To be generalized, also, this pattern should be tested on a large set of marine caves, possibly across a large spatial scale.
As a starting point in this approach, this study is aimed at (1) describing fish assemblages distribution patterns at multiple spatial scales associated with 16 marine caves along the Mediterranean coasts of Spain, France and Italy and (2) evaluating the relative contribution of A. imberbis in terms of abundance and biomass to the whole fish assemblages.
2 Materials and methods
2.1 Study area
Fish sampling was carried out in June–August 2015 in 16 semi-submerged or submerged caves located in 6 zones in the western Mediterranean (specifically along the Spanish, French and Italian coasts): 3 caves at Cap de Creus (Spain), 3 at Côte Bleue, 3 at Villefranche-sur-mer (France), 2 at Tavolara Island, 2 at Bergeggi and 3 at Ventimiglia (Italy) (Fig. 1). The investigated caves encompassed blind caves (one entrance) and caves with several openings, remarkably variable in morphology (e.g. branching), overall extension, presence/absence of ceiling, and characteristics of the bottom (e.g. formed by rocks/pebbles or sandy/muddy sediments), while the bathymetry ranged between 3 and 24 m (Table 1). According to Bussotti et al. (2015), fish sampling has been carried out inside marine caves as structurally variable as possible in order to capture the overall variability and diversity of the associated fish fauna.
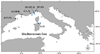 |
Fig. 1 Location of the 6 zones hosting the 16 marine caves. (1) I = Inferno, P1 = Pelegrì 1, P2 = Pelegrì 2 (Cap de Creus, Spain); (2) LV = La Vesse, M = Mejean, N = Niolon (Côte Bleue, France); (3) C = Corail, L = Lido, S = Semaphore (Villefranche-sur-Mer, France); (4) RG = Rocca Grande, RP = Rocca Piccola, Se = Secca (Ventimiglia, Italy); (5) B1 = Bergeggi 1, B2 = Bergeggi 2 (Bergeggi AMP, Italy); (6) G = Ghigliottina, P = Papa (Tavolara AMP, Italy). |
Description of the main features of caves were studied at the 6 zones: (1) I = Inferno, P1 = Pelegrì 1, P2 = Pelegrì 2 (Cap de Creus, Spain); (2) LV = La Vesse, M = Mejean, N = Niolon (Côte Bleue, France); (3) C = Corail, L = Lido, S = Semaphore (Villefranche-sur-Mer, France); (4) RG = Rocca Grande, RP = Rocca Piccola, Se = Secca (Ventimiglia, Italy); (5) B1 = Bergeggi 1, B2 = Bergeggi 2 (Bergeggi AMP, Italy); (6) G = Ghigliottina, P = Papa (Tavolara AMP, Italy). Substrate type abbreviations: M: muddy; P: Pebbles; R: rocky; S: sandy.
2.2 Sampling and data analyses
Fish density was estimated using a modified transect visual census method using SCUBA (Bussotti et al., 2015). The scientists-divers who got the fish data within the caves, received a specific training, as it is usually recommended. Marine caves, in fact, typically contain silt on the floor, which can easily be stirred up reducing visibility to zero and making it difficult to locate the cave exit. Transects were 2 m wide and from 5 to 25 m long: the transect length was adapted, in fact, to the shape and morphological discontinuities of each cave. For each transect, abundance and size of all fish encountered were recorded (Harmelin-Vivien et al., 1985).
The number of transects performed in each cave was variable in relation to the extent and topography of the cave. A total of n = 67 visual censuses were performed in the present study. Fish biomass was then calculated on the basis of the best available length/weight relationships (www.fishbase.org). Due to the variable dimensions of transects, abundance and biomass values observed in the field were then converted to 100 m2.
The spatial variability of multivariate (whole fish assemblages, both considering density and biomass data) and univariate patterns (total density and biomass, density and biomass of A. imberbis), was assessed by permutational analyses of variance (PERMANOVA, Anderson, 2001) based on Euclidean distance measure (Terlizzi et al., 2007), in order to avoid any assumption about the distribution of the variables (Anderson, 2001; Anderson and Ter Braak, 2002). In this analysis the F-statistics are calculated but the p-values are computed from permutations. The experimental design encompassed two factors: Zone (Zo, random, 6 levels) and Cave (Ca, random, nested in Zo, 2–3 levels). All statistical analyses were run using the PRIMER 6 software package (Clarke and Gorley, 2006) with the PERMANOVA+ add-on (Anderson et al., 2008). The Bray-Curtis similarity matrix was used to generate 2-dimensional ordination plots with the non-metric multidimensional scaling (nMDS) technique (Clarke, 1993). Last, to explore contribution of the A. imberbis on the whole fish biomass and the fish species richness, the A. imberbis biomass for each cave has been linearly correlated with (1) total fish biomass (excluding A. imberbis to avoid spurious correlations) and (2) species richness.
3 Results
3.1 Whole fish assemblage
A total of 33 fish species has been recorded in the 16 marine caves surveyed (Fig. 2). The highest species richness (n = 16) has been recorded in the Semaphore cave and the lowest (n = 8) in the Secca cave.
In terms of frequency of occurrence, only the cardinal fish Apogon imberbis and the gobid Corcyrogobius liechtensteini were found in all caves (n = 16), followed by Scorpaena notata and Serranus cabrilla (n = 15), and by Diplodus vulgaris and Didogobius splechtnai (n = 11). Conversely, some species were only occasionally recorded, like Sarpa salpa and Diplodus annularis, observed just in one cave (see Fig. 2).
The nMDS plot on density and biomass data (Figs. 3 and 4) suggests that fish assemblages associated to caves in Bergeggi, Villefranche-sur-Mer and Tavolara are less variable at the scale of “zone” (with points in the nMDS that tend to aggregate), than those associated to caves at Cap de Creus, Côte Bleu, Ventimiglia.
PERMANOVA analyses on fish assemblage structure (in terms of density and biomass data) show statistically significant variability both at the scale of “zone” and “cave” (Table 2).
Average fish density and biomass are significantly different at the scale of “zone” but not at the scale of caves within zone (Table 3).
 |
Fig. 2 Frequency of occurrence of fish species (expressed as number of caves where each fish has been recorded) at the 16 marine caves investigated. |
 |
Fig. 3 Fish assemblage structure based on density data. Two-dimensional non-metric MDS plots of centroids. |
 |
Fig. 4 Fish assemblage structure based on biomass data. Two-dimensional non-metric MDS plots of centroids. |
Results of multivariate PERMANOVA analyses on fish density and biomass data. Zo = Zone; Ca = Cave. Significant p values are reported and in bold.
Results of univariate PERMANOVA analyses on fish density and biomass data. Zo = Zone; Ca = Cave. Significant p values are reported in bold.
3.2 Apogon imberbis
Cardinal fish density accounted, on average, for 74.2 ± 5.2% (mean ± SE) of all fishes censused in each cave (ranging from 12% in the Rocca Grande cave to >90% in the 2 caves sampled at Bergeggi and at the 2 caves at Tavolara) (Fig. 5a).
Apogon imberbis was the most abundant fish in all caves, except in the Rocca Grande cave, where Oblada melanura numerically dominated (mostly due to a single UVC replicate where a huge school of this fish was recorded).
Average densities of the cardinal fish at the 16 caves investigated are shown in Figure 6a. Density of A. imberbis was, on average, 177.0 ± 23.7 ind./100 m2, with the highest value (916.7 ind./100 m2) found in the Bergeggi-1 cave. The analysis of variance did not detect any significant variability in average density of the cardinal fish among caves within “zone”, but revealed a highly significant difference among zones (p < 0.01; Table 4).
The cardinal fish accounted on average for 29.2 ± 4.2% (mean ± SE) of the whole fish biomass estimated in the 16 caves investigated (ranging from 10 to 70% in the Pelegrì and Ghigliottina cave, respectively) (Fig. 5b). Apogon imberbis displayed the highest biomass in 3 out of the 16 caves investigated (namely Niolon, Ghigliottina and Bergeggi1). Average biomass values of the cardinal fish at the 16 caves investigated are shown in Figure 6b. Biomass of A. imberbis was, on average, 1401 ± 205.5 g/100 m2, with the highest value (7390.3 g/100 m2) found in the Bergeggi-1 cave.
The analysis of variance detected a highly significant variability (p < 0.01; Table 3) in the average biomass of the cardinal fish only among zones, but not among caves within “zone” (Table 3). Finally, no significant correlation was found between A. imberbis biomass and species richness (Fig. S1). A significant positive correlation was found, on the contrary, between A. imberbis biomass and biomass of whole fish assemblage (Fig. S1), but it is worth noting that the significance is mainly determined by a single point (Bergeggi 2) which could be considered an outlier.
 |
Fig. 5 Percentage values of (a) total density and (b) total biomass of fishes in all caves studied. |
 |
Fig. 6 Mean (±ES) (a) density and (b) biomass of the cardinal fish Apogon imberbis at the 16 marine caves investigated in this study. |
Results of univariate PERMANOVA analyses on Apogon imberbis density and biomass data. Zo = Zone; Ca = Cave. Significant p values are reported underlined and in bold.
4 Discussion
This study investigated the patterns of spatial variability in the structure of fish assemblages within marine caves in the north-western Mediterranean Sea.
We found in total 33 fish species. Fish species richness per individual cave ranged from 8 to 16 species. In similar conditions, Bussotti (2003) and Bussotti and Guidetti (2009) reported a list of 34 fish taxa from 3 caves located in the north-western Ionian Sea, with species richness ranging from 20 to 21 fishes at each cave. More recently, Bussotti et al. (2015), analyzed the fish fauna in 14 caves located in the Ionian Sea, Sicily Straight and Sardinian Sea, and reported a total 38 fish taxa with species richness ranging from 5 to 21 species per cave. Overall, data of species richness of the present survey are falling within the range of fish species richness within marine caves reported in the literature.
Similarly to what reported in the previous literature (see Bori, 1984; Harmelin et al., 1985; Kovacic, 1999; Patzner, 1999; Bussotti et al., 2015), we recorded a number of cryptic species with some species that are frequent into caves even though they are not exclusively associated to cave habitats (e.g. Apogon imberbis, Scorpaena notata, Sciaena umbra, Thorogobius ephippiatus), while others are typically found in Mediterranean caves (e.g. Gammogobius steinitzi, Grammonus ater, Didogobius splechtnai). Apogon imberbis and the gobid Corcyrogobius liechtensteini were found in all the caves investigated, while a significant number of species (>10) were found just in one or two caves. The species showing rare occurrence appeared to be fish species usually found mainly outside the caves that can be considered as “sporadic cave visitors”. They are often observed in the initial portions of caves where the ecological conditions are similar to rocky reefs outside. Bussotti and Guidetti (2009) already reported such distribution from cave entrances with a pool of species shared between the internal portions of the caves and surrounding external rocky cliffs. These fishes (e.g. Sarpa salpa, Symphodus rostratus, Diplodus annularis) can hardly be linked, from an ecological viewpoint, to cave habitats. These sporadic visitors that are often recorded at the cave entrances, which are a sort of “ecotone” (Livingston, 1903; Clements, 1905) between external rocky reefs and the caves, should not be considered as “cave” species. Hypothetically, they could contribute to trophic connectivity between the cave and surrounding open habitats (bringing organic material through feces and removing from the cave some organic material via their feeding). However, their effects is spatially limited to the entrances (while the dark sectors are the more oligotrophic) and limited quantitative considering their reduced abundance and biomass.
Distribution patterns of whole fish assemblages (density and biomass) showed a significant variability both at the regional (among zones; hundreds of kms) and local scale (among caves within zone; kms/hundreds of meters). This result suggests that multiple factors acting at different spatial scales (e.g. sea water temperature at large scale, individual cave morphology at small scale) could affect fish assemblages associated to caves. Such a multiscale spatial variability has been reported in previous studies (Bussotti and Guidetti, 2009; Bussotti et al., 2015) and would deserve to be investigated more in depth to distill between the multiple sources of variations acting at different scales. The morphology of the cave is likely representing one of the drivers of the variability recorded.
In this study, frequency of occurrence, density and biomass of A. imberbis were found to considerably change in space. Even though the available quantitative data are limited, A. imberbis is reported to be frequent in caves and other cryptic habitats (Garnaud, 1962; Muths et al., 2015; www.fishbase.org). Differently, C. liechtensteini that was observed in all caves in our study, is not frequently reported in the literature. In the light of the results of our study and of the most recent literature (Bussotti et al., 2015 and references therein), this could be the result of the lack of experts capable of identifying the species rather than of an actual rarity of the species. This gobid fish, in fact, is small in size (max 2.5 cm TL) and is cryptic, being often quite well hided within holes and crevices in the initial sectors of the caves, specifically in correspondence of the vaults (Herler et al., 1999).
The high densities of A. imberbis (along with its frequency of occurrence) reported in this study (to almost 1000 ind./100 m2) shows that this species is by far the most represented fish within caves in the western Mediterranean. Bussotti et al. (2003) report very high densities of the cardinal fish greater than 1800 ind./100 m2 in some marine caves in the Ionian Sea (SE Italy).
The present study estimates, for the first time, biomass data of the cardinal fish inside marine caves. In spite of the conspicuous variation from cave to cave (from 10 to 70% of the whole fish biomass), a general pattern indicates that this species accounts for a significant proportion of fish biomass inside caves.
Average densities and biomasses of A. imberbis are significantly variable at regional scale (hundreds of kms), but not at local scale (kms/hundred meters). A similar pattern could be explained by multiple processes related to sea-water temperature (e.g. regional climate differences), prey availability, but also to local post-settlement movements that could balance densities among neighboring caves (although more in depth studies are needed to discriminate among different putative processes). Recent studies on population genetics of A. imberbis revealed a low level of genetic structure between populations at the spatial scale of some kilometers along the French Mediterranean coast (Muths et al., 2015). The authors suggest the possibility that the cardinal fish could move among caves using any type of cryptic habitat (small holes, crevices, any type of cavities) as stepping stones (Poortvliet et al., 2013). This hypothesis is not coherent, however, with the typical homing behavior described for Apogonidae. In tropical regions, Apogonid have demonstrated strong site fidelity (e.g. Marnane, 2000; Døving et al., 2006; Gardiner and Jones, 2010). In the Mediterranean Sea, the few data available about the homing behavior of A. imberbis suggest that this fish can move across distances of some ten-hundred meters in shallow rocky reefs (Webster et al., 2010). Specific studies on site fidelity of A. imberbis in Mediterranean marine caves, however, are lacking and prevent the possibility to draw more robust conclusions.
In conclusion, the present study (1) provides additional knowledge on the structure of fish assemblages inhabiting Mediterranean marine caves that will be important in understanding trophic ecology of these habitats, (2) demonstrates that despite density and biomass of the cardinal fish A. imberbis are significantly variable at a large scale, and (3) the A. imberbis is dominant within the fish assemblages associated to marine caves in the NW Mediterranean Sea and will certainly has a key role in cave ecology equilibrium. Further studies are certainly needed (e.g. to prove the existence of nychthemeral movements for feeding “inside–outside” marine caves) to further clarify the putatively crucial trophic role of A. imberbis within Mediterranean marine caves as a vector of organic matter (see Bussotti et al., 2002, 2003; Webster et al., 2010; Rastorgueff et al., 2015). Here we show that the cardinalfish generally displays dominant density and biomass within caves, which is a prerequisite to support the hypothesis that it could be an effective vector of POM, realizing a crucial “inside–outside” trophic connection.
Supplementary Material
 |
Fig. S1 Correlation between Apogon imberbis biomass per cave and (1) fish total biomass (without Apogon) per cave (blue dots) and (2) fish species richness (red dots). Solid and dotted lines indicate, respectively, significant and not significant linear correlation. |
Acknowledgements
This research was funded by the Total Corporate Foundation (http://fondation.total.com/fr). The funder had no role in study design, data collection and analysis, decision to publish, or preparation of the manuscript. Many thanks are due to J.G. Harmelin for his comments on the draft of the manuscript and to the managers and the staffs of the Tavolara-Punta Coda Cavallo, Bergeggi Island, Cap de Creus and Côte Bleue MPAs for their support. We wish to thank also the two anonymous referees for their valuable comments on the previous version of the manuscript.
References
- Anderson MJ. 2001. Permutation tests for univariate or multivariate analysis of variance and regression. Can J Fish Aquat Sci 58: 626–639. [Google Scholar]
- Anderson MJ, Ter Braak CJF. 2002. Permutation tests for multi-factorial analysis of variance. J Stat Comput Simul 73: 85–113. [Google Scholar]
- Anderson MJ, Gorley RN, Clarke KR. 2008. PERMANOVA+ for PRIMER: Guide to Software and Statistical Methods. Plymouth, UK: PRIMER-E, p. 214. [Google Scholar]
- Balduzzi A, Bianchi CN, Boero F, Cattaneo-Vietti R, Pansini M, Sarà M. 1989. The suspension-feeder communities of a Mediterranean sea cave. Sci Mar 53(2–3): 387–395. [Google Scholar]
- Bianchi CN, Cinelli F, Morri C. 1994. The biology of a submarine cave with sulphur springs: the Grotta Azzurra of Capo Palinuro, Southern Italy. Cave Diving 6: 10–13. [Google Scholar]
- Bianchi CN, Cattaneo-Viett R, Cinelli F, Morri C, Pansini M. 1996. Lo studio biologico delle grotte sottomarine del Mediterraneo: Conoscenze attuali e prospettive. Boll. Mus. Ist. Biol. Univ. Genova 60–61: 41–69. [Google Scholar]
- Bori C. 1984. Ictiofauna bentonica i litoral de les illes medes. In: Ros J, Olivella I, Gili JM, eds. Els sistemes naturals de les illes Medes. Barcelona: Institut d'Estudis Catalans, pp. 601–617. [Google Scholar]
- Bussotti S. 2003. Variabilità spazio-temporale di popolamenti bentonici ed ittici di fondo duro in ambienti di grotte marine della Penisola Salentina (Puglia Meridionale), Ph.D. Thesis. Università di Siena, p. 129. [Google Scholar]
- Bussotti S, Denitto F, Guidetti P, Belmonte G. 2002. Fish assemblages in shallow marine caves of the Salento Peninsula (Southern Apulia, SE Italy). PSZN: Mar Ecol 23: 11–20. [CrossRef] [Google Scholar]
- Bussotti S, Guidetti P, Belmonte G. 2003. Distribution patterns of the cardinal fish, Apogon imberbis, in shallow marine caves in southern Apulia (SE Italy). Ital J Zool 70: 153–157. [CrossRef] [Google Scholar]
- Bussotti S, Terlizzi A, Fraschetti S, Belmonte G, Boero F. 2006. Spatial and temporal variability of sessile benthos in shallow Mediterranean marine caves. Mar Ecol Prog Ser 325: 109–119. [Google Scholar]
- Bussotti S, Guidetti P. 2009. Do Mediterranean fish assemblages associated with marine caves and rocky reefs differ? Estuar Coast Shelf Sci 81: 65–73. [Google Scholar]
- Bussotti S, Di Franco A, Francour P, Guidetti P. 2015. Fish Assemblages of Mediterranean Marine Caves. PLoS ONE 10(4): e0122632. [CrossRef] [PubMed] [Google Scholar]
- Cicogna F, Bianchi CN, Ferrari G, Forti P, eds. 2003. Grotte Marine. Cinquant'anni di ricerca in Italia. Ministerob dell'Ambiente e Tutela del Territorio. Rapallo: Officine Grafiche Canessa, p. 505. [Google Scholar]
- Cinelli F, Fresi E, Mazzella L, Pronzato M, Pansini M, Svoboda A. 1977. Distribution of benthic phyto- and zoocoenoses along a light gradient in a superficial marine cave. In: Keegan BF, O'Céidigh P, Boaden PJS, eds. Biology of benthic organisms. Oxford: Pergamon Press, pp. 173–183. [CrossRef] [Google Scholar]
- Clarke KR. 1993. Non-parametric multivariate analyses of changes in community structure. Aust J Ecol 18: 117–143. [CrossRef] [Google Scholar]
- Clements FE. 1905. Research Methods in Ecology. Lincoln, NB: University of Nebraska Publishing Company, 334 pp. [Google Scholar]
- Coma R, Carola M, Riera T, Zabala M. 1997. Horizontal transfer of matter by a cave dwelling Mysid. Mar Ecol 18: 211–226. [Google Scholar]
- Di Franco A, Milazzo M, Baiata P, Tomasello A, Chemello R. 2009. Scuba diver behaviour and its effects on the biota of a Mediterranean marine protected area. Environ Conserv 36: 32–40. [Google Scholar]
- Døving KB, Stabell OB, Östlund-Nilsson S, Fisher R. 2006. Site fidelity and homing in tropical coral reef cardinalfish: are they using olfactory cues? Chem Senses 31: 265–272. [CrossRef] [PubMed] [Google Scholar]
- Garnaud J. 1962. Monographie de l'Apogon méditerranéen: Apogon imberbis (L.) 1758. Bull Inst Océanogr (Monaco) 1248: 83. [Google Scholar]
- Gardiner NM, Jones GP. 2010. Synergistic effects of habitat preference and gregarious behaviour on habitat use in coral reef cardinalfish. Coral Reefs 29: 845–856. [Google Scholar]
- Gerovasileiou V, Voultsiadou E. 2012. Marine Caves of the Mediterranean Sea: A Sponge Biodiversity Reservoir within a Biodiversity Hotspot. PLoS ONE 7(7): e39873. [CrossRef] [PubMed] [Google Scholar]
- Gerovasileiou V, Voultsiadou E. 2014. Mediterranean marine caves as biodiversity reservoirs: a preliminary overview. In: Symposia on the conservation of Mediterranean marine key habitats, Portorož, 27–31 October 2014. Tunis: RAC/SPA, pp. 45–50. [Google Scholar]
- Giakoumi S, Sini M, Gerovasileiou V, et al. 2013. Ecoregion-based conservation planning in the Mediterranean: dealing with large-scale heterogeneity. PLoS ONE 8(10): e76449. DOI: 10.1371/journal.pone.0076449. [CrossRef] [PubMed] [Google Scholar]
- Guarnieri G, Terlizzi A, Bevilacqua S, Fraschetti S. 2012. Increasing heterogeneity of sensitive assemblages as a consequence of human impact in submarine caves. Mar Biol 159: 1155–1164. [Google Scholar]
- Harmelin JG, Vacelet J, Vasseur P. 1985. Les grottes sous-marines obscures: un milieu extrême et un remarquable biotope refuge. Téthys 11: 214–229. [Google Scholar]
- Harmelin-Vivien ML, Harmelin JG, Chauvet C, et al. 1985. Evaluation des peuplements et populations de poissons. Méthodes et problèmes. Rev Ecol Terre Vie 40: 467–539. [Google Scholar]
- Herler J, Patzner R, Ahnelt H, Hilgers H. 1999. Habitat selection and ecology of two speleophilic gobiid fishes (Pisces: Gobidae) from the Western Mediterranean Sea. PSZN: Mar Ecol 20: 49–62. [CrossRef] [Google Scholar]
- Kovacic M. 1999. Gammogobius steinitzi Bath, 1971, a fish new to the Adriatic Sea. Nat Croat 8: 1–7. [Google Scholar]
- Ledoyer M. 1989. Les mysidacés (Crustacea) des grottes sous-marines obscures de Méditerranée Nord-occidentale et proche atlantique. Mar Nat 2: 39–62. [Google Scholar]
- Livingston BE. 1903. The distribution of the upland societies of Kent County, Michigan. Botanical Gazette 15: 3223–3239. [Google Scholar]
- Marnane MJ. 2000. Site fidelity and homing behaviour in coral reef cardinalfishes. J Fish Biol 57: 1590–1600. [Google Scholar]
- Muths D, Rastorgueff PA, Selva M, Chevaldonné P. 2015. Local scale connectivity in the cave-dwelling brooding fish Apogon imberbis. J Sea Res 95: 70–74. [Google Scholar]
- Navarro-Barranco C, Guerra Garcia JM, Sánchez-Tocino L, Jiménez-Prada P, Cea S, García-Gómeza JC. 2013. Soft-bottom diversity patterns in marine caves; Lessons from crustacean comunity. J Exp Mar Biol Ecol 446: 22–28. [Google Scholar]
- Nepote E, Bianchi CN, Morri C, Ferrari M, Montefalcone M. 2016. Impact of a harbour construction on the benthic community of two shallow marine caves. Mar Poll Bull 114: 35–45. DOI: 10.1016/j.marpolbul.2016.08.006. [CrossRef] [Google Scholar]
- Parravicini V, Guidetti P, Morri C, Montefalcone M, Donato M, Bianchi CN. 2010. Consequences of sea water temperature anomalies on a Mediterranean submarine cave ecosystem. Estuar Coast Shelf Sci 86: 276–282. [Google Scholar]
- Patzner RA. 1999. Habitat utilization and depth distribution of small cryptobenthic fishes (Blenniidae, Gobiesocidae, Gobiidae, Tripterygiidae) in Ibiza (western Mediterranean Sea). Environ Biol Fish 55: 207–214. [CrossRef] [Google Scholar]
- Poortvliet M, Longo GC, Selkoe K, et al. 2013. Phylogeography of the California sheephead, Semicossyphus pulcher: the role of deep reefs as stepping stones and pathways to antitropicality. Ecol Evol 3: 4558–4571. [CrossRef] [PubMed] [Google Scholar]
- Rastorgueff PA, Harmelin-Vivien M, Richard P, Chevaldonné P. 2011. Feeding strategies and resource partitioning mitigate the effects of oligotrophy for marine cave mysids. Mar Ecol Prog Ser 440: 163–176. [Google Scholar]
- Rastorgueff PA, Bellan-Santini D, Bianchi CN, et al. 2015. An ecosystem-based approach to evaluate the ecological quality of Mediterranean undersea caves. Ecol Indic 54: 137–152. [Google Scholar]
- Riedl R. 1966. Biologie der Meereshohlen. Hamburg and Berlin: Paul Parey, p. 636. [Google Scholar]
- Terlizzi A, Anderson MJ, Fraschetti S, Benedetti-Cecchi L. 2007. Scales of spatial variation in Mediterranean subtidal sessile assemblages at different depths. Mar Ecol Prog Ser 332: 25–39. [Google Scholar]
- Todaro MA, Leasi F, Bizzarri N, Tongiorgi P. 2006. Meiofauna densities and gastrotrich community composition in a Mediterranean sea cave. Mar Biol 49: 1079–1091. [Google Scholar]
- UNEP-MAP-RAC/SPA. 2008. Action Plan for the Conservation of the Coralligenous and Other Calcareous Bio-Concretions in the Mediterranean Sea. Tunis: RAC/SPA, p. 21. [Google Scholar]
- Webster P, Swann K, Richtik-Rinaudo M. 2010. Diel distribution and site fidelity of Apogon imberbis in shallow rocky reefs in Corsica, France. BIOE159 Marine Ecology of Corsica Field Quarter (Stareso and Calvi) Final Project. [Google Scholar]
Cite this article as: Bussotti S, Di Franco A, Pey A, Vieux-Ingrassia J-V, Planes S, Guidetti P. 2017. Distribution patterns of marine cave fishes and the potential role of the cardinal fish Apogon imberbis (Linnaeus, 1758) for cave ecosystem functioning in the western Mediterranean. Aquat. Living Resour. 30: 15
All Tables
Description of the main features of caves were studied at the 6 zones: (1) I = Inferno, P1 = Pelegrì 1, P2 = Pelegrì 2 (Cap de Creus, Spain); (2) LV = La Vesse, M = Mejean, N = Niolon (Côte Bleue, France); (3) C = Corail, L = Lido, S = Semaphore (Villefranche-sur-Mer, France); (4) RG = Rocca Grande, RP = Rocca Piccola, Se = Secca (Ventimiglia, Italy); (5) B1 = Bergeggi 1, B2 = Bergeggi 2 (Bergeggi AMP, Italy); (6) G = Ghigliottina, P = Papa (Tavolara AMP, Italy). Substrate type abbreviations: M: muddy; P: Pebbles; R: rocky; S: sandy.
Results of multivariate PERMANOVA analyses on fish density and biomass data. Zo = Zone; Ca = Cave. Significant p values are reported and in bold.
Results of univariate PERMANOVA analyses on fish density and biomass data. Zo = Zone; Ca = Cave. Significant p values are reported in bold.
Results of univariate PERMANOVA analyses on Apogon imberbis density and biomass data. Zo = Zone; Ca = Cave. Significant p values are reported underlined and in bold.
All Figures
|
Fig. 1 Location of the 6 zones hosting the 16 marine caves. (1) I = Inferno, P1 = Pelegrì 1, P2 = Pelegrì 2 (Cap de Creus, Spain); (2) LV = La Vesse, M = Mejean, N = Niolon (Côte Bleue, France); (3) C = Corail, L = Lido, S = Semaphore (Villefranche-sur-Mer, France); (4) RG = Rocca Grande, RP = Rocca Piccola, Se = Secca (Ventimiglia, Italy); (5) B1 = Bergeggi 1, B2 = Bergeggi 2 (Bergeggi AMP, Italy); (6) G = Ghigliottina, P = Papa (Tavolara AMP, Italy). |
| In the text | |
|
Fig. 2 Frequency of occurrence of fish species (expressed as number of caves where each fish has been recorded) at the 16 marine caves investigated. |
| In the text | |
|
Fig. 3 Fish assemblage structure based on density data. Two-dimensional non-metric MDS plots of centroids. |
| In the text | |
|
Fig. 4 Fish assemblage structure based on biomass data. Two-dimensional non-metric MDS plots of centroids. |
| In the text | |
|
Fig. 5 Percentage values of (a) total density and (b) total biomass of fishes in all caves studied. |
| In the text | |
|
Fig. 6 Mean (±ES) (a) density and (b) biomass of the cardinal fish Apogon imberbis at the 16 marine caves investigated in this study. |
| In the text | |
|
Fig. S1 Correlation between Apogon imberbis biomass per cave and (1) fish total biomass (without Apogon) per cave (blue dots) and (2) fish species richness (red dots). Solid and dotted lines indicate, respectively, significant and not significant linear correlation. |
| In the text | |
Current usage metrics show cumulative count of Article Views (full-text article views including HTML views, PDF and ePub downloads, according to the available data) and Abstracts Views on Vision4Press platform.
Data correspond to usage on the plateform after 2015. The current usage metrics is available 48-96 hours after online publication and is updated daily on week days.
Initial download of the metrics may take a while.