| Issue |
Aquat. Living Resour.
Volume 34, 2021
|
|
|---|---|---|
| Article Number | 4 | |
| Number of page(s) | 12 | |
| DOI | https://doi.org/10.1051/alr/2021004 | |
| Published online | 19 March 2021 | |
Research Article
Effects of a lagoon on performances of a freshwater fishpond in a multi-trophic aquaculture system
1
INRAE, Institut Agro, SAS,
35000, Rennes, France
2
INRAE, Univ. Pau & Pays Adour, NUMEA, 64310, Saint-Pée-sur-Nivelle, France
* Corresponding author: This email address is being protected from spambots. You need JavaScript enabled to view it.
Handling Editor: Jacques Slembrouck
Received:
8
April
2020
Accepted:
24
February
2021
Abstract
Integrated multi-trophic aquaculture (IMTA) is a way to help preserve the environment while maintaining a good level of total production. An ecologically semi-intensive pond system was designed in which a polyculture fishpond was associated with a lagoon planted with macrophytes to bioremediate the water. The properties of this “semi-intensive coupled” system (SIC) were compared to those of semi-intensive (SI) and extensive (E) systems, each of which was contained in a single fishpond with the same fish polyculture (common carp (Cyprinus carpio), roach (Rutilus rutilus), and perch (Perca fluviatilis)) as SIC. E differed in that it had half the initial density of fish, and the fish were not fed. Fish growth performances, water quality (chemical and biological indicators), chlorophyll concentrations, and invertebrate production were measured. The systems were compared based on fish production performances and physicochemical and biological characteristics, and were then described using principal component analysis (PCA). Carp and roach in the two fed systems had higher growth performances than those in E. Compared to SI, the planted lagoon in SIC, induced a decrease of 15% in fish growth performances and of 83% in total chlorophyll concentration (a proxy for phytoplankton) but improved water quality (−34%, −60% and −80%, for the concentrations of total nitrogen, total phosphorus, and blue green algae (for micro-algae in class Cyanophyceae), respectively). According to the PCA, SIC clearly differed from SI in benthic macro-invertebrate production and concentrations of total nitrogen, total phosphorus, and brown algae (for micro-algae in class Dinophyceae or a branch of Bacillariophyta) in the water. SIC differed from E in oxygen parameters (dissolved and saturation), estimated annual zooplankton production, and pH. In conclusion, the properties of a lagoon reveal perspectives for environmentally friendly practices, while using biodiversity and secondary production in order to enhance fish production.
Key words: IMTA / common carp / Phytoplankton / Zooplankton / Nitrogen / phosphorus
© C. Jaeger et al., by EDP Sciences 2021
 This is an Open Access article distributed under the terms of the Creative Commons Attribution License (https://creativecommons.org/licenses/by/4.0), which permits unrestricted use, distribution, and reproduction in any medium, provided the original work is properly cited.
1 Introduction
A future goal for aquaculture is to increase production while also preserving the environment. Therefore, it is essential to identify strategies that recover nutrients released from fish farming in order to design systems that emit less pollution and require fewer resources. Integrated multi-trophic aquaculture (IMTA) is one of the most promising pathways for changing aquaculture systems (Troell et al., 2003). IMTA is based on integrating complementary species in the trophic chain that inhabit the same or different compartments of the ecosystem. Inorganic and organic waste from fed aquaculture species (e.g. finfish) are respectively assimilated by autotrophic species (e.g. phytoplankton, macroalgae, macrophytes) and heterotrophic species (e.g. filter feeders or detritivorous organisms) that are co-cultured with the fed aquaculture species. Thus, the generic concept of IMTA covers a large set of practices based on the complementarity of productive compartments and is applied to many groups of species that inhabit different ecological niches.
Polyculture in fishponds is one example of IMTA. Polyculture has great potential around the world since the total area of lentic ecosystems (lakes, ponds and impoundments) is dominated in area by millions of water bodies smaller than 1 ha (Downing et al., 2006). In France, 30 000 fishponds, representing 60 000 ha out of a total area of 120 000 ha of freshwater ponds, are regularly harvested (Schlumberger and Girard, 2013). Nevertheless, use of fishponds has been changing from fish farming to recreational activities (hunting, angling) for decades. In some cases, ponds are simply abandoned or dry up, resulting in a loss of biodiversity and a change in the landscape. In this context, the European Union ERANET COFASP IMTA-EFFECT project (Integrated Multi-Trophic Aquaculture for Efficiency and Environmental ConservaTion) developed IMTA strategies for fish farmers to design new production systems that are efficient, economically attractive, robust, and environmentally friendly. The project provided scientific references for the increases in nutrient and energy efficiency generated by associating different aquatic species from different levels in the food web. There is a need to understand better interactions among species from different trophic levels in IMTA and to provide reliable and practical references for implementing IMTA (Petrea et al., 2017; Cunha et al., 2019; Li et al., 2019; Pouil et al., 2019).
Based on previous studies, an ecologically intensive pond system was designed in which a polyculture fishpond was associated with a lagoon that was planted with macrophytes to bioremediate the water (Aubin et al., 2014; Jaeger and Aubin, 2018). There are many advantages to use wetlands in this manner. For example, the water treatment process is based on natural properties (no chemicals or additives are used), and construction, maintenance, and operating costs are considerably lower than those of conventional water treatment plants. Constructed wetlands can improve the local hydrological system by improving local water absorption and retention, as well as groundwater recharge. Their aesthetic value is considerably greater than that of conventional wastewater treatment systems, as is their positive effects on wildlife and contribution to conservation goals of areas (Acierno et al., 2006). Vegetation within fishpond is known to have positive effects on fish productivity (Gabaldon et al., 2018) but to the best of our knowledge, effects of planted lagoons on growth performances of fish from a coupled fishpond had not been investigated, even more in taking into account the role and the complexity of the environment as a whole. Thus, the objective of this study was to assess the effect of a planted lagoon on performances of fish production and, to characterize semi-intensive coupled, semi-intensive and extensive fishponds on biotic and abiotic characteristics.
2 Materials and methods
2.1 Experimental design
The experimental design consisted of three treatments, each with two replicates (Fig. 1). The first treatment,semi-intensive coupled (SIC), consisted of two adjacent ponds: (i) one fishpond in which fish were fed commercial pellets (Tab. 1) and (ii) one lagoon, planted with several species of macrophytes (Nasturtium officinale, Nuphar lutea, Glyceriaaquatica, Ceratophyllum demersum, Pontederia cordata) with no fish introduced. A water pump was set in the lagoon to circulate water between the two ponds. Water returned to the lagoon via gravity through a second pipe. The pipe opening was covered with a net with a mesh size that allowed only the smallest fry to pass through. In the second treatment, semi-intensive (SI), fishponds were similar to the fishponds in the first treatment in fish assemblage, fish density, and feeding. A water pump was used to create a stream to reproduce the same water movement as in the fishponds in the SIC treatment. In the third treatment, extensive (E), the density of each fish species that was half that of those in the other two treatments, and the fish were notfed formulated feed. For this system, the water used to fill the ponds and the sediment already present on the bottom were the only nutrient sources.
The fish assemblage in the polyculture was composed of three species (Fig. 1). Common carp (Cyprinus carpio), was chosen for its ability to disturb the sediment, which induces pond bioturbation and enhances nutrient cycling through the food web (Rahman et al., 2008; Anton-Pardo and Adamek, 2015). The high market demand of the carp was an additional factor that helped to introduce this fish species in the polyculture composition and also why it was such largely stocked compared to the others species selected. Only juvenile carp were stocked to avoid reproduction. A total of 3 300 carp were randomly divided among the 6 fishponds: 660 in each SIC and SI fishpond (100 kg.ha−1) and 330 in each E fishpond. Roach (Rutilus rutilus), the second species reared, was chosen for its reproductive capacity, and individuals considered as old enough for breedingat the coming spring were stocked. Roach fry were expected to eat phytoplankton and zooplankton, and to be a source of food for carp and perch(Perca fluviatilis, the third species reared). Three hundred roach were randomly divided among the 6 fishponds: 60 in each SIC and SI fishpond (45 kg.ha‑1) and 30 in each E fishpond. Perch was chosen for its carnivorous diet, with a trophic level of 4.4, vs. 3.1 and 3.0 for carp and roach, respectively (FishBase, 2019; Christensen and Pauly, 1992). Perch was expected to control numbers of roach fry, tadpoles (Rana esculenta), and crayfish (Procambarusclarkii) (Neveu, 2001) in the surrounding environment. Only male perch were stocked, to avoid reproduction. At stocking, for each fish, a soft pressure on the abdomen was performed and the individuals releasing seminal liquid were selected. Fifty perch were randomly divided among the 6 fishponds: 10 in each SIC and SI fishpond, (i.e. 200 fish.ha−1 – 2 kg.ha−1) and 5 in each E fishpond (Appendix A).
The experiment was conducted during 281 days, in the pond facilities of the French National Research Institute for Agriculture, Food and Environment Research's Unit of Aquatic Ecology and Ecotoxicology (INRAE, U3E, Rennes, France, 48°07'13” N, 1°47'33” W). Eight 500 m2 (20 m × 25 m) ponds 1 m deep were used in the experiment, as described by Jaeger and Aubin (2018). The bottoms of the ponds were composed of a mix of clay and sediment. The deepest end of each pond was equipped with an overflow pipe that was connected to an outlet monk, from which fish were caught when the pond was drained. The ponds were closed-systems that were filled, four weeks before stocking fish, with water from the river running along the site. During the experiment, water was regularly added to compensate for evaporation, especially in the lagoon, to maintain water flow between ponds. At the end of the experiment, for three days in early November, the overflow pipe was removed to drain the ponds, and fish were harvested at the exit of the outlet monk.
 |
Fig. 1 Diagram of the experimental design with two replicates in each system. |
Composition and calculated nutrient content of the formulated feed supplied from April 14 to November 2, 2016.
2.2 Monitoring and measurements
2.2.1 Fish
At the beginning of the experiment, all the perch stocked and a subsample of 200 carp and 154 roach were individually weighed and sized. From this subsample of carp, the first 100 measured were stocked in the SIC fishpond 1 and the last 100 were stocked in the SI fishpond 1. The remaining carp and roach were sorted by species and weighed in groups, while aiming to balance mean weight between fishponds. Formulated feed was supplied during 202 days (April–November), five days a week, at a theoretical rate of 3.7 ± 1.3% live weight.day−1. The same amount of formulated feed was supplied once a day, to each fishpond from SIC and SI, and was weighed and recorded daily. Nevertheless the amount of formulated feed was adjusted daily as a function of water temperature (daily measured, always in the same fishpond from SI) and carp weight (estimated weekly from a theoretical growth curve). At the end of the experiment, for each pond, fish were harvested, counted and sorted by species and size class (adult or fry). For each species and size class, and from each pond, a sample of fish was individually sized and weighed, and the remaining fish were weighed in groups.
From these data, Fulton's condition factor (K), survival rate, specific growth rate (SGR), and feed conversion rate (FCR) were calculated, as follows: where Ki is Fulton's condition factor of individual fish i of a given species, Wi is individual live weight (g), and Li is individual length at the caudal fork (cm). And K is the mean Ki of a given species.
 where Ns is the number of fish of a given species at the start of the experiment, and Nh is the number of adults of the species at harvest.
 where Wh is the mean wet weight at harvest (g), and Ws is the mean wet weight at stocking (g).
To calculate FCR, we considered only carp biomass and assumed that only carp consumed the formulated feed, even though other species had also consumed some of it. Production intensity (PI, kg.ha−1), which equals the total amount of fish biomass produced during the experiment for one hectare of pond, was also calculated.
2.2.2 Water quality monitoring
Once a week, at 15:00 ± 1 h (corresponding to the time when formulated feed was supplied), several physical parameters of the water were measured: temperature (t°) (multi parameter Templight Hobo Data Loggers, 64K UA-002-64, Onset Co.), pH (WTW 340i, Sentix Plus 41probe), conductivity (WTW 340i, Tetracon 325probe), dissolved oxygen (DO) and oxygen saturation (%O2) (HACH HQ30, LDO probe), and turbidity (Secchi disk).In additional, water was collected from the center of the pond within the first 50 cm under the surface, in a bucket of 10 l, for chemical analysis (described below). From this bucket, a volume of 250 ml of water was collected in a sampling plastic flask in which drops of sulfuric acid (25N) were immediately added to stop bacterial activity, and then samples were stored at 3 °C for a couple of days until analyses. Water was collected when the ponds were initially filled, once a month thereafter, and each time river water was added to the ponds to compensate for evaporation and seepage. At the end of the rearing period, each pond was drained in one-third increments and a 250 ml water sample was collected at the exit of the outlet monk at each increment. Water was analyzed to estimate concentrations of phosphate phosphorus (PO4-P) and total phosphorus (TP) (ISO 6878:2004), ammonia nitrogen (NH3-N) (ISO 11372:1997), nitrite nitrogen (NO2-N) and nitrate nitrogen (NO3-N) (ISO 13395:1996), and total nitrogen (TN) (ISO 119051:1997).
2.2.3 Biological indicators
Chlorophyll concentrations in the water were also measured in each pond once a month from May to November, at the same time that water samples were collected for chemical analysis. From 1 L of water collected, a fluorometer phytoplankton analyzer (PHYTO-PAM, WALZ Co., Germany) determined chlorophyll concentrations from blue green algae (bla) (micro-algae in class Cyanophyceae), brown algae (bra) (micro-algae in class Dinophyceae or a branch of Bacillariophyta), green algae (gra) (micro-algae in classes Chlorophyceae, Tebrouxiophyceae or Zygophyceae), and total phytoplankton (tpp). Chlorophyll a concentrations in each pond were measured (AFNOR standard NF T90-117) at the same time thatwater samples were collected, using a spectrophotometer (Analytik Jena SPECORD 205S/TBIO).
Annual production of zooplankton and benthic macro-invertebrates (BMI),were also estimated for each pond, as described in previous published protocols (Bayona et al., 2014, 2015). For this purpose, 6.5 L of water were sampled for zooplankton once a month, at the same time that water was sampled for chlorophyll. Samples were collected from a boat to avoid disturbing the water column (Hanson et al., 2007). The water collected was passed through a 32 μm mesh sieve and the sieve content was transferred into a vial to preserve it with neutralized stained formalin solution (4% final concentration). Similarly, BMI were sampled twice (May and September) according to the PLOCH protocol (Oertli et al., 2005) using a 500 μm mesh net. For both zooplankton and BMI, animals were sorted, identified, and counted in different size classes using a standard sieve column of decreasing mesh size (1, 0.5, 0.25, 0.125, 0.063 and 0.04 mm for zooplankton; 8, 4, 2, 1, 0.5 mm for BMI) to determine taxon abundances. In the same time, to estimate individual dry weight of each taxon, in each size class, for zooplankton, as well as BMI, previous measurements of total length of individuals of each taxon, in each sieve, combined to allometric relations from the literature were used. Thus, according to the individual weights per size class of zooplankton and BMI obtained and the taxon abundances previously determined, the biomass of each communities was estimated. The individual weights were also used to estimate the daily growth rate of zooplankton and BMI, based on published relationships between individual weight and water temperature. In addition, chlorophyll a concentrations were also used to estimate daily growth rate of zooplankton (Morin and Dumont, 1994; Zhou et al., 2010). The biomass and growth rates calculated were extrapolated for each month of the experiment and then summed to estimate the annual secondary production.
3 Data analysis
Before statistical analysis, data were tested for normality (Shapiro test) and then for homoscedasticity between treatments (Bartlett test).
For fish, data from individual measurements were tested at the beginning and end of the experiment using representative samples of each fish population for each fishpond and within treatments. Hence, samples represented 100–123 carp, 26–58 roach, 7–251 roach fry and 3–10 perch (Tab. 2). Hence, statistical analyses were performed for live weight and K using ANOVA (type III test, RcmdrMisc package of R software (v. 3.6.1)) to detect differences among fishponds and treatments for each fish species.
For the rest of the parameters, normality and homoscedasticity were not met, even after data transformations, a Kruskal-Wallis nonparametric test was used to detect differences among treatments for the entire duration of the experiment in water temperature, pH, DO, %O2, conductivity, turbidity, TN, TP, tpp and percentages of bla (%bla), bra (%bra) and gra (%gra). When differences were detected, a Wilcoxon test was used to compare pairs of treatments; differences were considered significant at p < 0.05.
The Principal component analysis (PCA) was performed to determine fishponds profiles related to biotic and abiotic variables, and how they were characterized by these variables. Thus it is expected to clearly discriminate and represent treatments in taking into account also criteria which could have not been statistically analyzed. In order to select variables for the PCA, the Hmisc package of R was used to calculate correlations between the following variables for each fishpond over the entire experiment: PI, t°, %O2, DO, pH, conductivity, TN, TP, turbidity, bla, bra, gra, zooplankton and BMI. The number of variables selected was limited to five, to not exceed the number of individuals. Thus, to maximize information on the PCA axes, TP, tpp, DO, conductivity, and BMI were selected because these variables, despite having correlation coefficients from −0.65 to 0.78, were not significantly (p < 0.05) correlated with each other (Fig. 2). They also represented the biological and physicochemical context of the fishpond system. The variables excluded from the PCA were used as supplementary variables, while treatment and feed were used as supplementary qualitative variables. Then, the PCA was performed in using the FactoMineR package in which data were centered-scaled before calculation. To describe the PCA axes, the dimdesc package of R was used to calculate correlations and the statistical significance (Fisher's test) between the quantitative and qualitative parameters and the axes.
All the raw data are available in open access (Jaeger, 2020).
Mean weight and Fulton's condition factor (K) determined using individual measurements by fishpond, treatment, and fish species at stocking and harvest.
 |
Fig. 2 Correlation matrix between the considered variables in the water. PI is fish production intensity, t. is temperature, turbidity is mean water turbidity, X. O2 is oxygen saturation, DO is dissolved oxygen, zooplankton is estimated zooplankton production, BMI is estimated benthic macro-invertebrate production, TP is total phosphorus concentration, TN is total nitrogen concentration, bla is concentration of chlorophyll from blue green algae, bra is concentration of chlorophyll from brown algae, gra is concentration of chlorophyll from green algae, tpp is the total chlorophyll concentration. X.bla, X.bra and X.gra are the proportions of chlorophyll from blue green, brown, and green algae in tpp, respectively. Circles indicate significantly (p < 0.05) positive (blue) and negative (red) correlations. |
4 Results
4.1 Fish
For individual measurements, mean weight of perch at stocking did not differ significantly among fishponds or treatments (Tab. 2). For roach, mean weight in fishpond 1of the Etreatment differed significantly (F = 5.6, df = 5, p < 0.01) from those in the other fishponds, and mean weight of the SIC and SI treatments (36.4 ± 20.2 and 44.1 ± 26.7 g, respectively) differed significantly (F = 3.8, df = 2, p < 0.05) from that of the E treatment (54.5 ± 47.5 g). At harvest, mean weights of carp differed significantly (F = 109.8, df = 2, p < 0.01) among the SIC (184.3 ± 93.7 g), SI (222.4 ± 101.1 g), and E (104.7 ± 43.9 g) treatments. For roach, fry and adults, mean weights at harvest were significantly higher (p < 0.01) in the SIC and E treatments than in the SI treatment. For perch, no significant difference was observed among treatments.
At stocking, mean K of perch did not differ significantly among fishponds or treatments. For roach, mean K in fishpond 1 of the E treatment differed significantly from those in the other fishponds (F = 2.88, df = 5, p < 0.05). The mean K for the SIC and SI treatments (1.45 ± 0.12 and 1.43 ± 0.13, respectively) differed significantly (F = 4.66, df = 2, p < 0.05) from that of the E treatment (1.51 ± 0.14). At harvest, mean K of carp were significantly higher (F = 53.91, df = 2, p < 0.01) in the SIC and SI treatments (2.65 ± 0.23 and 2.68 ± 0.35, respectively) than in the E treatment (2.42 ± 0.22). For roach fry, mean K were significantly higher (F = 16.51, df = 2, p < 0.01) in the SIC and E treatments than in the SI treatment. For roach adults or perch, no significant difference was observed among treatments.
According to results of group measurements (i.e. total fish numbers, mean weight, and survival rate), survival rates were similar for each species among treatments with a rate of 74 ± 4% for carp, 91 ± 6% for roach and 73 ± 22% for perch (Appendix A). At harvest, mean weight of carp of the SIC treatment was 21% lower than that of the SI treatment but 84% higher than that of the E treatment. Similarly, PI was highest in the SI treatment, mainly because most biomass in the fishponds was carp (Fig. 3). In addition, carp had the highest SGR in the SI treatment (Appendix A).
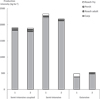 |
Fig. 3 Production of fish biomass by species and fishpond in the coupled, semi-intensive, and extensive treatments within each replicate (1 and 2). |
4.2 Water quality
Mean water temperature did not differ significantly among treatments, but mean pH did (p < 0.01). Mean conductivity was significantly lower (p < 0.05) in the SIC and SI treatments (308 ± 67 and 304 ± 41 mS.cm−1, respectively) than in the E treatment (336 ± 70 mS.cm−1). Oxygen (DO and %O2) was significantly lower (p < 0.01) in the SIC treatment than in the SI and E treatments. Turbidity differed significantly (p < 0.01) among treatments, with water turbidity highest in the E treatment (51 ± 28 cm), followed by the SIC (40 ± 20 cm) and SI (27 ± 25 cm) treatments. TN differed significantly (p < 0.01) among treatments, being lowest in the E treatment (1.38 ± 0.72 mg.l−1) compared to the SIC (1.79 ± 0.92 mg.l−1) and SI (2.77 ± 1.57 mg.l−1) treatments. TP did not differ significantly between the SIC and E treatments (0.15 ± 0.10 and 0.11 ± 0.05 mg.l−1, respectively), but they were significantly lower than that of the SI treatment (0.31 ± 0.35 mg.l−1) (Tab. 3).
Means (and standard deviations (SD)) of physicochemical parameters of fishpond water recorded weekly (temperature, pH, DO: dissolved oxygen, %O2: oxygen saturation, conductivity and turbidity) or monthly (TN: total nitrogen, TP: total phosphorus) from March-December.
4.3 Chlorophyll and invertebrates
Tpp did not differ significantly between the SIC and the E treatments (30 ± 24 and 45 ± 33 μg.l−1, respectively), but they were significantly lower than that of the SI treatment (153 ± 140 μg.l−1). Differences were also observed in the chlorophyll composition. %bla did not differ significantly between the SIC and SI treatments (27 ± 18% and 23 ± 10%, respectively), but they were significantly higher (p < 0.01) than that of the E treatment (12 ± 6%). %bra did not differ significantly between the SIC (20 ± 20%), SI (33 ± 25%), and E (22 ± 25%) treatments. %gra did not differ significantly (p < 0.01) between the SIC and SI treatments (53 ± 19% and 44 ± 26%, respectively), but they were significantly lower than that of the E treatment (67 ± 21%).
From August to October, total chlorophyll concentrations were highest in the SI treatment and peaked in September (340 μg.l−1). For the E treatment, the concentrations were the highest in August (92 μg.l−1) whereas for the SIC treatment it was in October (61 μg.l−1) (Fig. 4). Although more than 50% of the chlorophyll was from gra, the increase in chlorophyll observed from August to September corresponded to an increase in chlorophyll from bla and bra in the SI treatment.
Mean values of annual zooplankton production were estimated at 37 and 193 kg DM.ha−1.year−1 for the fishponds and the lagoons, respectively, in the SIC treatment, and at 209 and 491 kg DM.ha−1.year−1 for the fishponds in the SI and E treatments, respectively (Tab. 4). Mean values of annual BMI production were estimated at 34 and 145 kg DM.ha−1.year−1 for the fishponds and the lagoons, respectively, in the SIC treatment, and at 57 and 36 kg DM.ha−1.year−1 for the fishponds in the SI and E treatments, respectively.
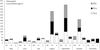 |
Fig. 4 Cumulative concentration of chlorophyll from blue green (Bla), brown (Bra) and green (Gra) algae, by treatment (Semi-intensive coupled: SIC, Semi-intensive: SI and Extensive: E) during the experiment. |
Estimated annual production of zooplankton (zoopk) and benthic macro-invertebrates (BMI) in each fishpond and lagoon of the Semi-intensive coupled (SIC), Semi-intensive (SI), and Extensive (E) treatments.
4.4 PCA
The first two axes of the PCA's correlation circle explained 83% of total variability (54% and 29% for axis 1 and 2, respectively) (Fig. 5). Variables TP and BMI were significantly correlated with axis 1, while DO was significantly correlated with axis 2. The cosine-square of the angle between a variable and its projected on an axe represents the quality of representation of a variable. To estimate the quality of representation of a variable on a plan composed of two axes, the indicator cos2 is used and represents the sum of the cosine-square of a variable related to the two axes of the plan considered. The best representation is for cos2 = 1. All variables used in the PCA were well represented in the correlation circle, since cos2for each exceeded 0.75, or nearly so. Among supplementary variables, TN and bra were significantly correlated with axis 1, while %O2, pH, and zooplankton were significantly correlated with axis 2.
On the PCA biplot, the SI treatment was significantly positively correlated with axis 1, while the SIC treatment was significantly negatively correlated with axis 2 (Fig. 5). Axis 1 separated the fishponds in the SIC and the E treatments from those in the SI treatment, whereas axis 2 separated the fishponds in the SIC treatment from those in the E treatment. Thus, the three treatments differed in their position on the biplot.
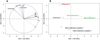 |
Fig. 5 (A) Correlation circle of the principal component analysis. Only explanatory variables (solid black arrows) and supplementary variables (dashed blue arrows) with cos2 ≥ 0.75 are shown. Arrows without names are supplementary variables with cos2 < 0.75. TP is total phosphorus concentration, tpp is total chlorophyll concentration, DO is dissolved oxygen, BMI is estimated benthic macro-invertebrate production, PI is fish production intensity, t. is water temperature, X. O2 is oxygen saturation, TN is total nitrogen concentration, bra is chlorophyll concentration from brown algae, and zooplankton is estimated zooplankton production. (B) Position of replicate fishponds 1 and 2 of each treatment in the biplot of the principal component analysis. |
5 Discussion
5.1 Fish production
As expected, fishponds that received formulated feed produced more fish biomass and had higher yields than E fishponds. The overall performances for fish growth in each fishpond were due mainly to carp biomass. Results for roach and perch, including roach fry, did not clearly identify a treatment with performances different from the others, whereas better performances for roach could be expected from E fishpond 1 since, at stocking, the mean weight of roach from this fishpond was higher than that from the others. This difference was due to the fact that the batches were completed one after the other to limit handling of fish. Unfortunately, the number of individuals available was too low and the remaining roach to complete the batch of the E fishpond 1 were too heavy to be similar in mean weight to the others batches. Thus, in the future, the method should be improved in completing the batches simultaneously while balancing mean weight between fishponds in adding in turn a few fish weighed in advance.
Assuming that individual measurements represented the population of each fish species and each fishpond, mean K, body length at the fork, and weight of perch and roach did not differ significantly among fishponds at harvest. The tested rearing conditions seemed to benefit more to perch than to roach. The presence of roach fry indicates that the individuals stoked spawned during the experiment but, as expected, no fry of carp or perch were observed. Thus, although roach and perch produced less biomass than carp in the three treatments, it may be interesting to investigate on which resources each species fed, as observed in Nahon et al. (2020) in which common carp fed mainly formulated feed and roach consumed also natural food sources. Such results could also explain for instance, why perch did not have a better growth in fed fishponds than in E fishponds and could provide information to improve the balance or composition of fish species in polyculture. Indicators for carp, such as biomass at harvest, SGR and FCR, in addition to PI, were similar to previous results for this species, with better performances in the SI treatment than in the SIC treatment (Jaeger and Aubin, 2018).
5.2 Food web production
In the SIC treatment, macrophytes out competed phytoplankton for nutrients from the lagoon, as already observed (Barbe et al., 2000), especially in the case of high density of macrophytes (Iacarella et al., 2018). Thus, the lower phytoplankton concentrations in the fishponds of the SIC treatment may explain its lower invertebrate production, especially of zooplankton. In addition, from a fish production viewpoint, the SIC treatment had lower net weight gain and higher FCR than the SI treatment, which suggests that the presence of a lagoon (the only element differing between the two treatments) could decrease fish growth. That macrophytes outcompeted phytoplankton for nutrients could induce that the food web was not oriented toward developing of organisms on which fish could feed. References on zooplankton concentrations in fishpond are available (Schlottidl, 1991) but, to the best of our knowledge, annual production of zooplankton in fishpond polyculture has not been explored yet. In comparison, zooplankton production ranged from 122 kg DM.ha−1.year−1 in natural ponds in the southeastern USA (Lemke and Benke, 2009) to 2880–5930 kg DM.ha−1.year−1 in a waste stabilization pond in Luxembourg (Cauchie et al., 2000) versus 25–500 kg DM.ha−1.year−1in the present study. Conversely, the low concentrations of phytoplankton in the E treatment may have been due to the high invertebrate production and grazing by fry during its early growth stages. Thus, in the SIC treatment, the low phytoplankton concentration might have indirectly influenced growth of fish, which might not have benefited from the food web as much as in the SI treatment. This could have been the case especially in early growth stages, when small carp depended more on zooplankton and invertebrates, which is consistent with Gabaldon et al. (2018) for who the biomass of fish and their growth are positively related to the plankton abundance. The lack of access to resources such as zooplankton and BMI, located in the lagoon, might have not benefited fish as much as in the other treatments. This is in contradiction with Brune et al. (2003), who indicated that using wetlands to improve water quality does not influence the net productivity of fish per total unit area, which is usually similar to that of conventional pond culture. For Neori et al. (2004) placing different species together in a single polyculture pond requires compromises in farm management, which results in a decrease in the yield of each organism compared to that in monocultures, but an increase in the yield of the overall polyculture.
5.3 Water remediation
Regarding water quality, reflected by mean TN and TP, the lagoon planted with macrophytes improved water quality during the production cycle. If macrophytes have effect on reducing nitrogen concentrations by assimilation and helping denitrifying bacteria, it seems that they do not strongly have effect on TP reduction (Iacarella et al., 2018). The decrease of TP in water was most probably due to settling of sediment in the system (Jaeger and Aubin, 2018; Pouil et al., 2019). More generally, sediment in ponds is useful for its potential for denitrification and phosphorus sorption (Hargreaves, 2006). The most common technique for managing pond sediments is to dry them between two production cycles, which prompts mineralization and denitrification and thus reduces organic carbon and nitrogen contents (Brune et al., 2003). Thus, sediment represents a stock of nutrients usable by primary producers. Therefore, ponds used for water remediation can also be used to grow fish, especially species that increase the biological stability of the pond (e.g. algaegrazers, bottom dwellers) (vanRijn, 1996), or helped by periodic harvesting of macrophyte (Saha and Jana, 2003). Nonetheless, the main disadvantage of this system, like of conventional fishponds, is inconsistent purification due to unpredictable fluctuations in phytoplankton biomass and speciation in the reservoir (vanRijn, 1996). Therefore, systems characterized by high initial macrophyte densities and food webs in which grazing zooplankton dominate seem more resilient to nutrient inputs (Iacarella et al., 2018).
5.4 Fishpond characterization
Given the number of individuals observed (6) and number of variables used (5), the biplot description of the systems provided almost as much information (82.9%) as if the variables had been independent (88.6%) (Husson et al., 2009). Thus, fishponds in the SI treatment were characterized mainly by BMI, TP, TN and bra, while those in the E treatment were characterized mainly by DO, %O2, zooplankton, and pH. The SIC and SI treatments were distinguished well, even though they were both fed treatments. Thus, the PCA clearly indicated that the SIC treatment differed from the two other treatments, which emphasizes the influence of the lagoon in the system.
6 Conclusion
Adding a lagoon to improve water quality is efficient but has the disadvantage to decrease fish growth performances. So, in the present configuration of SIC, solutions have to be identified to recover the level of fish growth performances from SI, while maintaining water quality. As observed in the lagoon, production of invertebrates represents a potential that could contribute to improve fish growth. Promoting use of primary production, as support of invertebrate production, in a different configuration than a lagoon, could be a solution for providing natural fish feed once it is accessible to fish. To this end, promoting mineralization and release of nutrients accumulated in the sediment can increase primary production and thus production of the entire food web. In conclusion, using local nutrients in fishponds, to promote primary production, enhancing invertebrate production, while maintaining good water quality, are key factors to improve and apply pond-based IMTA.
Acknowledgements
The authors would like to acknowledge Antoine Gallard, Bernard Joseph, Yoann Bennevault, Caroline Gorzerino, Martine Ollitrault, Maïra Coke, Didier Azam, the entire team of the INRA-U3E experimental site, and all the kind volunteers who helped weigh and measure the fish. Thanks also to Laurence Carteaux, Béatrice Trinkler and Yannick Fauvel for the analyses. This experiment was financially supported by the ERA NET COFASP IMTA Effect program (https://www6.inrae.fr/imta-effect). Lastly, the authors would like to warmly thank the organization and scientific committees to have permitted them to present their works during the conference “Ecological Intensification: a new paragon for sustainable aquaculture”.
Appendix
Growth performances and survival rates of fish by treatment (Semi-intensive coupled: SIC, Semi-intensive: SI and Extensive: E), fishpond replicate and fish species.
References
- Acierno R, Blancheton Jean-Paul, Bressani G, Ceruti Laetitia, Chadwick D, Roque D'Orbcastel Emmanuelle, Claricoates J, Donaldson G. 2006. Manual on effluent treatment in aquaculture: Science and Practice. Aquaetreat. CONTRACT N. COLL-CT-2003-5003 05. https://archimer.ifremer.fr/doc/00000/6496/. [Google Scholar]
- Anton-Pardo M, Adamek Z. 2015. The role of zooplankton as food in carp pond farming: a review. J Appl Ichthyol 31: 7–14. [Google Scholar]
- Aubin J, Rey-Valette H, Mathé S, Wilfart A, Legendre M, Slembrouck J, Chia E, Masson G, Callier M, Blancheton JP, Tocqueville A, Caruso D, Fontaine P. 2014. Guide de mise en œuvre de l’intensification écologique pour les systèmes aquacoles © Diffusion, INRA-Rennes, p. 131. ISBN: 978-2-9547969-1-8. [Google Scholar]
- Barbe J, Schlumberger O et al. 2000. Evaluation de la production piscicole potentielle des étangs. Ingénieries − EAT 22: 49–62. [Google Scholar]
- Bayona Y, Roucaute A et al. 2014. Secondary production of freshwater zooplankton communities exposed to a fungicide and to a petroleum distillate in outdoor pond mesocosms. Environ Toxicol Chem 33: 836–846. [CrossRef] [PubMed] [Google Scholar]
- Bayona Y, Roucaute M et al. 2015. Effect of thiram and of a hydrocarbon mixture on freshwater macroinvertebrate communities in outdoor stream and pond mesocosms: I. Study design, chemicals fate and structural responses. Ecotoxicology 24: 1976–1995. [CrossRef] [PubMed] [Google Scholar]
- Brune DE, Schwartz G et al. 2003. Intensification of pond aquaculture and high rate photosynthetic systems. Aquacult Eng 28: 65–86. [CrossRef] [Google Scholar]
- Cauchie HM, Hoffmann L, et al. 2000. Metazooplankton dynamics and secondary production of Daphnia magna (Crustacea) in an aerated waste stabilization pond. J Plankton Res 22: 2263–2287. [Google Scholar]
- Christensen V, Pauly D. 1992. ECOPATH-II − a software for balancing steady-state ecosystem models and calculating network characteristics. Ecol Model 61: 169–185. [CrossRef] [Google Scholar]
- Cunha ME, Quental-Ferreira H, et al. 2019. Understanding the individual role of fish, oyster, phytoplankton and macroalgae in the ecology of integrated production in earthen ponds. Aquaculture 512: 734297. [Google Scholar]
- Downing JA, Prairie YT, et al. 2006. The global abundance and size distribution of lakes, ponds, and impoundments. Limnol Oceanogr 51: 2388–2397. [Google Scholar]
- FishBase. 2019. Froese, R. and D. Pauly Editors, World Wide Web electronic publication, www.fishbase.org, version (12/2019). [Google Scholar]
- Gabaldon C, Buseva Z, et al. 2018. Littoral vegetation improves the productivity of drainable fish ponds: interactive effects of refuge for Daphnia individuals and resting eggs. Aquaculture 485: 111–118. [Google Scholar]
- Hanson ML, Graham DW, et al. 2007. Influence of isolation on the recovery of pond mesocosms from the application of an insecticide. I. Study design and planktonic community responses. Environ Toxicol Chem 26: 1265–1279. [CrossRef] [PubMed] [Google Scholar]
- Hargreaves JA. 2006. Photosynthetic suspended-growth systems in aquaculture. Aquacult Eng 34: 344–363. [CrossRef] [Google Scholar]
- Husson F, Lê S, Pagès J. 2009. Analyse de données avec R, Presses Universitaires de Rennes, p. 238. ISBN: 978-2-7535-4869-5. [Google Scholar]
- Iacarella JC, Barrow JL, et al. 2018. Shifts in algal dominance in freshwater experimental ponds across differing levels of macrophytes and nutrients. Ecosphere 9. [Google Scholar]
- Jaeger C, Aubin J. 2018. Ecological intensification in multi-trophic aquaculture ponds: an experimental approach. Aquat Living Resour 31: 36. [CrossRef] [EDP Sciences] [Google Scholar]
- Jaeger C. 2020. Biological and physico-chemical dataset from different freshwater fishponds systems in IMTA, Portail Data INRAE. DOI: 10.15454/PTXLHE. [Google Scholar]
- Lemke AM, Benke AC. 2009. Spatial and temporal patterns of microcrustacean assemblage structure and secondary production in a wetland ecosystem. Freshwat Biol 54: 1406–1426. [CrossRef] [Google Scholar]
- Li M, Callier MD, et al. 2019. Bioremediation of fishpond effluent and production of microalgae for an oyster farm in an innovative recirculating integrated multi-trophic aquaculture system. Aquaculture 504: 314–325. [Google Scholar]
- Morin A, Dumont P. 1994. A simple-model to estimate growth-rate of lotic insect larvae and its value for estimating population and community production. J N Am Benthol Soc 13: 357–367. [CrossRef] [Google Scholar]
- Nahon S, Roussel JM, et al. 2020. Characterization of trophic niche partitioning between carp (Cyprinus carpio) and roach (Rutilus rutilus) in experimental polyculture ponds using carbon (δC-13) and nitrogen (δN-15) stable isotopes. Aquaculture 522. [Google Scholar]
- Neori A, Chopin T, et al. 2004. Integrated aquaculture: rationale, evolution and state of the art emphasizing seaweed biofiltration in modern mariculture. Aquaculture 231: 361–391. [Google Scholar]
- Neveu A. 2001. Can resident carnivorous fishes slow down introduced alien crayfish spread? Efficacity of 3 fishes species versus 2 crayfish species in experimental design. Bull Fr Peche Piscic 683–704. [CrossRef] [EDP Sciences] [Google Scholar]
- Oertli B, Auderset-Joye D, et al. 2005. PLOCH: a standardized method for sampling and assessing the biodiversity in ponds. Aquat Conserv −Mar Freshw Ecosyst 15: 665–679. [CrossRef] [Google Scholar]
- Petrea SM, Mogodan A, Metaxa I, Plăcintă S, Vasile MA, Huian G. 2017. A comparative study on the evaluation of cyprinids growth performance in IMTA systems. AACL Bioflux 10: 87–102. [Google Scholar]
- Pouil S, Samsudin R, et al. 2019. Nutrient budgets in a small-scale freshwater fish pond system in Indonesia. Aquaculture 504: 267–274. [Google Scholar]
- Rahman MM, Nagelkerke LAJ, et al. 2008. Relationships among water quality, food resources, fish diet and fish growth in polyculture ponds: a multivariate approach. Aquaculture 275: 108–115. [Google Scholar]
- Saha S, Jana BB. 2003. Fish-macrophyte association as a low-cost strategy for wastewater reclamation. Ecol Eng 21: 21–41. [Google Scholar]
- Schlumberger O, Girard P. 2013. Mémento de pisciculture d'étang, Editions Quae, p. 222. ISBN: 978-2-7592-1894-3 [Google Scholar]
- Schlottidl K. 1991. Development of zooplankton in fishponds of the Waldviertel (lower Austria). J Appl Ichthyol-Z Angew Ichthyol 7: 223–229. [CrossRef] [Google Scholar]
- Troell M, Halling C, et al. 2003. Integratedmariculture: asking the right questions. Aquaculture 226: 69–90. [Google Scholar]
- vanRijn J. 1996. The potential for integrated biological treatment systems in recirculating fish culture − a review. Aquaculture 139: 181–201. [Google Scholar]
- Zhou M, Carlotti F, et al. 2010. A size-spectrum zooplankton closure model for ecosystem modelling. J Plankton Res 32: 1147–1165. [Google Scholar]
Cite this article as: Jaeger C, Roucaute M, Nahon S. 2021. Effects of a lagoon on performances of a freshwater fishpond in a multi-trophic aquaculture system. Aquat. Living Resour. 34: 4
All Tables
Composition and calculated nutrient content of the formulated feed supplied from April 14 to November 2, 2016.
Mean weight and Fulton's condition factor (K) determined using individual measurements by fishpond, treatment, and fish species at stocking and harvest.
Means (and standard deviations (SD)) of physicochemical parameters of fishpond water recorded weekly (temperature, pH, DO: dissolved oxygen, %O2: oxygen saturation, conductivity and turbidity) or monthly (TN: total nitrogen, TP: total phosphorus) from March-December.
Estimated annual production of zooplankton (zoopk) and benthic macro-invertebrates (BMI) in each fishpond and lagoon of the Semi-intensive coupled (SIC), Semi-intensive (SI), and Extensive (E) treatments.
Growth performances and survival rates of fish by treatment (Semi-intensive coupled: SIC, Semi-intensive: SI and Extensive: E), fishpond replicate and fish species.
All Figures
|
Fig. 1 Diagram of the experimental design with two replicates in each system. |
| In the text | |
|
Fig. 2 Correlation matrix between the considered variables in the water. PI is fish production intensity, t. is temperature, turbidity is mean water turbidity, X. O2 is oxygen saturation, DO is dissolved oxygen, zooplankton is estimated zooplankton production, BMI is estimated benthic macro-invertebrate production, TP is total phosphorus concentration, TN is total nitrogen concentration, bla is concentration of chlorophyll from blue green algae, bra is concentration of chlorophyll from brown algae, gra is concentration of chlorophyll from green algae, tpp is the total chlorophyll concentration. X.bla, X.bra and X.gra are the proportions of chlorophyll from blue green, brown, and green algae in tpp, respectively. Circles indicate significantly (p < 0.05) positive (blue) and negative (red) correlations. |
| In the text | |
|
Fig. 3 Production of fish biomass by species and fishpond in the coupled, semi-intensive, and extensive treatments within each replicate (1 and 2). |
| In the text | |
|
Fig. 4 Cumulative concentration of chlorophyll from blue green (Bla), brown (Bra) and green (Gra) algae, by treatment (Semi-intensive coupled: SIC, Semi-intensive: SI and Extensive: E) during the experiment. |
| In the text | |
|
Fig. 5 (A) Correlation circle of the principal component analysis. Only explanatory variables (solid black arrows) and supplementary variables (dashed blue arrows) with cos2 ≥ 0.75 are shown. Arrows without names are supplementary variables with cos2 < 0.75. TP is total phosphorus concentration, tpp is total chlorophyll concentration, DO is dissolved oxygen, BMI is estimated benthic macro-invertebrate production, PI is fish production intensity, t. is water temperature, X. O2 is oxygen saturation, TN is total nitrogen concentration, bra is chlorophyll concentration from brown algae, and zooplankton is estimated zooplankton production. (B) Position of replicate fishponds 1 and 2 of each treatment in the biplot of the principal component analysis. |
| In the text | |
Current usage metrics show cumulative count of Article Views (full-text article views including HTML views, PDF and ePub downloads, according to the available data) and Abstracts Views on Vision4Press platform.
Data correspond to usage on the plateform after 2015. The current usage metrics is available 48-96 hours after online publication and is updated daily on week days.
Initial download of the metrics may take a while.