| Issue |
Aquat. Living Resour.
Volume 32, 2019
|
|
|---|---|---|
| Article Number | 15 | |
| Number of page(s) | 10 | |
| DOI | https://doi.org/10.1051/alr/2019013 | |
| Published online | 14 June 2019 | |
Research Article
The effects of environmental factors and fisheries management on recreational catches of perch Perca fluviatilis in the Czech Republic
Institute for Evaluations and Social Analyses, Sokolovská 351/25, 186 00 Prague, Czech Republic
* Corresponding author: This email address is being protected from spambots. You need JavaScript enabled to view it.
; This email address is being protected from spambots. You need JavaScript enabled to view it.
Handling Editor: Verena Trenkel
Received:
9
January
2019
Accepted:
17
May
2019
Abstract
The Eurasian perch Perca fluviatilis is an important fish species in both commercial and recreational fisheries. However, there is concern that perch populations in Central Europe are decreasing. This study aimed to assess the effects of environmental factors and management on recreational perch catches. Data from individual angling logbooks collected by the Czech Fishing Union on 229 fishing grounds during the period 2005–2016 were used in this study. In total, almost 60 000 perch weighing 17 500 kg were recorded. During the study period, total perch catches decreased by 60%, catch per fishing visit decreased by 70%, average body weight of caught perch increased by 18%, and percentage of fishing grounds with perch catches decreased by 13%. The results indicated that the decreasing catches were due to increasing fishing pressure. Further, fishing grounds with higher fishing visit rates had higher catches in general but lower catch per fishing visit. Larger and more productive rivers also showed higher catches. In contrast, the intensity of fish stocking did not affect catches. In conclusion, perch populations in Central Europe are likely under high fishing pressure, and the pressure is further increasing.
Key words: Angling diaries / fisheries management / game fishing / piscivorous fish species / population dynamics / sports fishing
© EDP Sciences 2019
1 Introduction
The European perch (Perca fluviatilis) is a common fish species in most of Europe and a valuable fish species in both commercial and recreational fisheries (Nilsson et al., 2004; Psuty, 2010). Although perch is a predatory species, it is usually not given as much management attention as other predatory fish species like pike Esox lucius, catfish Silurus glanis, or pikeperch Sander lucioperca. These species usually have closed seasons and minimum legal angling sizes, and are overall more valuable to anglers than perch (Linhart et al., 2002; Humpl et al., 2009; Jankovský et al., 2011; Boukal et al., 2012). Perch used to be an abundant species in Europe and Asia, especially in larger and slow flowing rivers (Kubečka, 1992). Perch is often used as a bait fish for other predator fishes, and it is therefore frequently killed and taken by anglers at smaller sizes and in significant numbers (own observation). The fact that perch is sometimes not considered as a typical predatory fish has a significant effect on the behavior of anglers towards this species – anglers sometimes think that perch does not need as much protection and conservation as other piscivorous fish species (Czech Fishing Union, unpubl. data). Fisheries managers and owners of fishing clubs usually share the same opinion (Heermann et al., 2013).
Previous studies have shown that recreational fishing can have a significantly negative impact on inland freshwater ecosystems and freshwater fish populations (Cooke and Cowx, 2004). The combination of changes in agricultural practices, suboptimal management of water resources, and increased fishing pressure have had a negative effect on populations of many freshwater fish species (Kearney, 2002; Coleman et al., 2004; Cooke and Cowx, 2004; Lewin et al., 2006; Dubois et al., 2008). Anglers, fisheries managers, and environmentalists have recently pointed out that populations of perch in the Czech Republic might be decreasing, similar to perch populations elsewhere in Central Europe (Watson, 2008; Tockner et al., 2009). Especially Czech anglers are complaining that perch used to be more abundant in the wild and that there are fewer rivers where perch can be reliably observed and caught (own observation). Perch used to be one of the most abundant fish species in inland freshwater ecosystems in Europe (Kubečka, 1992, 1993). Anglers in the Czech Republic regularly indicate that perch catches are becoming more difficult to obtain; however, strong and reliable statistical evidence of this statement has been missing so far. There are some studies on catches of perch in the scientific literature (Dubois et al., 2008; Heermann et al., 2013; Skov et al., 2017). However, there is no study that describes recreational catches of perch on a larger number of fishing grounds over a longer period of time. Angling for perch is gaining popularity, and similar studies are therefore becoming increasingly important (Psuty, 2010).
This study aimed to assess the number of perch caught by recreational anglers on a large number of fishing grounds (229) over more than a decade (12 years). The goal was to examine time trends in catch, yield, size of caught fish, proportion of perch in overall catches and yield, and the percentage of fishing grounds with and without perch catches. We hypothesized that the observations of anglers and fisheries managers were correct and all these indicators have been decreasing over time. Another goal was to explain the variability in perch catches using the most important environmental and management factors as explanatory variables (fishing effort, ecosystem productivity, eutrophication, fish stocking, temperature, and surface area of the fishing ground).
2 Materials and Methods
2.1 Study area
This study was carried out in the regions of Prague (50° N, 14.5° E) and Central Bohemia (49.5°–50.5° N, 13.5°–15.5° E), Czech Republic, Central Europe (Fig. 1). Together, these regions cover an area of 11 500 km2. The region of Prague has mostly an urban character, while Central Bohemia is mostly agricultural. The study area is dominated by the rivers Elbe and Vltava. Both rivers belong to the upper Elbe River Basin. All rivers in the study area belong to the North Sea Drainage area. The studied fishing grounds are situated in lowlands with an altitude of 200–600 m above sea level. Fishing grounds were defined as stream and river stretches where recreational fishing can be legally conducted.
Waters in the study areas are mostly mesotrophic and eutrophic with a biomass of 150–300 kg of fish per ha (Lyach and Čech, 2018a, b). The study area includes salmonid streams (dominated by salmonids) and non-salmonid rivers (dominated by cyprinids or percids). Studied rivers and streams are mostly at their carrying capacity due to natural fish reproduction and intensive fish stocking (Vostradovský et al., 1995). The majority of rivers in the study area have natural reproducing perch populations (Kubečka, 1992). Eurasian perch is a native fish species in central European waters.
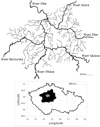 |
Fig. 1 Map of the study area with highlighted regions Central Bohemia (in black; 49.5°–50.5° N, 13.5°–15.5° E) and Prague (in grey; 50° N, 14.5° E). Data were collected on 229 fishing grounds in the two regions during the period 2005–2016. |
2.2 Recreational fishing in the Czech Republic
Recreational fishing in the whole Czech Republic is organized by the Czech Fishing Union (the main authority for recreational fishing in the country). For a detailed description of recreational fishing in the Czech Republic, see Lyach and Čech (2018a, b).
2.3 Angling rules for perch
There was no minimum/maximum legal angling size or closed season during the study period 2005–2016. The bag limit for perch was set to 7 kg of fish per angler per day. Anglers are obliged to measure caught fish to the nearest cm. The weight of caught fish is estimated afterwards from the measured body length (TL, total length), using length-weight tables that were provided by the Czech Fishing Union. The length-weight tables are based on data from catches of many (> 1000 individuals) fish in the study area. Since 2017, the closed season for perch is from 1 January to 15 June. Since 2019, the minimum legal angling size for perch is 15 cm TL.
In the study area, recreational anglers can only fish from the bank with a fishing rod, while no boats or fishing nets are allowed.
2.4 Data sources
Data from annual angling summaries from 229 inland freshwater fishing grounds for 2005–2016 were used for this study. The data originated from angling logbooks, collected from individual anglers. These data included the total catch (number of fish) and yield (kg) of all anglers at all fishing grounds in the study area. For each fishing ground and year, the basic data set consisted of overall catches and yield (all species combined), average catch and yield per visit (all species combined), proportion of perch in the catch and yield, and median weight (kg) of caught perch. In addition, the percentage of fishing grounds with catch of perch in a given year was available. The selected fishing grounds covered an area of 116 km2. These data were originally collected by the Czech Fishing Union and later processed by the authors of this study.
For each fishing ground, the basic environmental and management variables were the annual number and biomass of stocked fish, the surface area of the fishing ground, annual ecosystem productivity, annual mean eutrophication and temperature, and the total annual number of fishing visits. Data on temperature, productivity, and eutrophication were provided by the Czech Hydrometeorological Institute (portal.chmi.cz).
2.5 Statistical analyses
Kruskal–Wallis tests were used to test differences between fishing grounds in total catch and yield per year and per visit, proportion of perch in catch and yield and mean weight of perch. Interannual variations and differences between fishing grounds were modelled using generalized linear mixed effect models (GLMMs) with continuous fixed effects year, temperature, eutrophication, ecosystem productivity, number of stocked fish, biomass of stocked fish, and surface area of the fishing ground, and fishing ground as random effect. All fishing grounds were analyzed for total catch and yield, catch and yield per visit, and the proportion of fishing grounds with catches of perch. Only fishing grounds with actual fish catches (any species) were used in the analysis of the proportion of perch in overall catches and yield, while only fishing grounds with perch catches were used in the analysis of mean weight of caught perch. The number and biomass of stocked fish was averaged over the years 0–3 years prior to the catch year, to estimate the effects of fish stocking. Averaging over this short time period was chosen because perch had no limit in minimum or maximum angling size, perch has a relatively short lifespan, and stocked fish usually display high mortality.
Continuous non-negative metrics (catch, yield, catch and yield per visit) were modelled using Gamma distributions with log link-functions while binomial regression with logit link-function was used for proportional data (proportion in catch). An alpha test level of p = 0.05 was used for all the statistical tests, and all statistical tests were two-tailed. A Bonferroni correction was applied when multiple groups were compared.
The statistical program R (R 386 3.4.1., R Development Core Team 2017) was used for statistical modelling and testing, while figures were drawn in MS Excel. GLMMs were fitted using the R package glmm. The function lmer in the package lme4 (version 0.999375-42; Bates et al., 2011) were used to calculate R-squared values (Nakagawa and Schielzeth, 2013; Jaeger et al., 2017).
3 Results
3.1 Data summary
During the period 2005–2016, recreational anglers visited the studied 229 fishing grounds 4 816 810 times, catching 2 420 689 fish with a total weight of 4757.48 tons. During the same time period, recreational anglers caught 58 483 perch with a total weight of 17 531 kg (Tab. 1).
Summary of fishing effort by recreational fishers on 225 fishing grounds in the study area. Mean number of fishing visits per fishing ground, total number of fishing visits on all fishing grounds, and total catch (numbers) and yield (kg) for all species on the studied fishing grounds.
3.2 Overall catch and yield
Overall catch and yield of perch summed across fishing grounds decreased between 2005 and 2016 (Fig. 2a and b). Perch catches decreased by 60% (from 40 to 13 fish per fishing ground and year on average); similarly for yield (from 11.4 to 4.5 kg per fishing ground and year on average). Simultaneously, catch and yield per fishing visit also decreased (Fig. 2c and d). Perch catch per visit decreased by 70% (from 0.1 to 0.003 perch per fishing visit on average) as did yield (from 0.003 to 0.0009 kg per fishing visit on average). In contrast, the proportion of perch in both catch and yield was stable over time (Fig. 3a and b). This is partially due to total catch and yield of all fish species decreasing during the same period (Tab. 2, Fig. 3c and d).
The GLMMs showed that decreasing catch and yield over time could be partially explained by an increasing number of fishing visits (Tab. 3). Increased fishing pressure resulted in lower catch and yield. However, eutrophication of freshwater ecosystems and temperature did not significantly affect catch and yield of perch (Tab. 3).
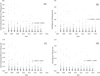 |
Fig. 2 Annual catch and yield of perch per fishing ground (a, b) and mean catch and yield per fishing visit by fishing ground (c, d). Each dot shows an observed value for one fishing ground. |
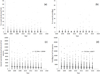 |
Fig. 3 Proportion of perch in total (all species) recreational catches (a) and yield (b) by fishing ground. Total catch (c) and yield (d) of all fish species. |
Results of best GLMM for annual catch and yield of all fish species during the period 2005–2016.
Results of GLMM models for annual total recreational catch and yield of perch Perca fluviatilis summed across all studied fishing grounds in the Czech Republic between 2005 and 2016.
3.3 Size of caught fish
The average body weight of caught perch was quite high with 0.36 kg and was increasing over time (Fig. 4a). The average weight of caught perch increased by 18% (60 g) from 0.32 kg in 2005 to 0.38 kg in 2016. The model with a linear time trend explained 14% of the increase in average body weight. In contrast, eutrophication of freshwater ecosystems, temperature, and number of fishing visits only explained 1% of the changes in body weight of caught perch (Tab. 3).
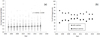 |
Fig. 4 Average body weight (a) of perch in catches of recreational anglers and percentage of fishing grounds with and without perch catches (b). |
3.4 Fishing grounds with perch catches
The number of fishing grounds with actual catches of perch decreased by 13% between 2005 and 2016, from 70 to 57% (Fig. 4b). Anglers were catching perch on a smaller number of fishing grounds every year (Kruskal–Wallis = 25.04, DF = 11, p < 0.001).
3.5 Variability among fishing grounds
Differences between fishing grounds in the four basic metrics – catch, yield, catch per visit, and yield per visit – could be explained by differences in surface area, number of fishing visits, and ecosystem productivity. Larger fishing grounds with higher productivity displayed higher catch and yield. Fishing grounds with more fishing visits displayed lower catch and yield and also lower catch and yield per fishing visit. All four metrics were positively correlated with ecosystem productivity – more productive rivers displayed higher catch and yield (in general and also per fishing visit; Tab. 4).
The difference in the proportion of perch in the overall catch and yield of all fish was more complicated to explain. Larger rivers displayed higher percentages of perch in the overall catch and yield. However, ecosystem productivity affected only catch of perch; yield was not affected by ecosystem productivity. Catch and yield may potentially respond differently to changes in productivity (Tab. 4).
Fish stocking did not affect catch or yield in perch. Fishing grounds with intensive fish stocking did now show higher catch or yield of perch when compared to fishing grounds without fish stocking (Tab. 4).
Increasing size of caught perch could not be reliably explained by any environmental or management factors (Tab. 4).
Results of GLMM models for recreational annual catches of perch Perca fluviatilis on different fishing grounds.
4 Discussion
4.1 Decreasing catches
A 60% decrease in recreation perch catches was found between 2005 and 2016 which was surprisingly steep. At the same time, a decrease in catch has also been reported for most other fish species in the study area (Lyach and Čech, 2018a). This is most likely partly due to the popularity of the catch-and-release fishing strategy (Cooke and Cowx, 2006; Arlinghaus et al., 2007; Gaeta et al., 2013; Brownscombe et al., 2017; Lyach and Čech, 2018a). It also somewhat follows the decrease in populations of other fish species (IUCN, 2018). Conversely, the quality and effectiveness of fishing gear has been increasing, anglers have had better access to fishing know-how, and the popularity of angling has been increasing as well (Marta et al., 2001; Freire et al., 2012; Gupta et al., 2015, Lyach and Čech, 2018a, b). These three factors should have driven fish catches up, but this was not the case. Perch populations are usually too robust to be significantly influenced by stocking (Kubečka, 1992, 1993). The decreased catch could also have been caused by higher timidity (fear of being caught) of fish in populations that are under angling pressure. Härkönen et al. (2016) reported that bolder and more active perch get caught by anglers more often. However, given the large decrease in perch catches, we believe that strong population declines were the main driving factor.
There are several possible reasons for the decrease in perch populations. Agricultural management has changed over time (lower input of nutrients), losses of water in nature are higher due to suboptimal management of agricultural fields and water resources, fishing pressure has been increasing, anglers use small perch as bait for other piscivores, anglers kill fecund females during the spawning season, fisheries management keeps stocking competitors of perch such as asp (predation) and common carp (competition for food), the number of piscivorous predators (cormorants, catfish) in large rivers is increasing, water managers have removed spawning substrates from larger rivers (fallen trees and dead wood), and artificial manipulation of water levels exposes perch nests (Dubois et al., 2008; Copp et al., 2009; Jankovský et al., 2011; Musil et al., 2011; Parris, 2011; Heermann et al., 2013; Johnston et al., 2013; Salmi et al., 2015; Skov et al., 2017; Lyach and Čech, 2018a, b). The catch-and-release strategy causes some amount of perch mortality as well, mostly because smaller perch are vulnerable to deep hooking (Garner et al., 2016). The real reason for population decreases in perch is most likely a combination of all factors listed above. The decrease in the number of fishing grounds with catches of perch could potentially mean that perch populations are withdrawing from previously occupied areas. As Monk and Arlinghaus (2017) reported from the lake Kleiner Döllnsee, movement and habitat selection of perch is influenced by angling pressure. Haakana and Huuskonen (2008) also found that perch populations diminish in areas with strong fishing pressure. Inversely, by studying perch populations along the Finnish coastal areas in the Baltic Sea, Lehikoinen et al. (2017) reported increased Catch per unit effort (CPUE) despite the increased numbers of cormorants and anglers in the area. It is possible that very robust marine perch populations are less vulnerable to fishing pressure than smaller river perch populations. By studying recreational catches of perch over the course of 50 years in lake Geneva (Switzerland), Dubois et al. (2008) found that perch populations declined in response to changes in trophic parameters (mainly due to lower input of phosphorus).
Perch catches per fishing ground were found to be very small. There are several possible explanations for this. Firstly, anglers are mostly taking only larger perch individuals. Secondly, anglers prefer taking other fish species (mainly common carp, larger piscivores, salmonids). Lastly, since the bag limit for all fish together in the study area is 7 kg per day, there is often no room to take perch together with the preferred large-sized fish.
4.2 Fish size and weight
Anglers caught increasingly larger perch every year. As previous studies have shown, anglers continue to take larger fish in general (Birkeland and Dayton, 2005). Catching fish for food is not as popular as it used to be (Lyach and Čech, 2018a). People prefer buying a filleted fish in the supermarket instead of preparing a caught one, and preparing many small fish for a meal is especially time-consuming. This creates pressure on larger perch (which are often fecund females; Heermann et al., 2013), and this could potentially negatively influence perch populations (Birkeland and Dayton, 2005).
The average weight of caught perch was quite high (0.36 kg). There are three possible explanations for this. Firstly, anglers often select larger perch and ignore smaller perch. Secondly, water in the Vltava River (one of the two largest rivers in the study area) is eutrophic and warm due to a cascade of upstream dams and perch prefer warm eutrophic waters (Kubečka, 1992, 1993). Lastly, the size of caught perch is likely somewhat exaggerated in the angling logbooks.
4.3 Temporal changes
Both year and the number fishing visits seem to have been the main factors that influenced overall perch catches. This result suggests that a potential decrease in fishing pressure could have a positive effect on perch catches. Since year was also an important factor, the decreased catch was most likely affected by other socio-economic factors that are difficult to measure. For example, the increasing popularity of the catch-and-release strategy in Central Europe could play a major role (Lyach and Čech, 2018a, b). It is possible that high fishing pressure has a negative effect on perch populations even when anglers release caught perch back to the water. Field experiments showed that catch-and-release mortality in perch can be high (Garner et al., 2016). Steep economic growth of countries in Central Europe could be also a factor, especially since salaries in this geographical area grew by more than 20% since the global economic crisis in 2007–2009 (Czech Statistical Office, unpubl. data).
Eutrophication did not affect catches, probably because the input of nutrients was stable over the course of time (Czech Hydrometeorological Institute, unpubl. data). It is also possible that fishing pressure on rivers in the study area was so high that increased input of nutrients did not lead to increased spawning or growth in perch. Higher temperatures should also positively affect perch growth and reproduction (and therefore catches). However, it is possible that high fishing pressure negates the effect of the most important environmental factors.
4.4 Variability among fishing grounds
The fact that fishing grounds with high surface area and high trophic levels displayed higher catches was not surprising. Perch usually prefer large rivers or lakes with high trophic levels and high temperatures (Kubečka, 1992, 1993). Perch is often a dominant species making up 20–30% of total fish biomass in dammed rivers (Kalous et al., 2017). This could also explain why perch was more represented in catches on larger fishing grounds. Similar to this study, previous studies also found that higher catches were often linked to higher fishing effort, especially when the fished population was healthy (Stoeven, 2014). Fishing efficiency (catch per fishing visit) decreased with increasing fishing pressure. This result suggests that rivers in the study area were under high fishing pressure. Previous studies confirmed that decreasing CPUE potentially reflects underlying population decreases in fished species (Ward et al., 2013). It was surprising that fish stocking did not affect fish catches. The main goal of fish stocking is usually to boost wild fish populations and to provide catches for anglers. It is possible that perch populations are too robust to be affected by fish stocking, mortality of stocked fish is too high, or perch are stocked in too low numbers to significantly boost wild populations.
4.5 Dataset limitations
Data from angling logbooks provided a large dataset. However, angling logbooks have known limitations. Some fish catches are usually missing, some fish are poorly measured and incorrectly identified to species level, and some fishing rules are misunderstood by anglers (Essig and Holliday, 1991; Pollock et al., 1994; Cooke et al., 2000; Bray and Schramm, 2001; Mosindy and Duffy, 2007; Lyach and Čech, 2017, 2018a, b). Nonetheless, this dataset provided us with data from 230 locations over 12 years, and therefore it remains one of the best options for similar studies. Perch did not have a closed season or minimum legal angling size over the course of studied years. We therefore had information on perch catches of all sizes and throughout the whole year (Czech Fishing Union, pers. comm.). As previous studies suggested, data on angling catches provide scientists with a very cost effective and cheap way to roughly monitor changes in fish populations (Sztramko et al., 1991; Kerr, 1996; Gudbergson, 2002; Jayasinghe et al., 2006; Mosindy and Duffy, 2007; Skov et al., 2017). In the case of this particular dataset, the Czech Fishing Union collects fisheries data for its own needs, and builds its fisheries management strategy on this dataset (Lyach and Čech, 2017, 2018a, b). That should somewhat ensure high quality of data collection. This type of dataset has been previously used for scientific purposes (Humpl et al., 2009; Jankovský et al., 2011; Boukal et al., 2012; Lyach and Čech, 2017, 2018a, b).
Statistics on catches of anglers can roughly show trends in fish populations; however, these data should be interpreted with caution. This dataset also shows other trends, mainly changes in the popularity of the catch-and-release fishing strategy, as well as changes in the preferences of anglers (Humpl et al., 2009; Jankovský et al., 2011; Boukal et al., 2012; Lyach and Čech, 2017, 2018a, b). Many authors, anglers, and fisheries managers consider this data to be a proxy for changes in fish populations (e.g. Mosindy and Duffy, 2007; Jansen et al., 2013; Skov et al., 2017). In the particular case of perch, the decrease in catches seems to follow a population decrease.
4.6 Management implications
The results of this study showed that the combination of angling data and experience/observations of anglers and fisheries managers can provide scientists with a strong informational background on changes in fish populations. By studying angling records of perch in a large mesotrophic lake, Skov et al. (2017) also concluded that fisheries data provided useful information on changes in fish populations.
5 Conclusion
Perch catches were found to have been decreasing between 2005 and 2016. However, since the proportion of perch in the overall fish catch was stable, the decrease in catch shows a general decrease in catches in most fish species. It seems that fishing pressure was the main driver. Since fishing pressure has been further increasing in the study area, future perch populations could potentially be significantly threatened by recreational fishing. We suggest that future studies should assess the effect of socio-economic trends (e.g. popularity of the catch-and-release strategy) on perch catches.
Acknowledgements
The Czech Fishing Union (namely Jaroslava Fryšová and Pavel Horáček) provided the data. Pavel Vrána from the Czech Fishing Union provided helpful insights into recreational fishing. Anglers and angling guards in the Czech Republic made this study possible. Martin Čech, Marek Omelka, and Otakar Durda provided useful consultations. This study was funded by the Charles University Grant Agency (Grant GA UK No. 112 218) and by the Faculty of Science, Charles University.
References
- Arlinghaus R, Cooke SJ, Lyman J, Policansky D, Schwab A, Suski C, Sutton G, Thorstad EB. 2007. Understanding the complexity of catch-and-release in recreational fishing: An integrative synthesis of global knowledge from historical, ethical, social, and biological perspectives. Rev Fish Sci 15: 75–167. [CrossRef] [Google Scholar]
- Bates D, Maechler M, Bolker B. 2011. lme4: Linear mixed-effects models using S4 classes. R package version 0.999375-39. [Google Scholar]
- Birkeland C, Dayton PK. 2005. The importance in fishery management of leaving the big ones. Trends Ecol Evol 20(7): 356–358. [CrossRef] [PubMed] [Google Scholar]
- Boukal DS, Jankovský M, Kubečka J, Heino M. 2012. Stock-catch analysis of carp recreational fisheries in Czech reservoirs: Insights into fish survival, water body productivity and impact of extreme events. Fish Res 119: 23–32. [CrossRef] [Google Scholar]
- Bray GS, Schramm HL. 2001. Evaluation of a statewide volunteer angler diary program for use as a fishery assessment tool. N Am J Fish Manage 21: 606–615. [CrossRef] [Google Scholar]
- Brownscombe JW, Danylchuk AJ, Chapman JM, Gutowsky LFG, Cooke SJ. 2017. Best practices for catch-and-release recreational fisheries angling tools and tactics. Fish Res 186: 693–705. [CrossRef] [Google Scholar]
- Coleman FC, Figueira WF, Ueland JS, Crowder LB. 2004. The impact of United States recreational fisheries on marine fish populations. Science 305: 1958–1960. [CrossRef] [PubMed] [Google Scholar]
- Cooke SJ, Cowx IG. 2004. The role of recreational fishing in global fish crises. Bioscience 54: 857–859. [Google Scholar]
- Cooke SJ, Cowx IG. 2006. Contrasting recreational and commercial fishing: Searching for common issues to promote unified conservation of fisheries resources and aquatic environments. Biol Conserv 128: 93–108. [CrossRef] [Google Scholar]
- Cooke SJ, Dunlop WI, McLennan DM, Power G. 2000. Applications and characteristics of angler diary programs in Ontario, Canada. Fish Manag Ecol 7: 473–487. [CrossRef] [Google Scholar]
- Copp GH, Britton R, Cucherousset J, García-Berthou E, Kirk R, Peeler E, Stakėnas S. 2009. Voracious invader or benign feline? A review of the environmental biology of European catfish Silurus glanis in its native and introduced ranges. Fish Fish 10(3): 252–282. [CrossRef] [Google Scholar]
- Dubois JP, Gillet C, Hilgert N, Balvay G. 2008. The impact of trophic changes over 45 years on the Eurasian perch, Perca fluviatilis, population of Lake Geneva. Aquat Living Resour 21(4): 401–410. [CrossRef] [Google Scholar]
- Essig RJ, Holliday MC. 1991. Development of a recreational fishing survey: The marine recreational fishery statistics survey case study. Am Fish Soc 12: 245–254. [Google Scholar]
- Freire KMF, Machado ML, Crepaldi D. 2012. Overview of inland recreational fisheries in Brazil. Fisheries 37: 484–494. [CrossRef] [Google Scholar]
- Gaeta JW, Beardmore B, Latzka A, Provencher B, Carpenter SR. 2013. Catch-and-release rates of sport fishes in northern wisconsin from an angler diary survey. N Am J Fish Manage 33: 606–614. [CrossRef] [Google Scholar]
- Garner SB, Dahl KA, Patterson IWF. 2016. Hook performance and selectivity of Eurasian perch, Perca fluviatilis (Linnaeus, 1758) in the Åland Archipelago, Finland. J Appl Ichthyol 32(6): 1065–1071. [CrossRef] [Google Scholar]
- Gudbergson G. 2002. Arctic charr in Lake Myvatn: the centennial catch record in the light of recent stock estimates. Aquat Ecol 38: 271–284. [CrossRef] [Google Scholar]
- Gupta N, Bower SD, Raghavan R, Danylchuk AJ, Cooke SJ. 2015. Status of recreational fisheries in India: development, issues, and opportunities. Rev Fish Sci Aquac 23: 291–301. [CrossRef] [Google Scholar]
- Haakana H, Huuskonen H. 2008. Effects of intensive fishing on the perch population in a large oligotrophic lake in eastern Finland. Fish Res 91(2–3): 144–150. [CrossRef] [Google Scholar]
- Härkönen L, Hyvärinen P, Niemelä PT, Vainikka A. 2016. Behavioural variation in Eurasian perch populations with respect to relative catchability. Acta Ethol 19(1): 21–31. [CrossRef] [Google Scholar]
- Heermann L, Emmrich M, Heynen M, Dorow M, König U, Borcherding J, Arlinghaus R. 2013. Explaining recreational angling catch rates of Eurasian perch, Perca fluviatilis: The role of natural and fishing-related environmental factors. Fish Manag Ecol 20(2–3): 187–200. [CrossRef] [Google Scholar]
- Humpl M, Pivnička K, Jankovský M. 2009. Sport fishery statistics, water quality, and fish assemblages in the Berounka River in 1975–2005. Folia Zool 58(4): 457–465. [Google Scholar]
- IUCN. 2018. The IUCN red list of threatened species. Version 2018-2. http://www.iucnredlist.org (Downloaded November 14, 2018). [Google Scholar]
- Jaeger BC, Edwards LJ, Das K, Sen PK. 2017. An R 2 statistic for fixed effects in the generalized linear mixed model. J Appl Stat 44(6): 1086–1105. [CrossRef] [Google Scholar]
- Jankovský M, Boukal DS, Pivnička K, Kubečka J. 2011. Tracing possible drivers of synchronously fluctuating species catches in individual logbook data. Fish Manag Ecol 18: 297–306. [CrossRef] [Google Scholar]
- Jansen T, Arlinghaus R, Als TD, Skov C. 2013. Voluntary angler logbooks reveal long-term changes in a lentic pike, Esox lucius, population. Fish Manag Ecol 20(2–3): 125–136. [CrossRef] [Google Scholar]
- Jayasinghe UAD, Amarasinghe US, De Silva S. 2006. Culture-based fisheries in non-perennial reservoirs of Sri Lanka: Influence of reservoir morphometry and stocking density on yield. Fish Manag Ecol 13: 157–164. [CrossRef] [Google Scholar]
- Johnston FD, Arlinghaus R, Dieckmann U. 2013. Fish life history, angler behaviour and optimal management of recreational fisheries. Fish Fish 14(4): 554–579. [CrossRef] [Google Scholar]
- Kalous L, Kuříková P, Kohout J, Rylková K, Petrtýl M, Čech M. 2017. Differences in spatial communities of European perch (Perca fluviatilis Linnaeus, 1758) fry in a canyon-shaped reservoir are not attributable to genetics. J Appl Ichthyol 33(2): 306–313. [CrossRef] [Google Scholar]
- Kearney RE. Recreational fishing: Value is in the eye of the beholder, in: T.J. Pitcher, C.S. Hollingworth Eds.. Recreational fisheries: Ecological, economic and social evaluation, Blackwell Science Ltd., Malden, 2002, pp. 17–33. [Google Scholar]
- Kerr SJ. 1996. A summary of Muskies Canada Inc. Angler log information, 1979–1994. Technical Report TR-011, Ontario Ministry of Natural Resources, Kemptville, Ontario, Canada, 107 p. [Google Scholar]
- Kubečka J. 1992. Fluctuations in fyke-net catches during the spawning period of the Eurasian perch (Perca fluviatilis) in the Římov Reservoir, Czechoslovakia. Fish Res 15(1–2): 157–167. [CrossRef] [Google Scholar]
- Kubečka J. 1993. Succession of fish communities in reservoirs of Central and Eastern Europe, in: Comparative reservoir limnology and water quality management, Springer, Dordrecht, pp. 153–168. [CrossRef] [Google Scholar]
- Lehikoinen A, Heikinheimo O, Lehtonen H, Rusanen P. 2017. The role of cormorants, fishing effort and temperature on the catches per unit effort of fisheries in Finnish coastal areas. Fish Res 190: 175–182. [CrossRef] [Google Scholar]
- Lewin WC, Arlinghaus R, Mehner T. 2006. Documented and potential biological impacts of recreational fishing: Insights for management and conservation. Rev Fish Sci 14: 305–367. [CrossRef] [Google Scholar]
- Linhart O, Setch L, Svarc J, Rodina M, Audebert JP, Grecu J, Billard R. 2002. The culture of the European catfish, Silurus glanis, in the Czech Republic and in France. Aquat Living Resour 15(2): 139–144. [CrossRef] [Google Scholar]
- Lyach R, Čech M. 2017. Do otters target the same fish species and sizes as anglers? A case study from a lowland trout stream (Czech Republic). Aquat Living Resour 30, 11. [CrossRef] [Google Scholar]
- Lyach R, Čech M. 2018a. A new trend in Central European recreational fishing: More fishing visits but lower yield and catch. Fish Res 201: 131–137. [CrossRef] [Google Scholar]
- Lyach R, Čech M. 2018b. Do recreational fisheries metrics vary on differently sized fishing grounds? Fish Manag Ecol 25: 356–365. [CrossRef] [Google Scholar]
- Marta P, Bochechas J, Collares-Pereira MJ. 2001. Importance of recreational fisheries in the Guadiana River Basin in Portugal. Fish Manag Ecol 8: 345–354. [CrossRef] [Google Scholar]
- Monk CT, Arlinghaus R. 2017. Eurasian perch, Perca fluviatilis, spatial behaviour determines vulnerability independent of angler skill in a whole-lake reality mining experiment. Can J Fish Aquat Sci 75(3): 417–428. [CrossRef] [Google Scholar]
- Mosindy TE, Duffy MJ. 2007. The use of angler diary surveys to evaluate long-term changes in muskellunge populations on Lake of the Woods, Ontario. Environ Biol Fish 79: 71–83. [CrossRef] [Google Scholar]
- Musil P, Musilová Z, Fuchs R, Poláková S. 2011. Long-term changes in numbers and distribution of wintering waterbirds in the Czech Republic, 1966–2008. Bird Stud 58(4): 450–460. [CrossRef] [Google Scholar]
- Nakagawa S, Schielzeth H. 2013. A general and simple method for obtaining R2 from generalized linear mixed-effects models. Method Ecol Evol 4(2): 133–142. [CrossRef] [Google Scholar]
- Nilsson J, Andersson J, Karas P, Sandstrom O. 2004. Recruitment failure and decreasing catches of perch (Perca fluviatilis L.) and pike (Esox lucius L.) in the coastal waters of southeast Sweden. Boreal Environ Res 9(4): 295–306. [Google Scholar]
- Parris K. 2011. Impact of agriculture on water pollution in OECD countries: Recent trends and future prospects. Int J Water Resour Dev 27(1): 33–52. [CrossRef] [Google Scholar]
- Pollock KH, Jones CM, Brown TL. Angler survey methods and their applications in fisheries management, American Fisheries Society Special Publication 25, Bethesda, 1994, 371 p. [Google Scholar]
- Psuty I. 2010. Natural, social, economical and political influences on fisheries: A review of the transitional area of the Polish waters of the Vistula Lagoon. Mar Pollut Bull 61(4–6): 162–177. [CrossRef] [Google Scholar]
- Salmi JA, Auvinen H, Raitaniemi J, Kurkilahti M, Lilja J, Maikola, R. 2015. Perch (Perca fluviatilis) and pikeperch (Sander lucioperca) in the diet of the great cormorant (Phalacrocorax carbo) and effects on catches in the Archipelago Sea, Southwest coast of Finland. Fish Res 164: 26–34. [CrossRef] [Google Scholar]
- Skov C, Jansen T, Arlinghaus R. 2017. 62 years of population dynamics of European perch (Perca fluviatilis) in a mesotrophic lake tracked using angler diaries: The role of commercial fishing, predation and temperature. Fish Res 195: 71–79. [CrossRef] [Google Scholar]
- Stoeven MT. 2014. Enjoying catch and fishing effort: The effort effect in recreational fisheries. Environ Resour Econ 57(3): 393–404. [CrossRef] [Google Scholar]
- Sztramko LK, Dunlop WI, Powell SW, Sutherland RG. Applications and benefits of an angler diary program on Lake Erie, American Fisheries Society Symposium 12, 1991. [Google Scholar]
- Tockner K, Uehlinger U, Robinson CT. Rivers of Europe, Academic Press, 2009. [Google Scholar]
- Vostradovský J, Pivnička K, Čihař M, Poupě J. 1995. Species diversity, abundance, biomass and yield of fishes in the Elbe River and its tributaries. Bohem Cent 23: 121–127. [Google Scholar]
- Ward HG, Askey PJ, Post JR. 2013. A mechanistic understanding of hyperstability in catch per unit effort and density-dependent catchability in a multistock recreational fishery. Can J Fish Aquat Sci 70(10): 1542–1550. [CrossRef] [Google Scholar]
- Watson L. The European market for perch (Perca fluviatilis), in: P. Fontaine, P. Kestemont, F. Teletchea, N. Wang Eds., Percid fish culture – From research to production, Namur, Belgium, 2008, pp. 10–14. [Google Scholar]
Cite this article as: Lyach R, Remr J. 2019. The effects of environmental factors and fisheries management on recreational catches of perch Perca fluviatilis in the Czech Republic. Aquat. Living Resour. 32: 15
All Tables
Summary of fishing effort by recreational fishers on 225 fishing grounds in the study area. Mean number of fishing visits per fishing ground, total number of fishing visits on all fishing grounds, and total catch (numbers) and yield (kg) for all species on the studied fishing grounds.
Results of best GLMM for annual catch and yield of all fish species during the period 2005–2016.
Results of GLMM models for annual total recreational catch and yield of perch Perca fluviatilis summed across all studied fishing grounds in the Czech Republic between 2005 and 2016.
Results of GLMM models for recreational annual catches of perch Perca fluviatilis on different fishing grounds.
All Figures
|
Fig. 1 Map of the study area with highlighted regions Central Bohemia (in black; 49.5°–50.5° N, 13.5°–15.5° E) and Prague (in grey; 50° N, 14.5° E). Data were collected on 229 fishing grounds in the two regions during the period 2005–2016. |
| In the text | |
|
Fig. 2 Annual catch and yield of perch per fishing ground (a, b) and mean catch and yield per fishing visit by fishing ground (c, d). Each dot shows an observed value for one fishing ground. |
| In the text | |
|
Fig. 3 Proportion of perch in total (all species) recreational catches (a) and yield (b) by fishing ground. Total catch (c) and yield (d) of all fish species. |
| In the text | |
|
Fig. 4 Average body weight (a) of perch in catches of recreational anglers and percentage of fishing grounds with and without perch catches (b). |
| In the text | |
Current usage metrics show cumulative count of Article Views (full-text article views including HTML views, PDF and ePub downloads, according to the available data) and Abstracts Views on Vision4Press platform.
Data correspond to usage on the plateform after 2015. The current usage metrics is available 48-96 hours after online publication and is updated daily on week days.
Initial download of the metrics may take a while.