


Open Access
Fig. 1
Download original image
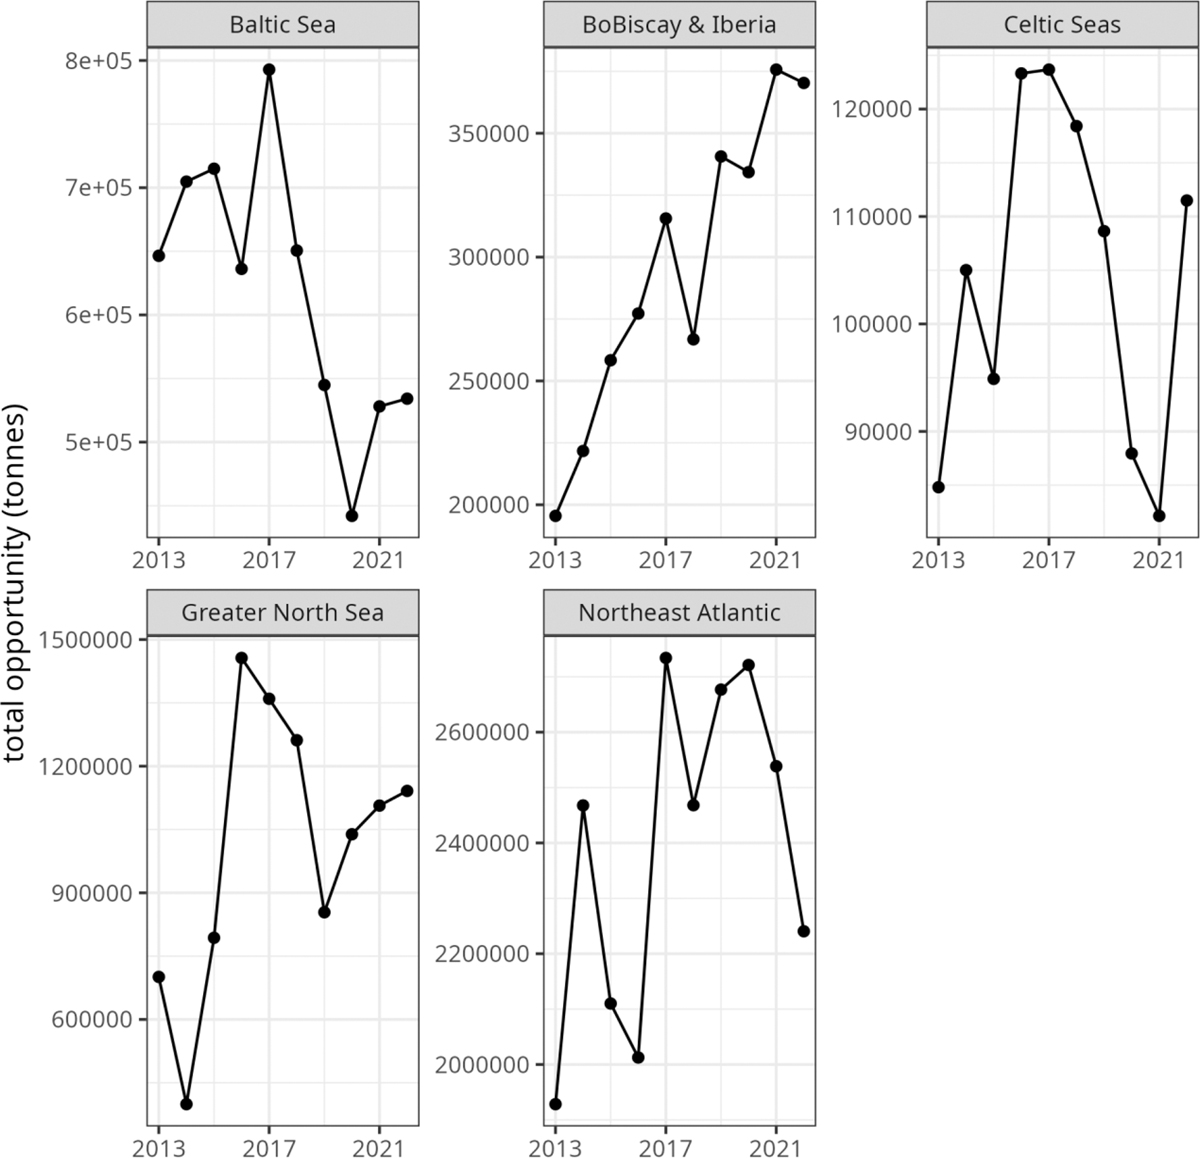
Sum of fishing opportunities per ecoregion. The diagram ends in 2022 since some advice was not available for the latest years. For consistency, only stocks for which fishing opportunities were available each year from 2013 to 2022 were kept. “Northeast Atlantic” refers to widely distributed stocks.
Current usage metrics show cumulative count of Article Views (full-text article views including HTML views, PDF and ePub downloads, according to the available data) and Abstracts Views on Vision4Press platform.
Data correspond to usage on the plateform after 2015. The current usage metrics is available 48-96 hours after online publication and is updated daily on week days.
Initial download of the metrics may take a while.