| Issue |
Aquat. Living Resour.
Volume 35, 2022
Special Issue - COVID-19 effects on fisheries and aquaculture food systems
|
|
|---|---|---|
| Article Number | 15 | |
| Number of page(s) | 11 | |
| DOI | https://doi.org/10.1051/alr/2022017 | |
| Published online | 04 October 2022 | |
Research Article
Challenges and opportunities: impacts of COVID-19 on Norwegian seafood exports
1
University of Florida, Gainnesville, USA and University of Stavanger, Stavanger, Norway
2
BI Norwegian Business School, Bergen, Norway
3
University of Florida, Gainnesville, USA
4
SINTEF Ocean, Trondheim, Norway
5
SNF – Centre for Applied Research at NHH, Bergen, Norway
6
University of South-Eastern Norway, Horten, Norway
7
University of Stavanger, Stavanger, Norway
* Corresponding author: This email address is being protected from spambots. You need JavaScript enabled to view it.
: Olivier Thebaud
Received:
20 February 2022
Accepted:
14 July 2022
Abstract
A rapidly growing literature shows that COVID-19 and the measures to contain the spread of the virus can have significant market impacts for seafood. These can be interruptions of production, or reductions in demand directly or indirectly due to supply chain challenges. In this paper we investigate the potential impacts of COVID-19 on seafood exports from Norway, the world's second largest seafood exporter, using highly detailed data from 2016 through May 2021. These data allow us to assess upstream impacts in the seafood supply chain close to the producer level in aggregate and by main sector, impacts on the largest products, and the extent to which export firm structure and export markets served have changed. We find very few impacts in aggregate as well as for individual products, suggesting that the markets and supply chains used by Norwegian seafood exports were sufficiently robust and flexible to accommodate the shocks created by COVID-19. Given Norway's size as a seafood exporter, the impact of COVID-19 has likely been moderate upstreams for a number of seafood sectors around the world, especially those in wealthy nations, with opportunities balancing out challenges, and that the supply chains have been highly resilient.
Key words: Seafood markets / covid-19 / Norway
© F. Asche et al., Published by EDP Sciences 2022
 This is an Open Access article distributed under the terms of the Creative Commons Attribution License (https://creativecommons.org/licenses/by/4.0), which permits unrestricted use, distribution, and reproduction in any medium, provided the original work is properly cited.
1 Introduction
Measures implemented to limit the spread of the COVID-19 virus in 2020 and 2021 have reduced demand and trade for a number of products worldwide (Bartik et al., 2020; Hayakawa and Mukunoki, 2021; Espitia et al., 2022). This is a potential economic and social challenge as firms struggle with profitability and workers are laid off. There is a rapidly growing literature indicating that this is true also for seafood (e.g. Link et al., 2020; White et al., 2021; Bassett et al., 2021; Coll et al., 2021; FAO, 2020a,b; Gordon, 2021; Lebel et al., 2021). This literature often rely on indicators or interviews as a significant time lag exists before actual data on production, prices and trade is made available1. However, there are also some indications that the picture is not only negative. For instance, Love et al. (2021) show a strong increase in retail demand for seafood in the U.S. that may be large enough to offset the reduction in seafood demand from restaurants in aggregate, although the impact may vary by species and product form as different species market shares vary significantly between market segments (Love et al., 2020, 2022). Yang et al. (2022) show that in China, the prices of a number of vegetable staples increased strongly in response to lockdowns, but that there were only limited impacts on meat and seafood prices, and Villasante et al. (2021) show mixed impacts in the Spanish fishing fleet.
The impacts of lockdowns and other pandemic related measures can take a number of forms depending on the flexibility of producers and markets. At the production level, fishers are likely to be more flexible than aquaculture producers in the short term, as a large share of the total cost are variable for fishers as many costs are variable for fishers and are only incurred is a fishing trip is conducted (e.g., fuel) (Roll et al., 2022). Hence, it may be relatively easy for a fisher to reduce landings in response to lower demand, thereby also reducing income but limiting the downward pressure on price. In the longer run, there may even be positive stock effects due to reduced fishing effort (Stokes et al., 2020). An aquaculture producer will have started the production process much earlier and will have fish at the market size as well as intermediate sizes in the ponds or pens when the market disruption occurred. Hence, the ability to adjust production in the short run is limited as significant costs have already been incurred. As such, one would expect that a strong reduction in demand would have a limited effect on the quantity produced in aquaculture, but a strong price effect due to the limited opportunity to reduce production in the short run (Asche et al., 2017). Moreover, there may be lagged effects in aquaculture as the challenges or uncertainty related to a reduction in demand may reduce the production in the next cycle. Within this context, one might expect a stronger relative quantity response to the crisis for the fisheries sector, and a stronger price response for the aquaculture sector.
Negative price effects can be reduced if producers and exporters can re-allocate supply across different markets and product forms in response to the crisis. The lockdowns and other COVID-19 related measures, and therefore the market and supply-chain disruptions did not occur simultaneously. They started in China in January 2020 (Yang et al., 2022) and spread with the virus, and thereafter varied with the intensity of new virus variants and measures. As such, whether a producer experiences a reduction in aggregate demand will depend on the number of available alternative markets and how flexible the supply chains are. Alternatives can be different markets and supply chains within the same country as for example the shift from restaurants to retail sales discussed by Love et al. (2021) for seafood in the U.S. and by EUFOMA (2022) for turbot in Spain or by the increased importance of direct sales (Stoll et al., 2021), or it can be different countries as seafood is highly traded (Anderson et al., 2018). The important insight is that if reduced demand in one market can easily be accommodated by shifting the supply to other markets, the aggregate demand facing the producer and their revenue will not change very much. The Spanish turbot case is also interesting in that it shows that the shift between supply chains may take some time as well as how the impact differs by company (EUFOMA, 2022).
In this paper we investigate how Norwegian seafood exports responded to COVID-19 measures using highly disaggregated trade data. Norway is the world's second largest seafood exporter (FAO, 2022) and more than 90% of the seafood produced is exported. Hence, trade data reflect the industry's performance well. Norway has a diverse seafood sector with a significant aquaculture industry, groundfish and pelagic fisheries (Cojocaru et al., 2019; Asche et al., 2020) and trade a wide variety of product forms to a large number of countries (Straume et al., 2020a; Cojocaru et al., 2021). The export sector consists of a large number of export companies with different degrees of product and market specialization, where some products are highly dependent on a few companies and markets, while others are well diversified and potentially much more flexible in responding to market shocks (Oglend and Straume, 2019; Straume et al., 2020b; Asche et al., 2021; Oglend et al., 2022). Seafood is a highly traded food group with as much as 78% of the global production exposed to trade competition (Tveteras et al., 2012). Hence, the results should be relevant beyond Norwegian seafood trade as the impacts are likely to be similar for upstream businesses in the seafood industry in many other countries, and particularly in Europe.
The data used in this paper is Norwegian custom declarations, and as most Norwegian seafood exports are relatively un-processed, this means that the analysis is upstreams in the relevant supply chains. The data capture the value and quantity of every export transaction, which company conducts the transaction, the product identified at the 8-digit level in the HS-nomenclature and the destination country. The trade flows will be aggregated to a monthly level for the analysis at the product level, and further aggregated for the more general categories and overall trade patterns. We will follow Love et al. (2021) and visually inspect for movements outside of the range that revenues, quantities and prices had in the four years before 20202.
In the next section we will provide an overview of the trade flows by revenue, quantity and price for the main species groups (aquaculture, whitefish and pelagics). This will be followed by the development of exports for the 25 largest products at the 8-digit level in the HS-nomenclature. There are also a number of important potential impacts beyond the pure economic values. We will here investigate two − whether there is significant changes in the number of exporters or their share of the trade and if there are significant changes in which countries the seafood is exported to.
2 Overall trade
Figure 1 shows the monthly export values by the three main categories aquaculture, whitefish and pelagic. With an average monthly export value of 5.8 billion NOK, aquaculture is by far the most important category3. This category is dominated by salmon, but around 10% of the export value is fresh and frozen whole trout and fresh halibut4. While we do not provide separate figures by processing form, it is worthwhile to note that almost 80% of the exports in the aquaculture category is fresh.
The two categories comprised of wild fish (whitefish and pelagics) have much stronger seasonality. Whitefish is the largest with exports of on average 1.2 billion NOK per month and has cod as the main species, but also includes species like haddock, saithe and Greenland halibut. These are mostly exported in conserved product forms like frozen, dried or salted, although there are also significant fresh exports of cod. The exports of pelagics are on average 0.46 billion NOK per month, with mackerel and herring as the two main species. Aquaculture makes up 77.4% of the export value and 55.3% of the exports by quantity indicating that farmed fish are higher priced than the wild fish. The value of whitefish is significantly higher than for pelagics, although the quantity of pelagic fish is slightly larger than whitefish indicating a much lower average price.
The vertical line in Figure 1 indicates March 2020, the month when lockdowns were implemented in Norway and a number of other European countries, which is the most important market for most Norwegian seafood products (Straume et al., 2020a). There are no clear discontinuities that indicate lockdown effects for the main categories. Aquaculture exports continue with moderate monthly variation in export value. There is strong decline in the export value of whitefish, but this follow the common seasonal pattern that largely corresponds to seasonality in the landings (Birkenbach et al., 2020; Pettersen and Asche, 2020), and it is not stronger than normal. Pelagic species show an even stronger seasonal pattern than whitefish, and this may deviate somewhat from the harvest pattern as most mackerel are stored frozen for a shorter period while the herring is often stored for more than six months (Sogn-Grundvåg et al., 2019). Export value in the months after March 2020 is somewhat stronger than normal and may be a sign that inventories were emptied in response to future uncertainty.
Figure 2 shows the monthly export quantities. These are relatively similar to the patterns for the export values in Figure 1, and there are no obvious differences in quantity response across the sectors following the lockdowns. The prices in Figure 3 also have no clear unexpected movements in the period just after the lockdowns. It is possible that aquaculture has a somewhat wider seasonal decline in the fall of 2020, but the seasonal pattern follows the seasonal cost pattern due to the biological growth cycle (Asche et al., 2017). The slight increase in the pelagic price suggests that the somewhat higher exports after the lockdown is not forced sales in any way, but rather is due to strong demand. Overall, without the vertical lines showing the lockdown period, there is no indication in any of the figures of any shock or other substantial abnormal events occurring in the seafood market at the aggregate level.
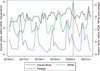 |
Fig. 1 Monthly export value. January 2016–May 2021. |
 |
Fig. 2 Monthly export quantity. January 2016–May 2021. |
 |
Fig. 3 Monthly unit prices in NOK/kg. January 2016–May 2021. |
3 Products
Next, we look at the 25 largest seafood products exported from Norway in the period 2016–2021. These products make up 91% of total seafood exports. These are shown in Table 1 together with the annual averages for the number of exporters and destination markets, as well as annual average export value and quantity for the period 2016–2020 and which of the main categories they belong to. The products are ordered by total export value. Fresh whole salmon is clearly the largest product, and other salmon products are also among the largest products. This is of course not surprising given the importance of the aquaculture category in general and of salmon within that category.
Table 2 shows the annual average number of exporters and exported products, as well as the annual average export value and volume to the 25 largest destination markets (countries) ranked by value over the period 2016–2020. Figure 4 reports the market shares for the largest destination markets over the period. In total Norwegian seafood are exported to 180 different markets during the five-year period. Approximately 90 percent of the export value goes to the 25 largest export markets. Of the 25 markets, 15 are in Europe (and 12 of these are in the EU with Belarus, Ukraine and the UK as the exceptions).
In Figures A1–A3 we show the export values, quantities and prices for all 25 products, where it is worthwhile to note the wide range of unit prices (Fig. A3) so that both high- and low-valued products are represented. The high number of products makes the figures difficult to read. However, it is very hard to detect any impact of the lockdown for any product, and the variation in 2020 is well within the variation observed in the years since 2016 for all products. The largest impacts appear for fresh whole cod and haddock, which prices we show in Figure 5. The prices for both these products were very high at the end of 2019 and had declined significantly in January and February 2020, i.e. before any COVID-19 measures had been implemented. However, the prices continue a strong downward trend which may be influenced by supply chain challenges. As these two products are fresh, there is limited opportunity to avoid poor market conditions by storing them. However, the prices rapidly recover indicating that this was not a reduction in demand that could not be addressed relatively quickly. It is difficult to assess to what extent this is abnormal, as the prices decline at this time of the year because this is when the landings are at their highest as discussed for groundfish in general above. Export quantity is declining rapidly when the prices recover, but this is also the case in earlier years. Hence, while it may be that the COVID-19 measures strengthened the common seasonal cycle, the impact was not very strong beyond the normal pattern.
Norway is the second largest supplier of frozen cod and the largest supplier of frozen haddock to China's re-exporting industry (Asche et al., 2022). These products that are intended for re-exports are among the most price-sensitive supply chains (Anderson et al., 2018). They are first transported around the world to be processed and then generally shipped long distances to Europe or North America before consumption (Yang et al., 2020), suggesting highly complex logistics and supply chains. However, even for these products there are virtually no impacts due to COVID-19, suggesting highly resilient supply chains.
Descriptive statistics. 25 largest export products. Annual averages for 2016–2020.
Descriptive statistics. 25 largest export markets. Annual averages for 2016–2020.
 |
Fig. 4 Average market shares by destination country, 2016–2020. |
 |
Fig. 5 Export prices for fresh whole cod and haddock. |
4 Firms and export markets
While trade flows and prices are useful for an overall assessment of market impacts, the trade flows are the results of the actions of a number of firms in relation to different markets. Hence, even if the effects of the COVID-19 measures are not dramatic in aggregate, there may be important changes in trade patterns. In this section we will look at the number of export markets (countries) served and the number of export firms serving them. We provide two measures for each product; a Herfindahl index for the number of exporters and one for the number of markets. The Herfindahl index (HHI) is a quantitative metric which can measure concentration in a market. The Herfindahl index is computed as the sum of squared market shares Si, i.e., HHI =  . The index takes values between 0 and 1, where it is close to zero if there is little concentration and close to one when there is a high degree of concentration. Hence, if the COVID-19 measures or supply chain challenges lead to a focus on fewer markets, one would expect the associated Herfindahl index to increase. Similarly, if the exports primarily are maintained by a few firms, one would expect the associated Herfindahl index to increase. Table 3 provides the two indexes.
In general, we see that the concentration is lower for aquaculture products than for whitefish and pelagic species, both when it comes to the number of exporters and the number of markets they serve. The concentration measure for the number of export firms is about the same for fresh farmed salmon and fresh whole cod. However, the HHI with respect to number of markets served differs significantly where the HHI for fresh cod is more than three times as large as for salmon indicating that exports of fresh cod are concentrated in fewer markets. We also find high concentration in the export markets for other products of cod, such as dried- and wet salted, and this is consistent with what was suggested by Straume et al. (2020a), although they do not actually compute HHIs. Dried salted cod saithe and dried cod are the product forms where the HHIs changes the most from 2016 to 2020, but the shifts are not large and in terms of number of markets it is a continuation of a change that started in 2019. However, it is possible that COVID-19 has led to fewer markets being served for these products. Two pelagic products that stand out when it comes to the HHI for firms are herring butterflies and skinless fillets of herring. This is not surprising as we can see from Table 1 that this product is sold by relatively few firms.
Most of the HHIs are very stable over the five years, and the exceptions are not between 2019 and 2020. Hence, while we cannot rule out shifts between firms and markets, these are not dramatic. The COVID-19 measures do not appear to have fundamentally changed the structure of the exports or the markets being served for any products.
Herfindahl index for firms and export markets by product 2016–2020.
5 Discussion and concluding remarks
The COVID-19 pandemic and the different measures implemented to slow the spread of the virus have been perceived as a major challenge for industries and trade in general (Hayakawa and Mukunoki, 2021; Espitia et al., 2022) as well as for seafood (Bassett et al., 2021; White et al., 2021; Love et al., 2021). The data presented in this article indicates that this is a challenge that can be overcome. Norwegian seafood exports have not been impacted by the COVID-19 measures to any measurable extent. Seasonal patterns in export quantity, which to a large extent is determined by seasonality in harvest, have not changed very much for the major products, and neither has price. Moreover, the number of exporters and their market shares have not changed significantly, and the export markets being served and the quantities they receive are also relatively unchanged.
This does not suggest that there has not been impacts, as the literature clearly shows some particularly downstreams with the shortfall in restaurant demand (Love et al., 2021). However, in aggregate Norwegian exporters have been able to find alternative markets to the extent there has been disruptions, and supply chain challenges have not been serious enough to prevent such efforts. Moreover, there are no price spikes to suggest that Norwegian exporters have benefitted by having market access while competitors have struggled. This is interesting in that there are several examples of crises for some producers where others have benefitted such as the Chilean disease crisis for salmon (Asche et al., 2017; Salazar and Dresdner, 2021).
Given that Norway is the world's second largest seafood exporter serving more than 100 countries, the results are important as they suggest that many seafood markets and supply chains have worked quite well for many producers at least at upstream levels in the chain. Tveteras et al. (2012) estimated that 78% of global seafood production is exposed to international trade competition, and for most seafood products there are global markets (Anderson et al., 2018). When the second largest seafood exporting country appears to have largely overcome challenges associated with COVID-19, there are a number of seafood sectors around the world that have had a similar experience. Certainly, there has been challenges such as the significant demand reduction from the restaurant sector in many countries. However, Love et al. (2021) noted that increased demand from the retail sector has largely made up for that at least in the U.S. As an example, this is important as it clearly show that the pandemic has also created opportunities. The limited effects on prices suggest that other challenges in specific market segments to a large extent have been addressed in a similar fashion.
While there have certainly been challenges caused by the COVID-19 pandemic, our results give hope for the future due to the opportunities that have also been created. This suggests that more specific studies into sectors where there was an impact would benefit by a balanced approach that also consider the opportunities that were created. The seafood sector may benefit from some of these in the long run. It is well documented that challenges associated with at-home seafood preparation has limited seafood demand (Torrissen and Onozaka, 2017). If the increased retail demand for seafood is indicative of more consumers comfortable with at-home seafood preparation, this may lead to an increased demand for seafood in the long run. The limited effect on many seafood prices also suggest that the global market works quite well. While Gephart et al. (2016) certainly is correct in that international trade may spread some types of shocks, this shows that it can also mitigate other types of shocks and as such, that the seafood markets and the supply chains that are serving them is quite resilient.
Acknowledgments
Financial support from the Norwegian Research Council (#302197, #324685 and #326647) is acknowledged.
Appendix: A
 |
Fig. A1 Export value. All products. |
 |
Fig. A2 Volume, tons. All products. |
 |
Fig. A3 Unit value. All products. |
References
- Anderson JL, Asche F, Garlock T. 2018. Globalization and commoditization: the transformation of the seafood market. J Commod Mark 12: 2–8. [CrossRef] [Google Scholar]
- Asche F, Cojocaru A, Pincinato RB, Roll KH. 2020. Production risk in the Norwegian fisheries. Environ Resour Econ 75: 137–149. [CrossRef] [Google Scholar]
- Asche F, Oglend A, Kleppe T. 2017. Price dynamics in biological production processes exposed to environmental shocks. Am J Agric Econ 99: 1246–1264. [CrossRef] [Google Scholar]
- Asche F, Straume H-M., Vårdal E. 2021. Perish or prosper: trade patterns for highly perishable seafood products. Agribusiness 37: 876–890. [CrossRef] [Google Scholar]
- Asche F, Yang B, Gephart JA, Smith MD, Anderson JL, Camp EV, Garlock TM, Love DC, Oglend A, Straume H-M. 2022. China's seafood imports: not for domestic consumption? Science 375: 386–388. [CrossRef] [PubMed] [Google Scholar]
- Asseng S, Palm CA, Anderson JL, Fresco L, Sanchez PA, Asche F, Garlock TM, Fanzo J, Smith MD, Knapp G, Jarvis A, Adesogan A, Capua I, Hoogenboom G, Despommier DD, Conto L, Garrett KA. 2021. Implications of new technologies for future food supply systems. J Agric Sci. 159: 315–319. [CrossRef] [Google Scholar]
- Bartik AW, Bertrand M, Cullen Z, Glaeser EL, Luca M, Stanton C. 2020. The impact of COVID-19 on small business outcomes and expectations. Proc Natl Acad Sci 117: 17656–17666. [CrossRef] [PubMed] [Google Scholar]
- Bassett HR, Lau J, Giordano C, Suri SK, Advani S, Sharan S. 2021. Preliminary lessons from COVID-19 disruptions of small-scale fishery supply chains. World Dev 143: 105473. [CrossRef] [Google Scholar]
- Birkenbach A, Cojocaru A, Asche F, Guttormsen AG, Smith MD. 2020. Seasonal harvest patterns in multispecies fisheries. Environ Resour Econ 75: 631–655. [CrossRef] [Google Scholar]
- Cojocaru AL, Asche F, Pincinato RB, Straume H-M. 2019. Where are the fish landed? An analysis of landing plants in Norway. Land Econ 95: 246–257. [CrossRef] [Google Scholar]
- Cojocaru AL, Iversen A, Tveteras R. 2021. Differentiation in the Atlantic salmon industry: a synopsis. Aquac Econ Manag 25: 177–201. [CrossRef] [Google Scholar]
- Coll M, Ortega-Cerdà M, Mascarell-Rocher Y. 2021. Ecological and economic effects of COVID-19 in marine fisheries from the Northwestern Mediterranean Sea. Biol Conserv 255: 108997. [CrossRef] [PubMed] [Google Scholar]
- Espitia A, Mattoo A, Rocha N, Ruta M, Winkler D. 2022. Pandemic trade: COVID‐19, remote work and global value chains. World Econ 45: 561–589. [CrossRef] [PubMed] [Google Scholar]
- FAO (Food and Agriculture Organization). 2020a Summary of the impacts of the COVID-19 pandemic on the fisheries and aquaculture sector, June 1st, Available online at http://www.fao.org/3/ca9349en/CA9349EN.pdf [Google Scholar]
- FAO (Food and Agriculture Organization). 2020b. How is Covid-19 outbreak impacting the fisheries and aquaculture food systems and what can FAO do. FAO Fisheries and Aquaculture Department. http://www.fao.org/3/cb1436en/cb1436en.pdf [Google Scholar]
- FAO (Food and Agriculture Organization). 2022. FishStatJ Database. Rome, Italy: FAO. Retrieved February 6, 2022 from http://www.fao.org/fishery/statistics/software/fishstatj/en [Google Scholar]
- Garlock T, Asche F, Anderson JL, Bjørndal T, Kumar G, Lorenzen K, Ropicki A, Smith MD, Tveterås R. 2020. A global blue revolution: aquaculture growth across regions, species, and countries. Rev Fish Sci Aquac. 28: 107–116. [CrossRef] [Google Scholar]
- Gephart JA, Rovenskaya E, Dieckmann U, Pace ML, Brännström Å. 2016. Vulnerability to shocks in the global seafood trade network. Environ Res Lett 11: 035008. [CrossRef] [Google Scholar]
- Gordon DV. 2021. Price and revenue projections under alternative policy shocks due to the coronavirus: Canadian lobster and snow crab. Mar Policy 130: 104556. [CrossRef] [PubMed] [Google Scholar]
- Hayakawa K, Mukunoki H. 2021. The impact of COVID-19 on international trade: evidence from the first shock. J Jpn Int Econ 60: 101135. [CrossRef] [Google Scholar]
- Landazuri-Tveteraas U, Oglend A, Steen M, Straume H. 2021. Salmon trout: the forgotten cousin? Aquac Econ Manag. 25: 159–176. [CrossRef] [Google Scholar]
- Lebel L, Soe KM, Phuong NT, Navy H, Phousavanh P, Jutagate T, Lebel P, Pardthaisong L, Akester M, Lebel B. 2021. Impacts of the COVID-19 pandemic response on aquaculture farmers in five countries in the Mekong Region. Aquac Econ Manag. 25: 298–319. [CrossRef] [MathSciNet] [Google Scholar]
- Link JS, Werner FE, Werner K, Walter J, Strom M, Seki MP et al. 2020. A NOAA Fisheries science perspective on the conditions during and after COVID-19: challenges, observations, and some possible solutions, or why the future is upon us. Can J Fish Aquat Sci 999: 1–12. [Google Scholar]
- Love DC, Allison EH, Asche F, Belton B, Cottrell RS, Froehlich HE, Gephart JA, Hicks CC, Little DC, Nussbaumer EM, da Silva PP, Poulain F, Rubio A, Stoll JS, Tlusty MF, Thorne-Lyman AL, Troell M, Zhang W. 2021. Emerging COVID-19 impacts, responses, and lessons for building resilience in the seafood system. Glob Food Secur. 28: 100494. [CrossRef] [Google Scholar]
- Love DC, Asche F, Conrad Z, Young R, Harding J, Neff R. 2020. Food sources and expenditures for seafood in the United States. Nutrients 12: 1810. [CrossRef] [Google Scholar]
- Love DC, Asche F, Young R, Nussbaumer EM, Anderson JL, Botta R, Conrad Z, Froehlich HE, Garlock TM, Gephart JA, Ropicki A, Stoll JS, Thorne-Lyman AL. 2022. An overview of retail sales of seafood in the United States, 2017- 2019. Rev Fish Sci Aquac 30: 259–270. [CrossRef] [Google Scholar]
- Oglend A, Straume H-M. 2019. Pricing efficiency across destination markets for Norwegian salmon exports. Aquac Econ Manag 23: 188–203. [CrossRef] [Google Scholar]
- Oglend A, Asche F, Straume H-M. 2022. Estimating pricing rigidities in bilateral transactions markets. Am J Agric Econ 104: 209–227. [CrossRef] [Google Scholar]
- Pettersen IK, Asche F. 2020. Hedonic price analysis of ex-vessel cod markets in Norway. Mar Resour Econ 35: 343–359. [CrossRef] [Google Scholar]
- Roll KH, Asche F, Bjørndal T. 2022. The effect of introducing fuel tax to the Norwegian fishery industry. Mar Policy 135: 104829. [CrossRef] [Google Scholar]
- Salazar L, Dresdner J. 2021. Market integration and price leadership: the U.S. Atlantic salmon market. Aquac Econ Manag. 25: 243–268. [Google Scholar]
- Sogn-Grundvåg G, Zhang D, Iversen A. 2019. Large buyers at a fish auction: the case of the Norwegian pelagic auction. Mar Policy 104: 232–238. [CrossRef] [Google Scholar]
- Stokes GL, Lynch AJ, Lowe BS, Funge-Smith S, Valbo‐Jørgensen J, Smidt SJ. 2020. COVID-19 pandemic impacts on global inland fisheries. Proc Natl Acad Sci 117: 29419–29421. [CrossRef] [PubMed] [Google Scholar]
- Stoll JS, Harrison HL, De Sousa E, Callaway D, Collier M, Harrell K, Jones B, Kastlunger J, Kramer E, Kurian S, Lovewell MA, Strobel S, Sylvester T, Tolley B, Tomlinson A, White ER, Young T, Loring PA. 2021. Alternative seafood networks during COVID-19: Implications for resilience and sustainability. Front Sustain Food Syst 5: 614368. [CrossRef] [Google Scholar]
- Straume HM, Anderson JL, Asche F, Gaasland I. 2020a. Delivering the goods: the determinants of Norwegian seafood exports. Mar Resour Econ 35: 83–96. [CrossRef] [Google Scholar]
- Straume HM, Landazuri-Tveteraas U, Oglend A. 2020b. Insights from transaction data: Norwegian aquaculture exports. Aquac Econ Manag 24: 255–272. [CrossRef] [Google Scholar]
- Torrissen J, Onozaka Y. 2017. Comparing fish to meat: perceived qualities by food lifestyle segment. Aquac Econ Manag 21: 44–70. [CrossRef] [Google Scholar]
- Tveteras S, Asche F, Bellemare MF, Smith MD, Guttormsen AG, Lem A, Lien K, Vannuccini S. 2012. Fish is food − the FAO's fish price index. PLoS ONE 7: e36731. [CrossRef] [PubMed] [Google Scholar]
- Villasante S, Tubío A, Ainsworth G, Pita P, Antelo M, Da-Rocha JM. 2021. Rapid assessment of the COVID-19 Impacts on the Galician (NW Spain) seafood sector. Front Mar Sci 1410. [Google Scholar]
- White ER, Froehlich HE, Gephart JA, Cottrell RS, Branch TA, Agrawal Bejarano R, Baum JK. 2021. Early effects of COVID‐19 on US fisheries and seafood consumption. Fish Fish 22: 232–239. [CrossRef] [PubMed] [Google Scholar]
- Yang B, Asche F, Li T. 2022. Consumer behavior and food prices during the COVID-19 pandemic: evidence from Chinese cities. Econ Inquiry 60: 1437–1460. [CrossRef] [Google Scholar]
Asseng et al. (2021) provides an interesting perspective on forecasting of food production, and show that predictions are doing particularly poorly when there is a high degree of uncertainty.
We have also conducted regressions for the value, quantity and unit price for all the aggregate categories as well as the 25 product forms where we perform structural break tests in March 2020 when controlling for seasonal and yearly variation. None of these tests indicated significant impacts due to COVID-19, although it should be noted that they are likely to have low power given the relatively few observations.
The exchange rate between NOK and EUR was about 10 in 2021, while it was about 9 between NOK and USD.
Landazuri-Tveteraas et al. (2021) indicate that large trout is a very close substitute to salmon.
Cite this article as: Asche F, Straume H-M, Garlock T, Johansen U, Kvamsdal SF, Nygaard R, Pincinato RBM, Tveteras R. 2022. Challenges and opportunities: impacts of COVID-19 on Norwegian seafood exports. Aquat. Living Resour. 35: 15
All Tables
Descriptive statistics. 25 largest export products. Annual averages for 2016–2020.
Descriptive statistics. 25 largest export markets. Annual averages for 2016–2020.
All Figures
|
Fig. 1 Monthly export value. January 2016–May 2021. |
| In the text | |
|
Fig. 2 Monthly export quantity. January 2016–May 2021. |
| In the text | |
|
Fig. 3 Monthly unit prices in NOK/kg. January 2016–May 2021. |
| In the text | |
|
Fig. 4 Average market shares by destination country, 2016–2020. |
| In the text | |
|
Fig. 5 Export prices for fresh whole cod and haddock. |
| In the text | |
|
Fig. A1 Export value. All products. |
| In the text | |
|
Fig. A2 Volume, tons. All products. |
| In the text | |
|
Fig. A3 Unit value. All products. |
| In the text | |
Current usage metrics show cumulative count of Article Views (full-text article views including HTML views, PDF and ePub downloads, according to the available data) and Abstracts Views on Vision4Press platform.
Data correspond to usage on the plateform after 2015. The current usage metrics is available 48-96 hours after online publication and is updated daily on week days.
Initial download of the metrics may take a while.