Fig. 4
Download original image
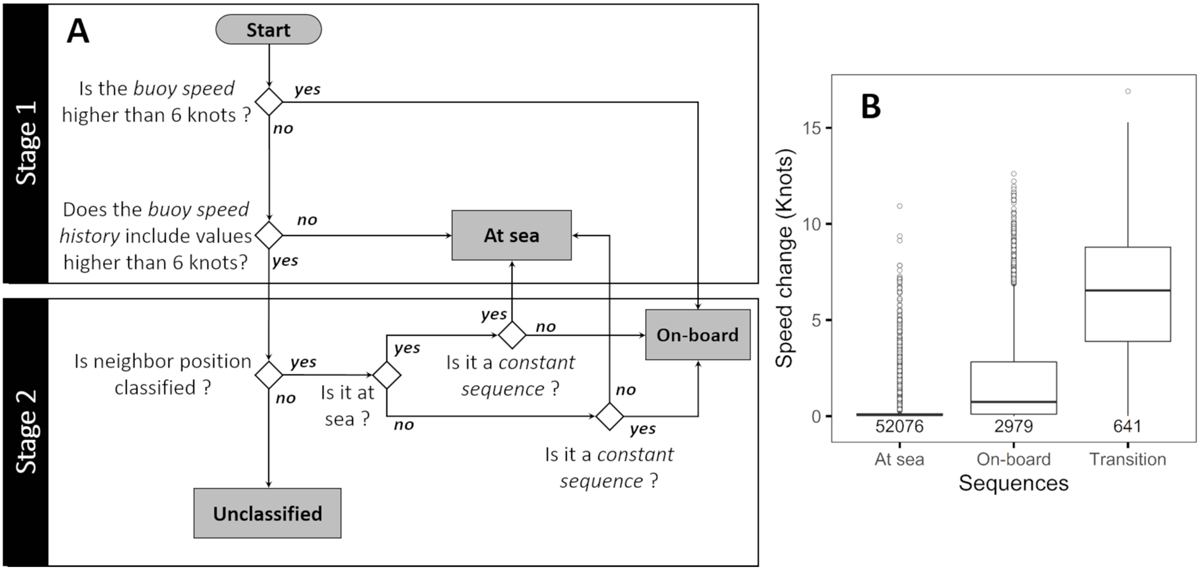
Description of the kinetic classification algorithm (KiC). (A) KiC flowchart: buoy speed history corresponds to speeds recorded 3 days prior to the buoy position. (B) Example illustrating speed changes in constant sequences (consecutive positions with the same predicted status: “on-board” − “on-board” or “at sea” − “at sea”), and transition sequences (consecutive positions with shift in status: “on-board” − “at sea”, “at sea” − “on-board”) from the D1 dataset in the Atlantic Ocean. Values represent the number of data in each sequences.
Current usage metrics show cumulative count of Article Views (full-text article views including HTML views, PDF and ePub downloads, according to the available data) and Abstracts Views on Vision4Press platform.
Data correspond to usage on the plateform after 2015. The current usage metrics is available 48-96 hours after online publication and is updated daily on week days.
Initial download of the metrics may take a while.