Fig. 4
Download original image
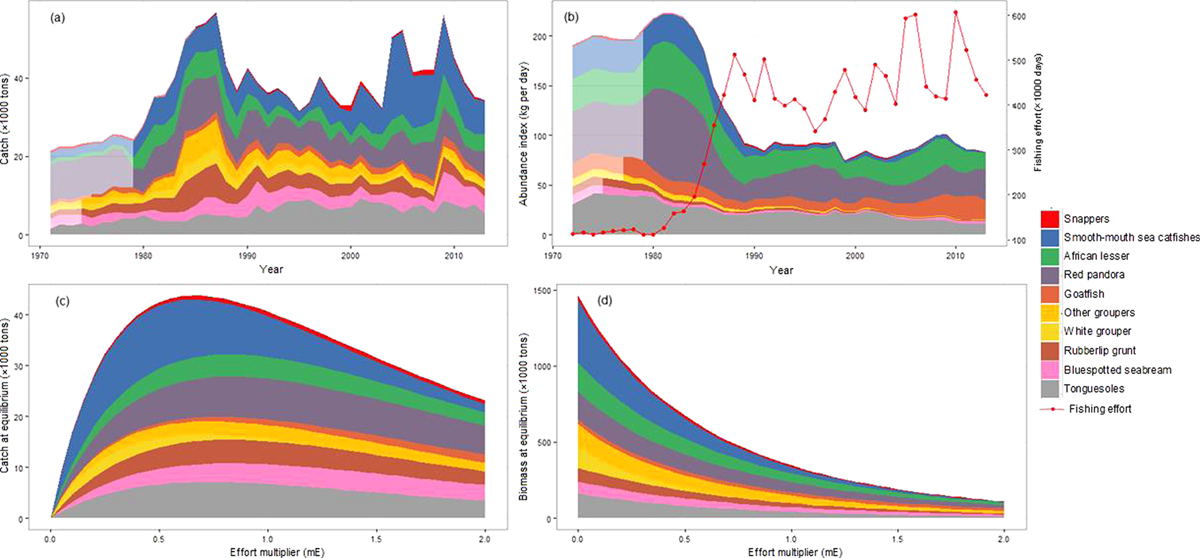
Cumulated stock assessment using Bayesian dynamic production model: (a) cumulative observed catches; (b) cumulative biomasses with the effort multiplier (red line and dots) on the 2nd y-axis; (c) production at equilibrium and (d) biomass at equilibrium. Note that some catches and abundance indices in (a) and (b) panels have been extrapolated (lighter shade of colors) for some taxa only for graphical representation. Models and analyses did not take into account these extrapolations.
Current usage metrics show cumulative count of Article Views (full-text article views including HTML views, PDF and ePub downloads, according to the available data) and Abstracts Views on Vision4Press platform.
Data correspond to usage on the plateform after 2015. The current usage metrics is available 48-96 hours after online publication and is updated daily on week days.
Initial download of the metrics may take a while.