| Issue |
Aquat. Living Resour.
Volume 33, 2020
|
|
|---|---|---|
| Article Number | 22 | |
| Number of page(s) | 9 | |
| DOI | https://doi.org/10.1051/alr/2020020 | |
| Published online | 08 December 2020 | |
Research Article
Density and temperature dependent growth of pikeperch (Sander lucioperca) in the Archipelago Sea
1
Ministry of Agriculture and Forestry, PO Box 30, FI-00023 Government, Helsinki, Finland
2
Natural Resources, Natural Resources Institute Finland (Luke), Latokartanonkaari 9, Helsinki, FI–00790, Finland
3
Department of Environmental Sciences, Ecosystems and Environment Research Programme, PO Box 65, FI-00014, University of Helsinki, Helsinki, Finland
* Corresponding author: This email address is being protected from spambots. You need JavaScript enabled to view it.
Handling Editor: Pierre Boudry
Received:
28
January
2020
Accepted:
24
October
2020
Abstract
In the Archipelago Sea, pikeperch (Sander lucioperca) is an important species in both commercial and recreational fisheries. Pikeperch is caught mainly with small mesh size gillnets, and annual fishing mortality is high. The possible effects of such fisheries, as well as temperature or density on pikeperch growth have not been studied earlier. The first hypothesis of this study was that the effect of temperature on growth is positive and that of density is negative. The second hypothesis was that size-selectivity of gillnets causes the fast-growing individuals to be caught at younger ages than the slow-growing ones. The results showed that temperature had a significant positive effect on growth, and this was greater than the negative effect of year-class density, which was also significant. The gillnet selectivity caused a difference of up to 60 mm in back-calculated lengths in the fully recruited age groups within the same year class, between pikeperch caught at age 6+ and age 9+. Thus, the Rosa Lee phenomenon caused by gillnet size-selectivity led to the removal of faster growing specimens from the population at younger ages. This can potentially cause underestimation of real growth, and thus, poor fishery management.
Key words: Density-dependence / management / fishing mortality / size-selective fishing / Baltic Sea
© EDP Sciences 2020
1 Introduction
Pikeperch (Sander lucioperca (L.)) is a valuable species both in commercial and recreational fisheries in the coastal waters of the Baltic Sea (Lehtonen et al., 1996; Saulamo and Thoresson, 2005; Heikinheimo et al., 2006). Pikeperch stocks have benefited from eutrophication and increased temperatures during the recent decades (Lappalainen et al., 2002; Ådjers et al., 2006; Heikinheimo et al., 2006). Indeed, the positive effects of temperature on year-class strengths and growth of pikeperch are perceivable (Lappalainen et al., 2009). Temperature is critical for young-of-the-year (Y-O-Y) pikeperch during the first summer, because juveniles must reach sizes that are large enough to enable them to survive the first winter (Lappalainen et al., 2000, 2005a). A negative relationship between growth, estimated as annual length increments, and year-class strength has been found in pikeperch in the eastern Gulf of Finland, suggesting density-dependent growth (Lappalainen et al., 2009). In general, density dependence commonly occurs early in life in large habitats such as the marine environment, but it may also occur late in life − especially if the habitable area is limited (Andersen et al., 2017; Zimmerman et al., 2018). As Lappalainen et al. (2009) discussed, the negative effects of density on growth are easily masked by the strong positive effects of temperature on growth (see also Lorenzen and Enberg, 2002). Therefore, the possible effects of temperature on growth should be considered.
Size-selective fishing gear, for example gillnets, typically remove the faster-growing individuals from the population at a higher rate than slower growing ones (Kraak et al., 2019); this process is known as the “Rosa Lee's phenomenon”. Such selective fishing can lead to a situation where the remaining population becomes dominated by slower-growing individuals with an apparent decreased mean growth rate (Kristiansen and Svåsand, 1998). If ignored, this phenomenon can lead to errors in assessing the dynamics and status of fish stocks, causing a substantial bias in management decisions (Kraak et al., 2019). Management strategies and decisions can be studied for instance with size- and age-based models, which take into account the size-selectivity of the estimated gear (e.g. Buijse et al., 1992; Machiels and Wijsman, 1996; Kraak et al., 2019).
In the Archipelago Sea, pikeperch is mostly fished with gillnets, which are strongly size-selective gear (Van Densen, 1987; Buijse et al., 1992). Such size-selectivity can often benefit fisheries management (Zimmermann and Jørgensen, 2017).Small mesh-size gillnets of ≤45 mm bar length are commonly used, but the minimum mesh-size regulations for gillnets only apply to some parts of the Archipelago Sea. The fishing pressure is high in the area, with instantaneous fishing mortality varying from about 1.0 to even 1.5 per year in fully recruited age groups of pikeperch (Heikinheimo et al., 2006, 2014). For example, 43 mm gillnets catch pikeperch that are between 35 and 47 cm (on average, pikeperch are around 40 cm) (Heikinheimo et al., 2006).The legal minimum landing size of pikeperch was 37 cm during the study period until the end of 2018, but is currently 40 cm (total length; TL) for commercial fishermen having an annual revenue over 10 000 euro, and 42 cm TL for others.
Earlier studies have revealed that the growth of pikeperch is slow in the Archipelago Sea compared with other coastal areas or lakes in Finland (Lehtonen, 1983, 1987; Heikinheimo et al., 2006; Vainikka et al., 2017). Kokkonen et al. (2015) concluded that the strong fishing mortality likely decreased the size and age at maturation of pikeperch in the Archipelago Sea. Even if earlier maturation is linked to slower growth, there was no indication of a shift to slower growth in pikeperch during the study period of 1980 to 2011. Instead, the condition factor had decreased. According to Kokkonen et al. (2015), the simultaneous increase in water temperature may have masked the effect of earlier maturation on growth.
In this study, we first estimated the effects of density and temperature on the annual length increments of each pikeperch based on back-calculated lengths. Based on earlier studies from the Baltic Sea (Lappalainen et al., 2009), we suggested that the effect of temperature on growth is positive and that of density is negative. In the Baltic Sea, pikeperch live near the coast within the archipelago areas (Lehtonen, 1983; Saulamo and Thoresson, 2005). As the year classes can be very strong in warm summers (Lehtonen, 1983; Lappalainen et al., 2009), density-dependence in growth can also be expected. Because pikeperch is mainly fished with gillnets, and the variation in individual growth rates of pikeperch is high (Heikinheimo et al., 2006), it was hypothesized that the size-selectivity of gillnets causes the fast-growing individuals to be caught at younger ages than the slow-growing ones. Therefore, the growth of pikeperch observed based on sampling could appear to be slow, when the actual growth based on their growth potential could be higher, as has been shown for example in perch (Perca fluvialitis) (Machiels and Wijsman, 1996) and cod (Gadus morhua) (Kristiansen and Svåsand, 1998).The effects of size-selectivity were analysed by separately comparing average back-calculated lengths of pikeperch caught at age i and later at age i + 3 years within the same year-class (Sinclair et al., 2002).
2 Materials and methods
2.1 Study area
The Archipelago Sea is a part of the Baltic Sea between the Gulf of Bothnia, the Gulf of Finland and the Sea of Åland. The Archipelago Sea has a mosaic structure, including some 30 500 islands and over 20 000 km shoreline (Bonsdorff et al., 1997). The average water depth in the Archipelago Sea is only 23 m, and the deepest trench reaches 146 m (Leppäkoski et al., 1999). The average salinity is 6–7‰ (Kullenberg, 1981), but is remarkably lower in areas close to river mouths. The duration of the ice season varies from 130 to 200 days in the Bothnian Bay (north of the Archipelago Sea), and from 80 to 100 days in the Gulf of Finland (east of the Archipelago Sea) (HELCOM, 2007). Water temperatures range from 0 to 20 °C, which can increase up to 25 °C at the surface (HELCOM, 2007).
2.2 Fish sampling
The data were based on annual samples from commercial gillnet and trap net catches in the Archipelago Sea during the years 1991–2014. The number of individuals in year-classes (hereafter referred to as the year-class size) was obtained from pikeperch stock assessment (VPA) from Heikinheimo et al. (2014), updated with data from 2014 (Fig. 1). The year-class size was estimated using annual fisheries catch data Official Statistics of Finland (OSF) and virtual population analysis VPA (Pope's cohort analysis, Hilborn and Walters, 1992) (Heikinheimo et al., 2014). In VPA, natural mortality (M) was assumed to be 0.1 in the age groups ≥6, 0.2 at ages 3–5, 0.3 at age 2, and 0.5 at age 1 (Heikinheimo et al., 2014). The natural mortality was assumed to remain constant over time in the studied years. See Heikinheimo et al. (2014) for a detailed description of the VPA. The research area covers ICES statistical squares of 49H1, 49H2, 50H1 in the Baltic Sea in Finland (Natural Resources Institute Finland, Luke); these samplings are partly connected to the EU Data Collection Framework.
Pikeperch samples were collected from commercial fishermen's catches by the Natural Resources Institute Finland. The total length and weight of the fish were measured, and scales were taken from the standard area of the abdomen −on the side of the fish below the frontal part of the posterior dorsal fin, below the lateral line. Age was determined from scales based on the annual rings. The radius of scales and the distances of the annuli were measured with a microfilm viewer from the polycarbonate impressions of scales. All the age determinations of pikeperch were done by the same person. The lengths at earlier ages were back-calculated on the basis of the distances of annual rings using Fraser and Lee's method (Bagenal and Tesch, 1978):
where Li is length at age i, Lc is the total length of the fish (mm), Si is the distance between the scale focus and annulus at age i, Sc is scale radius, and a is the intercept. For the intercept term a, 44 mm was used as the length of pikeperch at scale formation (Ruuhijärvi et al., 1996). The total number of analysed pikeperch was 24 375, of which 6 308 were caught with trap nets and 18 067 with gillnets.
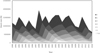 |
Fig. 1 Stock sizes (N) of age groups 1–10 of pikeperch by year based on the VPA. Age groups 7–10 have been combined. The year-classes appear as ridges and valleys. |
2.3 Growth based on length increments
In the Archipelago Sea, pikeperch is mainly fished with gillnets in commercial fisheries, but trap nets are also commonly used. However, because the differences between the mean length increments of the pikeperch caught with trap nets and gillnets were small (Fig. 2), the data were pooled in the following analysis.
A generalized linear model with log-normal errors and repeated measurements was used to study the effects of age, temperature and density on the annual length increments of pikeperch. The model was: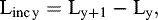

where Linc is the annual length increment (mm), T is the temperature (water temperature sum from the beginning of June to the end of September in year t), A is age j, and S is the number of individuals in the year-class y at age j.
In the model, an individual fish was treated as a subject, and back-calculated length increments were treated as repeated measurements, as recommended by Jones (2000). The model was fitted using a SAS macro NLINMIX, which follows the PROC NLIN and PROC MIXED procedures. For the covariance structure, the first-order autoregressive structure was used. Akaike's information criterion (AIC, Akaike, 1974) was used to compare the different models. AIC is estimated as 2k−2ln(L), where k is the number of independently adjusted parameters, and L is the maximum value of the likelihood function in the model. Thus, AIC measures the goodness of fit and penalises for adding parameters to the model.The modelling approach was similar to that described by Dorn (1992), but with the use of repeated measures. Lappalainen et al. (2005b; 2009) used a similar growth model for pikeperch in lakes and in the Gulf of Finland.
In the growth analyses, daily mean water temperatures (°C) from the first of June to the end of September were summed together. Daily water temperature measurements were obtained from the Finnish Environment Institute. Water temperature was measured at 1 m depth in Ruissalo Island between the years 1997–2008. The site is located in the south western coast of Finland, near the city of Turku. For the periods when daily water measurements were not available (1980–1996 and 2009–2013), a model by Kjellman et al. (2003) was used to estimate the daily water temperature based on air temperature (see Kjellman et al., 2003; Pekcan-Hekim et al., 2011 for a more detailed description of the model).
The year-class sizes of pikeperch varied substantially, and only the within-cohort density-dependent effects were estimated. In preliminary analyses, year-class sizes and temperature sums were log-transformed, because these gave smaller AIC-values when using log-transformed length increments. We also standardized these three variables to mean 0 and to standard deviation 1 to evaluate the effect sizes of each variable.
Only the main effects were analysed here based on preliminary analyses using variance inflation factor (vif) to estimate possible multicollinearity among the main effects and their interactions. Here, there are three possible two-way interactions: between temperature and age, between temperature and stock size, and between age and stock size. When the annual length increments were analysed with the interaction of temperature and age with the main effects of age, stock size and temperature sum, vif was 4.6 for temperature and 17 819 for age, suggesting strong multicollinearity. Similarly, when the interaction of temperature and stock size was analysed with the main effects, vif was 187 for temperature and 15 534 for stock size. In the model with interaction between age and stock size with the main effects, vif was 122.6 for age and 96.0 for the interaction. In the model with only the main effects, vif was 1.0 for temperature, 2.1 for stock size and for 2.1 for age, suggesting low multicollinearity. Therefore, only the main effects were studied here.
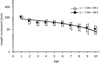 |
Fig. 2 Average back-calculated length increments (mm, ± 1 SD, log-scale) of pikeperch in relation to age, in gillnets (black squares) and in trap nets (open circles). The lines indicate linear regression between length increments and age. Markers are shifted (–0.1 years for gillnets and +0.1 for trap nets) for comparison. Note the log-scale of the y-axis. |
2.4 Size-selective mortality
The presence, direction and magnitude of size-selective mortality in pikeperch were analysed with the separate analyses of variances (ANOVA) for the mean back-calculated lengths for each pair of ages (Sinclair et al., 2002). The analyses tested for differences in length-at-age i between fish caught at age i and i + 3 in the same year-class y. Therefore, the comparison was always done between lengths at the same age within the same year-class. The null hypothesis was that in the absence of selection for growth, there should be no differences between back-calculated lengths for a given age regardless of the age at which pikeperch were caught within an individual cohort. It was presumed that a three year gap was enough to detect possible differences in length-at-age due to size-selective fishing with gillnets.
The model was:
where Li,t,y is the mean back-calculated length at age i of a fish caught in year t of year-class y, X is the age, and Y is the year-class. The age of capture was i for the younger age in the pair and i + 3 for the older age. Statistical analyses were performed with SPSS® (version 24) and SAS (version 9.4).
3 Results
3.1 Length increments
The evaluation of different models with only one of the main effects showed that age was the most important independent variable to describe the variation in log-transformed length increments based on AIC-values (Tab. 1). The next important variable was the year-class size, which performed better than temperature. In the two variable models, the best fit was found with age and temperature, while the three variable model gave the smallest AIC-values. In this model, the effects of age and year-class size were negative on the length increments of pikeperch, while the effect of temperature was positive (Tab. 2). Residuals showed no clear deviations, so the model 1 fitted quite well to the length increments (Fig. 3). In the same length increment model, in which all the three independent variables were standardized to mean 0 and to standard deviation 1, the biggest effect size was in age (−0.084), then temperature (0.036), and the lowest effect size was in density (−0.004). The first order autocorrelation between subsequent length increments was −0.014.
AICs from different models used to estimate length increments of pikeperch (log-transformed) based on age, temperature sum, and size of the year-class. The best fitting model with the smallest AICs was the model using all three variables. All models included intercepts, and temperature sum and year-class size were log-transformed. Total number of increment observations and individuals was 136 649 and 24 375, respectively.
The parameter values and test statistics for the effects of age (age in years 1–10), temperature sum (calculated based on daily mean water temperature (°C) from 1st of June to end of September in each year) and year-class size (number of pikeperch) on length increments of pikeperch. Temperature sums, year-class sizes and length increments were log-transformed.
 |
Fig. 3 Residuals from growth model in relation to predicted length increments (mm TL; log-transformed). |
3.2 Size-selective mortality
The comparisons of back-calculated lengths showed that the mean lengths were significantly larger at ages 3 up to 7 years than in individuals caught 3 years later within the same year-class (Tab. 3). On average, the difference was up to 60 mm in fully recruited age groups. These differences became smaller in the comparisons between older pikeperch, for example between 6 and 9 year-old or 7 and 10 year-old individuals (Tab. 3), because even these 6 or 7 year-old pikeperch have been subjected to selective fishing for several years.
Based on the back-calculated lengths, growth appears to stop at a length of 400 mm (Fig. 4). Nevertheless, if the mean annual length increments (Fig. 2) are summed up, for example at the age of 10, the average length of a pikeperch should be 490 mm, rather than 400 mm suggested by back-calculated lengths. This is clearly seen from Figure 5, which is a “graphical summary” of the results presented in Table 3. Following the high fishing pressure, the older age groups mainly consist of the slow growing individuals, leading to the impression of truncated growth in these age groups. This phenomenon is also seen in the trap net data, which shows that the increasing proportion of slow growers towards older age groups is not only due to selective gillnet fishing, but is actually present in the population.
ANOVA statistics and average differences in mean back-calculated lengths (mm) at age i between pikeperch caught at age i or i+3. R2 is the adjusted R squared; * significance P < 0.05; ** P < 0.01.
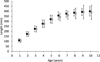 |
Fig. 4 Back-calculated lengths (± 1 SD) of pikeperch in gillnets (black squares) and in trap nets (open circles). Markers are shifted (–0.1 years for gillnets and +0.1 for trap nets) for comparison. |
 |
Fig. 5 Mean back-calculated lengths (mm) of pikeperch caught at different ages with trap nets (a) and gillnets (b). |
4 Discussion
4.1 Pikeperch growth
The results showed that the year-class size of pikeperch had a negative effect on annual length increments, while the effect of water temperature was positive. The negative effects of year-class size on annual length increments suggest density-dependency in pikeperch growth in the Archipelago Sea. Usually, density dependence is stronger in recruitment than in somatic growth, although it can be present in both (Zimmermann et al., 2018). For example, in the Baltic Sea, the selective fishing of cod led to density dependent growth (Svedäng and Hornborg, 2014). The authors suggested that this was related to lower mortality of intermediate sized cod, partly because of lower catchability when the size selectivity was increased, and partly because of lowered predation from larger sized cod as their numbers declined. Here, the observed growth patterns for pikeperch are similar to those found in some lakes (Lappalainen et al., 2005b) and in the eastern Gulf of Finland (Lappalainen et al., 2009). Similar to the study by Lappalainen et al. (2009), the year-class effect in the Archipelago Sea was weaker than the effect of temperature. Notably, the positive effects of temperature on growth only apply if the temperature is less than the optimum, and if food availability is sufficient(Morgan, 2018). Thus, extrapolating the effects of temperature beyond the observed temperature range can be misleading.
The different growth trajectory for the first year compared with the later years suggests that age-dependent sub-models might be worth considering for pikeperch. The same applies to density-dependence as well; age groups could be pooled to include different density-dependent mechanisms at different ages. Nevertheless, this is challenging due to the complex mechanisms of density-dependence (e.g. Rose et al., 2001), which could act both within and between age groups. For example, adults can compete with all adult age groups for food, whereas Y-O-Y compete for food within their own age groups but can also be subjected to cannibalism from the older age groups. This, in turn, can improve the growth of those individuals that survive from the predation, because it reduces the density of the year class and consequently lowers competition for food. In our model, the density-dependence was included only through the competition within the age group. This was arather strong simplification considering the above-mentioned processes, hence using a biologically more realistic model could theoretically lead to stronger density-dependence in growth.
4.2 Size-selective mortality and growth
High fishing effort and selective fishing have been shown to select for slower growth and earlier maturation (Kristiansen and Svåsand, 1998; Law, 2000; Heikinheimo et al., 2006). The difference in back-calculated lengths at the same ages between pikeperch caught three years apart was up to 60 mm in fully recruited age groups, indicating very strong size selection for pikeperch in the Archipelago Sea. Gillnets are the main gear used in fisheries, and since the fishing pressure is high, up to 80% of the catchable stock is removed annually (Heikinheimo et al., 2014). Thus, the individuals that first reach the size at which they are vulnerable to fishing will be largely removed from the population, while the proportion of slow growers correspondingly increases in the population (Heikinheimo et al., 2006). The slower an individual grows, the longer it will be able to escape from fishing (in the case where fishing is size-selective and the smaller individuals are not exploited), which favours the slow growth in evolutionary terms (Law, 2007). It can be argued that the slow growers are dominant in the older age groups in the Archipelago Sea.
The approach of protecting immature fish from fishing and instead targeting the larger ones has been the cornerstone in fisheries management and scientific advice for decades (Garcia et al., 2012). The theory behind this strategy is based on optimizing the yield per recruit function to maximize the yield in weight by searching for the optimal size/age of first capture and fishing mortality (Beverton and Holt, 1957). Protection of immature fish and implementing a policy where fish are allowed to spawn at least once has proven to minimize the risk of severe recruitment overfishing and stock collapses (Myers and Mertz, 1998). These targets, i.e. protecting smaller and younger fish, mean larger size at recruitment for fishing. This is typically done by using different minimum mesh size regulations and/or minimum size limits for caught fish. Recently, concerns over the impacts of this selective fishing on fisheries have increased (e.g. Law, 2000; Conover and Munch, 2002; Zhou et al., 2010; Laugen et al., 2014; Heino et al., 2015). Selectively removing larger and older fish favours life history traits related to slower growth, as well as earlier age and smaller size at maturity (Law, 2000; Conover and Munch, 2002; Ottersen et al., 2006).
Fisheries management should more strongly consider the evolutionary effects of fishing (Law and Grey, 1989; Conover and Munch, 2002; Jørgensen et al., 2007). This is important because parental size is correlated with larval performance in many fish species, including pikeperch, and larger individuals produce larger eggs and more viable offspring (Chambers and Leggett, 1996; Marteinsdottir and Steinarsson, 1998; Berkeley et al., 2004; Kamler, 2005; Olin et al., 2018). Using both minimum and maximum size limits have been offered as one solution to minimizing these effects. Vainikka et al. (2017) simulated the effect of such management strategy for inland pikeperch populations. For heavily exploited populations, this strategy was not effective enough to ensure the stability of yields and minimal evolutionary effect. Their results suggested that fishing mortality rates should be restricted to relatively low levels to minimize the risks of the undesirable evolutionary effects of fishing. In the Archipelago Sea, the current fishing pressure is high enough to generate a similar result. The main issue in the area is the excessive fishing, which imposes strong selection for earlier maturation. (Law and Grey, 1989; De Roos et al., 2006; Andersen et al., 2007; Jørgensen et al., 2007). Distributing harvesting with moderate mortality across the species, stocks, and sizes in an ecosystem in proportion to their natural productivity is recommended to more effectively prevent the adverse ecological effects of fishing, while simultaneously supporting sustainable fisheries (Garcia et al., 2012). Such approach would improve the sustainability of pikeperch fisheries in the Archipelago Sea.
The survival of pikeperch Y-O-Y during their first winter is strongly size selective, i.e. the first year of life selects for fast growth, because those individuals that grow fast enough during their first summer are more likely to survive over their first winter (Lappalainen et al., 2000, 2005a). Such mortality can be expected to counteract the selective effects of fishing (Vainikka and Hyvärinen, 2012). This raises the question: could this selection for fast growth in the young of the year act as a buffer for selection for slow growth later in life, or is the fishery-induced selection for slow growth heritable to a degree that is strong enough to threaten the growth potential of the Y-O-Ys? If so, the excessive selective fishing could cause a serious threat to reproduction in the long term. This should be studied in more detail in the future.
The commercial catch samples may not give the true impression of pikeperch growth in the Archipelago Sea.Notably, there is large individual variation in growth rates.Nevertheless, the fast-growing pikeperch will largely be removed from the population as soon as they reach the allowed catchable size. In older age groups, the length-at-age data is biased towards slow growth, and these data should not be used directly for example in Y/R-analyses. The situation is similar to that described by Kristiansen and Svåsand (1998) for cod. In order to avoid such problems, length-based modelling was recommended by Kraak et al. (2019). There are different possibilities to estimate the true growth potential of the older age groups of pikeperch. First, there is large individual variation in pikeperch growth rates, and the growth potential can be simulated by extrapolating the growth estimates of young age groups based on trap net samples. Secondly, observed length differences due to gillnet selectivity can be used to estimate more realistic growth also for the older agegroups of pikeperch.
To conclude, the effect of temperature was positive on growth while that of density was negative, similar to what has been found in other pikeperch populations in the northern Baltic Sea. However, because of size-selective fishing, the growth suggested by the data is probably not providing an accurate picture of the real growth potential in the Archipelago Sea. Thus, the assessment of the population production should be based on the true growth potential, where the effect of size selection by gillnets on growth has been excluded. We strongly encourage further studies on the growth and interaction between the fisheries and population dynamics of pikeperch in the Baltic coastal areas.
References
- Ådjers K, Appelberg M, Eschbaum R, Lappalainen A, Minde A, Repecka R, Thoresson G. 2006. Trends in coastal fish stocks of the Baltic Sea. Boreal Env Res 11: 13–25. [Google Scholar]
- Akaike H. 1974. A new look at the statistical model identification. IEEE Trans Automat Contr 19: 716–723. [CrossRef] [Google Scholar]
- Andersen KH, Farnsworth KD, Thygesen UH, Beyer JE. 2007. The evolutionary pressure from fishing on size at maturation of Baltic cod. Ecol Modell 204: 246–252. [CrossRef] [Google Scholar]
- Andersen KH, Jacobsen NS, Jansen T, Beyer JE. 2017. When in life does density dependence occur in fish populations? Fish Fish 18: 656–667. [CrossRef] [Google Scholar]
- Bagenal TB, Tesch FW. Age and growth, in: Bagenal T. (Ed.), Methods for Assessment of Fish Production in Fresh Waters. Blackwell, Oxford, 1978, pp. 101– 136. [Google Scholar]
- Berkeley SA, Chapman C, Sogard SM. 2004. Maternal age as a determinant of larval growth and survival in a marine fish, Sebastes melanops . Ecology 85: 1258–1264. [CrossRef] [Google Scholar]
- Beverton RJH, Holt SJ. 1957. On the dynamics of exploited fish populations. Ministery of Agriculture and Fisheries. Fish Investigat 19: 533 p. [Google Scholar]
- Bonsdorff E, Blomqvist EM, Mattila J, Norkko A. 1997. Long-term changes and coastal eutrophication: Examples from the Åland Islands and the Archipelago Sea, northern Baltic Sea. Oceanol Acta 20: 319–329. [Google Scholar]
- Buijse AD, Pet JS, van Densen WL, Machiels MA, Rabbinge R. 1992. A size-and age-structured simulation model for evaluating management strategies in a multispecies gill net fishery. Fish Res 13: 95–117. [CrossRef] [Google Scholar]
- Chambers RC, Leggett WC. 1996. Maternal influences on variation in egg sizes in temperate marine fishes. Am Zool 36: 180–196. [CrossRef] [Google Scholar]
- Conover DO, Munch SB. 2002. Sustaining fisheries yields over evolutionary time scales. Science 297: 94–96. [CrossRef] [PubMed] [Google Scholar]
- De Roos AM, Boukal DS, Persson L. 2006. Evolutionary regime shifts in age and size at maturation of exploited fish stocks. Proc Royal Soc London B: Biol Sci 273: 1873–1880. [Google Scholar]
- Dorn MW. 1992. Detecting environmental covariates of Pacific whiting Merluccius productus growth using a growth-increment regression model. Fish Bull 90: 260–275. [Google Scholar]
- Garcia S, Kolding MJ, Rice J, Rochet M-J, Zhou S, Arimoto T, Beyer JE, Borges L, Bundy A, Dunn D, Fulton EA, Hall M, Heino M, Law R, Makino M, Rijnsdorp AD, Simard F, Smith ADM. 2012. Reconsidering the consequences of selective fisheries. Science 335: 1045–1047. [CrossRef] [PubMed] [Google Scholar]
- Heikinheimo O, Pekcan-Hekim Z, Raitaniemi J. 2014. Spawning stock–recruitment relationship in pikeperch Sander lucioperca (L.) in the Baltic Sea, with temperature as an environmental effect. Fish Res 155: 1–9. [CrossRef] [Google Scholar]
- Heikinheimo O, Setälä J, Saarni K, Raitaniemi J. 2006. Impacts of mesh-size regulation of gillnets on the pikeperch fisheries in the Archipelago Sea, Finland. Fish Res 77: 192–199. [CrossRef] [Google Scholar]
- Heino M, Pauli BD, Dieckmann U. 2015. Fisheries-induced evolution. Annu Rev Ecol Evol Syst 46: 461–480. [CrossRef] [Google Scholar]
- HELCOM. 2007. Climate change in the Baltic Sea Area. HELCOM Thematic Assessment 2007. Baltic Sea Environmental Proceedings No. 111. [Google Scholar]
- Hilborn R, Walters CJ. 1992. Quantitative Fisheries Stock Assessment: choice, Dynamics and Uncertainty. Chapman and Hall, New York, 570 p. [Google Scholar]
- Jones CM. 2000. Fitting growth curves to retrospective size-at-age data. Fish Res 46: 123–129. [CrossRef] [Google Scholar]
- Jørgensen C, Enberg K, Dunlop ES, Arlinghaus R, Boukal DS, Brander K, Ernande B, Gårdmark A, Johnston F, Matsumura S, Pardoe H, Raab K, Silva A, Vainikka A, Dieckmann U, Heino M, Rijnsdorp AD. 2007. Managing evolving fish stocks. Science 318: 1247–1248. [CrossRef] [PubMed] [Google Scholar]
- Kamler E. 2005. Parent–egg–progeny relationships in teleost fishes: an energetics perspective. Rev Fish Biol Fish 15: 399–421. [CrossRef] [Google Scholar]
- Kjellman J, Lappalainen J, Urho L, Hudd R. 2003. Early determination of perch and pikeperch recruitment in the northern Baltic Sea. Hydrobiologia 495: 181–191. [CrossRef] [Google Scholar]
- Kokkonen E, Vainikka A, Heikinheimo O. 2015. Probabilistic maturation reaction norm trends reveal decreased size and age at maturation in an intensively harvested stock of pikeperch Sander lucioperca . Fish Res 167: 1–12. [CrossRef] [Google Scholar]
- Kullenberg G. Physical oceanography, in Voipio A. (ed.), The Baltic Sea. Elsevier Oceanography series No. 30. Elsevier Scientific Publishing Company, Amsterdam, 1981, pp. 135–181. [Google Scholar]
- Kraak SB, Haase S, Minto C, Santos, J. 2019. The Rosa Lee phenomenon and its consequences for fisheries advice on changes in fishing mortality or gear selectivity. ICES J Mar Sci 76: 2179–2192. [CrossRef] [Google Scholar]
- Kristiansen TS, Svåsand, T. 1998. Effect of size selective mortality on growth of coastal cod illustrated by tagging data and an individual based growth and mortality model. J Fish Biol 52: 688–705. [CrossRef] [Google Scholar]
- Lappalainen A, Söderkultalahti P, Wiik T. 2002. Changes in the commercial fishery for pikeperch (Stizostedion lucioperca) on the Finnish coast from 1980 to 1999–Consequences of environmental and economic factors. Arch Fish Mar Res 49: 199–212. [Google Scholar]
- Lappalainen J, Erm V, Kjellman J, Lehtonen H. 2000. Size-dependent winter mortality of age-0 pikeperch (Stizostedion lucioperca) in Pärnu Bay, the Baltic Sea. Can J Fish Aquat Sci 57: 451–458. [CrossRef] [Google Scholar]
- Lappalainen J, Malinen T, Rahikainen M, Vinni M, Nyberg K, Ruuhijärvi J, Salminen M. 2005b. Temperature dependent growth and yields of pikeperch in Finnish lakes. Fish Manage Ecol 12: 27–35. [CrossRef] [Google Scholar]
- Lappalainen J, Milardi M, Nyberg K, Venäläinen A. 2009. Effects of water temperature on year-class strengths and growth patterns of pikeperch (Sander lucioperca (L.)) in the brackish Baltic Sea. Aquat Ecol 43: 181–191. [CrossRef] [Google Scholar]
- Lappalainen J, Vinni M, Kjellman J. 2005a. Diet, condition and mortality of pikeperch (Sander lucioperca) during their first winter; Lake Hiidenvesi − studies on a clay-turbid and eutrophic multi-basin lake. Adv Limnol 59: 207–217. [Google Scholar]
- Laugen AT, Engelhard GH, Whitlock R, Arlinghaus R, Dankel DJ, Dunlop ES, Eikeset AM, Enberg K, Jørgensen C, Matsumura S, Nusslé S, Urbach D, Baulier L, Boukal DS, Ernande B, Johnston FD, Mollet F, Pardoe H, Therkildsen NO, Uusi-Heikkilä S, Vainikka A, Heino M, Rijnsdorp AD, Dieckmann U. 2014. Evolutionary impact assessment: accounting for evolutionary consequences of fishing in an ecosystem approach to fisheries management. Fish Fish 15: 65–96. [CrossRef] [Google Scholar]
- Law R. 2000. Fishing, selection, and phenotypic evolution. ICES J Mar Sci 57: 659–668. [Google Scholar]
- Law R. 2007. Fisheries-induced evolution: present status and future directions. Mar Ecol Progr Ser 335: 271–278. [CrossRef] [Google Scholar]
- Law R, Grey DR. 1989. Evolution of yields from populations with age-specific cropping. Evol Ecol 3:343–359. [CrossRef] [Google Scholar]
- Lehtonen H. 1983. Stocks of pike-perch (Stizostedion lucioperca L.) and their management in the Archipelago Sea and the Gulf of Finland. Finn Fish Res 5: 1–16. [Google Scholar]
- Lehtonen H. 1987. Selection of minimum size limit for pike-perch (Stizostedion lucioperca) in the coastal waters of Finland. Proc V Congr Europ Ichthyol, Stockholm , 351–355. [Google Scholar]
- Lehtonen H, Hansson S, Winkler H. 1996. Biology and exploitation of pikeperch Stizostedion lucioperca (L.), in the Baltic Sea area. Ann Zool Fenn 33: 525–535. [Google Scholar]
- Leppäkoski E, Helminen H, Hänninen J, Tallqvist M. 1999. Aquatic biodiversity under anthropogenic stress: an insight from the Archipelago Sea (SW Finland). Biodiv Conserv 8:55–70. [CrossRef] [Google Scholar]
- Lorenzen K, Enberg, K. 2002. Density-dependent growth as a key mechanism in the regulation of fish populations: evidence from among-population comparisons. Proc Royal Soc Lond B: Biological Sciences 269: 49–54. [CrossRef] [Google Scholar]
- Machiels MA, Wijsman J. 1996. Size-selective mortality in an exploited perch population and the reconstruction of potential growth. Ann Zool Fenn 33: 397–401. [Google Scholar]
- Marteinsdottir G, Steinarsson A. 1998. Maternal influence on the size and viability of cod (Gadus morhua L.) eggs and larvae. J Fish Biol 52: 1241–1258. [Google Scholar]
- Morgan MJ. 2018. Understanding biology to improve advice for fisheries management. ICES J Mar Sci 75: 923–931. [CrossRef] [Google Scholar]
- Myers RA, Mertz G. 1998. The limits of exploitation: a precautionary approach. Ecol Appl 8 (sp 1): S165–S169. [CrossRef] [Google Scholar]
- Official Statistics of Finland (OSF): Commercial Marine Fishery [e-publication]. Helsinki: Natural Resources Institute Finland. http://www.stat.fi/til/akmer/index_en.html [Google Scholar]
- Ottersen G, Hjermann DØ, Stenseth NC. 2006. Changes in spawning stock structure strengthen the link between climate and recruitment in a heavily fished cod (Gadus morhua) stock. Fish Oceanogr 15: 230–243. [CrossRef] [Google Scholar]
- Olin M, Vainikka A, Roikonen T, Ruuhijärvi J, Huuskonen H, Kotakorpi M, Vesala S, Ala-Opas P, Tiainen J, Nurminen L, Lehtonen H. 2018. Trait related variation in the reproductive characteristics of female pikeperch (Sander lucioperca). Fish Manage Ecol 25: 220–232. [CrossRef] [Google Scholar]
- Pekcan-Hekim Z, Urho L, Auvinen H, Heikinheimo O, Lappalainen J, Raitaniemi J, Söderkultalahti P. 2011. Climate warming and pikeperch year-class catches in the Northern Baltic Sea. Ambio 40: 447–456. [CrossRef] [Google Scholar]
- Rose KA, Cowan JH, Jr, Winemiller KO, Myers RA, Hilborn R. 2001. Compensatory density dependence in fish populations: importance, controversy, understanding and prognosis. Fish Fish 2: 293–327. [CrossRef] [Google Scholar]
- Ruuhijärvi J, Salminen M, Nurmio T. 1996. Releases of pikeperch (Stizostedion lucioperca (L.)) fingerlings in lakes with no established pikeperch stock. Ann Zool Fenn 33: 553–567. [Google Scholar]
- Saulamo K, Thoresson G. 2005. Management of pike-perch migrating over management areas in a Baltic archipelago Area. Ambio 34: 118–122. [CrossRef] [PubMed] [Google Scholar]
- Sinclair AF, Swain DP, Hanson JM. 2002. Measuring changes in the direction and magnitude of size-selective mortality in a commercial fish population. Can J Fish Aquat Sci 59: 361–371. [CrossRef] [Google Scholar]
- Svedäng H, Hornborg S. 2014. Selective fishing induces density-dependent growth. Nat Commun 5: 1–6. [CrossRef] [Google Scholar]
- Vainikka A, Hyvärinen P. 2012. Ecologically and evolutionarily sustainable fishing of the pikeperch Sander lucioperca: Lake Oulujärvi as an example. Fish Res 113: 8–20. [CrossRef] [Google Scholar]
- Vainikka A, Olin M, Ruuhijärvi J, Huuskonen H, Eronen R, Hyvärinen P. 2017. Model-based evaluation of the management of pikeperch (Sander lucioperca) stocks using minimum and maximum size limits. Boreal Env Res 22: 187–212. [Google Scholar]
- Van Densen WLT. 1987. Gillnet selectivity to pikeperch, Stizostedion lucioperca (L.), and perch, Perca fluviatilis L., caught mainly wedged. Aquacult Fish Manag 18: 95–106. [Google Scholar]
- Zhou S, Smith AD, Punt AE, Richardson AJ, Gibbs M, Fulton EA, Pascoe S, Bulman C, Bayliss P, Sainsbury K. 2010. Ecosystem-based fisheries management requires a change to the selective fishing philosophy. Proc Nat Acad Sci 107: 9485–9489. [CrossRef] [Google Scholar]
- Zimmermann F, Jørgensen C. 2017. Taking animal breeding into the wild: regulation of fishing gear can make fish stocks evolve higher productivity. Mar Ecol Progr Ser 563: 185–195. [CrossRef] [Google Scholar]
- Zimmermann F, Ricard D, Heino M. 2018. Density regulation in Northeast Atlantic fish populations: density dependence is stronger in recruitment than in somatic growth. J Anim Ecol 87: 672–681. [CrossRef] [PubMed] [Google Scholar]
Cite this article as: Saulamo K, Heikinheimo O, Lappalainen J. 2020. Density and temperature dependent growth of pikeperch (Sander lucioperca) in the Archipelago Sea. Aquat. Living Resour. 33: 22
All Tables
AICs from different models used to estimate length increments of pikeperch (log-transformed) based on age, temperature sum, and size of the year-class. The best fitting model with the smallest AICs was the model using all three variables. All models included intercepts, and temperature sum and year-class size were log-transformed. Total number of increment observations and individuals was 136 649 and 24 375, respectively.
The parameter values and test statistics for the effects of age (age in years 1–10), temperature sum (calculated based on daily mean water temperature (°C) from 1st of June to end of September in each year) and year-class size (number of pikeperch) on length increments of pikeperch. Temperature sums, year-class sizes and length increments were log-transformed.
ANOVA statistics and average differences in mean back-calculated lengths (mm) at age i between pikeperch caught at age i or i+3. R2 is the adjusted R squared; * significance P < 0.05; ** P < 0.01.
All Figures
|
Fig. 1 Stock sizes (N) of age groups 1–10 of pikeperch by year based on the VPA. Age groups 7–10 have been combined. The year-classes appear as ridges and valleys. |
| In the text | |
|
Fig. 2 Average back-calculated length increments (mm, ± 1 SD, log-scale) of pikeperch in relation to age, in gillnets (black squares) and in trap nets (open circles). The lines indicate linear regression between length increments and age. Markers are shifted (–0.1 years for gillnets and +0.1 for trap nets) for comparison. Note the log-scale of the y-axis. |
| In the text | |
|
Fig. 3 Residuals from growth model in relation to predicted length increments (mm TL; log-transformed). |
| In the text | |
|
Fig. 4 Back-calculated lengths (± 1 SD) of pikeperch in gillnets (black squares) and in trap nets (open circles). Markers are shifted (–0.1 years for gillnets and +0.1 for trap nets) for comparison. |
| In the text | |
|
Fig. 5 Mean back-calculated lengths (mm) of pikeperch caught at different ages with trap nets (a) and gillnets (b). |
| In the text | |
Current usage metrics show cumulative count of Article Views (full-text article views including HTML views, PDF and ePub downloads, according to the available data) and Abstracts Views on Vision4Press platform.
Data correspond to usage on the plateform after 2015. The current usage metrics is available 48-96 hours after online publication and is updated daily on week days.
Initial download of the metrics may take a while.