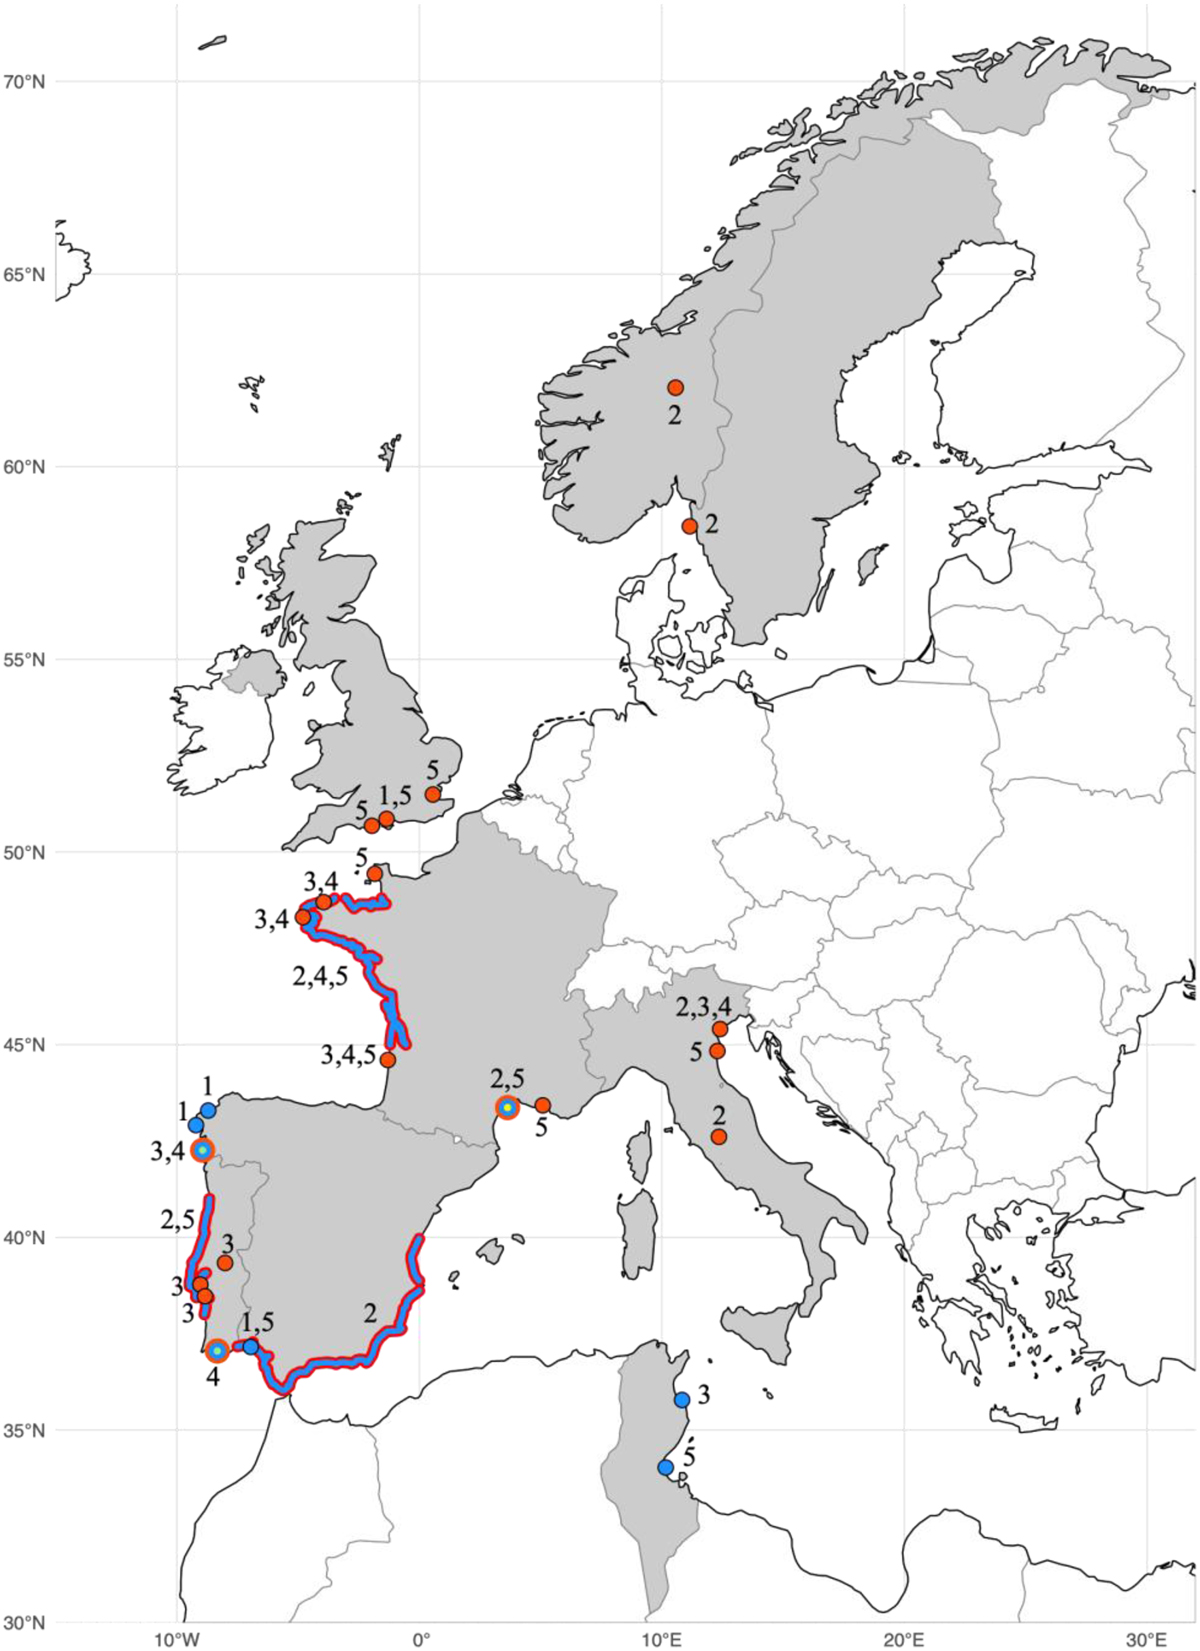
Fig. 1
Download original image
The SYMPA map highlighting in grey the European countries and a North African country represented at the symposium. Coloured dots and lines indicate scientific projects targeting Ruditapes philippinarum (red), R. decussatus (blue), Venerupis corrugata (green), and Polititapes aureus (yellow), either at specific locations (dots) or along broader coastal areas (lines). The numbers above the dot or line refer to the thematic sessions in which the corresponding research was presented. When dots are positioned centrally within a country, they denote projects conducted at a national or fisheries level, without direct field sampling at specific coastal sites.
Current usage metrics show cumulative count of Article Views (full-text article views including HTML views, PDF and ePub downloads, according to the available data) and Abstracts Views on Vision4Press platform.
Data correspond to usage on the plateform after 2015. The current usage metrics is available 48-96 hours after online publication and is updated daily on week days.
Initial download of the metrics may take a while.