| Issue |
Aquat. Living Resour.
Volume 33, 2020
|
|
|---|---|---|
| Article Number | 14 | |
| Number of page(s) | 10 | |
| DOI | https://doi.org/10.1051/alr/2020016 | |
| Published online | 21 October 2020 | |
Research Article
Production of asari (Manila) clams, Ruditapes philippinarum, during the period of harvest decrease in the 2000s in the Banzu tidal area, Tokyo Bay
1
Tokyo Bay Laboratory, Chiba Prefectural Fisheries Research Center, 3091 Kokubo, Futtsu, 293–0042 Chiba, Japan
2
Chiba Federation of Fisheries Cooperative Associations, 2–3–8 Shinjuku, Chuo, 260–0021 Chiba, Japan
* Corresponding author: This email address is being protected from spambots. You need JavaScript enabled to view it.
a Present address: Tokyo University of Marine Science and Technology, 4–5–7 Konan, Minato, 108–8477 Tokyo, Japan.
b Tokyo Kyuei Co. Ltd., 6906–10 Shiba, Kawaguchi, 333–0866 Saitama, Japan.
c Permanent address: 5–1 Takasu, Urayasu, 279–0023 Chiba, Japan.
Handling Editor: Pauline Kamermans
Received:
12
May
2020
Accepted:
2
October
2020
Abstract
In Tokyo Bay, the harvestable quantity of asari (Manila) clams Ruditapes philippinarum has been decreasing since the late 1990s. We conducted a field investigation on clam density in the Banzu culture area from April 1988 to December 2014 and collected records spanning January 1986 to September 2017 from relevant fisheries cooperative associations to clarify the relationship between the temporal variation in stock abundance and the production activities of fishermen. The yearly variation in clam abundance over the study period was marked by larger decreases in the numbers of larger clams. A large quantity of juvenile clams, beyond the biological productivity of the culture area, may have been introduced as seed stock in the late 1980s despite the high level of harvestable stock. The declines in harvested quantity began in the late 1990s and may have been caused by decreases in harvestable stock despite the continuous addition of seed stock clams. The harvested quantity is likely to be significantly dependent upon the wild clam population, even within the culture area, as the harvestable quantity was not correlated with the quantity of seed stock introduced during the study period. These declines in harvested quantity may have resulted from a decreasing number of operating harvesters due to the low level of harvestable stock and consequently reduced profitability. Two findings were emphasized. A certain management style, based on predictions of the contributions of wild and introduced clams to future stock biomass, is essential for economically-feasible culturing. In areas with less harvestable stock, actions should be taken to maintain the incomes of harvesters while avoiding overexploitation, even if the total harvest quantity decreases.
Key words: Ruditapes philippinarum / seeding / stock decrease / Tokyo Bay
© EDP Sciences 2020
1 Introduction
The asari (Manila) clam (Ruditapes philippinarum) is a bivalve native to the western coast of the temperate Pacific, including the Primorsky Krai, Korean Peninsula, China, and Japan (Ponurovsky and Yakovlev, 1992). The species was unintentionally introduced to the Pacific coast of North America via oyster seeds in the 1930s (Chew, 1989) and was then intentionally introduced to the Atlantic and Mediterranean coasts of Europe for aquaculture (Goulletquer, 1997). The asari clam has become naturalized in many of these introduced areas and has developed into an economically important bivalve species for local fisheries and aquaculture (Chew, 1989; Pellizzato and Da Ros, 2005; Juanes et al., 2012; de Montaudouin et al., 2016; Moura et al., 2017).
Culture production using seed clams (artificially reared or natural juvenile clams introduced from outside of the culture area to enhance clam stocks) is performed widely in areas of the native (Chung et al., 2001; Toba, 2004; Kamohara et al., 2014; Fang and Lin, 2016) and non-native ranges in which a commercially exploitable stock is established (Cigarrı́a and Fernández, 2000; Campos and Cachola, 2005; Becker et al., 2008; Juanes et al., 2012; Robert et al., 2013; Humphreys et al., 2015; Bartoli et al., 2016; de Montaudouin et al., 2016; Ponti et al., 2017; Suhrbier et al., 2017).
The production of asari clams has fluctuated and decreased recently in both the clam's native and exotic ranges (FAO, 2018a, b). Factors suspected to be responsible for these decreases in clam stock include overexploitation (Ren et al., 2008; Hamaguchi, 2011; Brusà et al., 2013), bacterial and parasitic diseases (Paillard et al., 1994; Park et al., 1999; Kobayashi and Toba, 2014), predation (Chew, 1989; Toba et al., 2020), hydrodynamic erosion of benthic clams (Toba et al., 2016; Tezuka et al., 2012), and anthropogenic deterioration of habitats (Bartoli et al., 2016).
Previous studies on this decrease in asari clam production have mainly focused on the variation in stock abundance and the ecological and environmental processes involved (Bartoli et al., 2001; Park and Choi, 2001; Tsutsumi, 2005; Tamaki et al., 2007; Tezuka et al., 2012; Toba et al., 2020). Generally, clam production depends on the abundance of stock biomass and the pressure from harvesting efforts (Mizuno et al., 2009; Sladonja et al., 2011; Tezuka et al., 2012). In culture production areas that depend on seed clams in addition to wild clams occurred in the culture area, the management of seed introduction (size and quantity of seed clams, and season of introduction) and harvesting effort may significantly influence production. Some studies have highlighted the importance of managing and monitoring fishing activity (Pellizzato and Da Ros, 2005; Canu et al., 2011; Ponti et al., 2017; Clarke et al., 2019), which aim to establish ecologically and economically feasible fisheries/culture production areas for asari clams. However, few studies have focused on the relationships among clam stocks, seed stock introduction, and harvesting effort in asari clam culture areas using long-term data on real-world culturing activities.
In Tokyo Bay, the annual production of asari clams was 5000–7000 metric tonnes (mt) from the late 1980s to the 1990s (Toba et al., 2016). Production began to decrease in the late 1990s (<2000 mt in 2007), and an additional sharp decline caused by sea spider infestation (Tomiyama et al., 2016; Yamada et al., 2018) lowered production to <200 mt after 2008. In Banzu, which is one of the major asari clam production areas in Tokyo Bay, culture production using seed clams has been implemented since at least the late 1970s (Toba, 2017).
The objective of the present study was to clarify the relationships among temporal variation in stock abundance, seed introduction, and harvesting in the asari clam culture area of Tokyo Bay. In order to analyze clam production in Banzu, we investigated the spatial density of asari clams in pre-determined sites, and documents describing culture practices from the 1980s to the 2010s were collected from the relevant FCAs. The present study provides information on the actual structure and production activities of asari clam culture areas within the native range. The influence of variation in clam stock and culture practices on the harvestable quantity is discussed, and the findings have the potential to be used in the management of asari clam culture areas.
2 Materials and methods
2.1 Study area
The study area was Banzu, which is on the east coast of Tokyo Bay (35°23ʹ–28ʹ N, 139°53ʹ–57ʹ E) (Fig. 1). Banzu is a tidal area (12 × 1.0–1.5 km) that includes the Obitsu river estuary. The bottom height of the tidal area extends to ±0 to +1.8 m (mean low water level in spring tide = ±0 m), and tidal amplitude ranges between 1.8 and 0.6 m in spring and neap tide, respectively. The surface substrate of the tidal area consists of fine-coarse sand containing <5% of silt and clay. Annual water temperature and salinity vary at 8–27 °C and 20–30 psu, respectively (Chiba Prefectural Fisheries Research Center, 2019).
In Banzu, six FCAs use tidal and shallow areas for clam harvest under authorized licenses (Fig. 1). Licensed areas are divided spatially and assigned individually to each FCA. The areas are separated into fishery (1097 ha), culture (345), and leisure harvesting (232) areas. In the culture areas, clams originated from introduced seed are harvested together with wild clams.
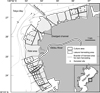 |
Fig. 1 Map of the Banzu tidal area. The licensed areas are spatially divided into three areas: culture area, where clams are restocked with transplanted seed clams; leisure harvested area, which are open seasonally to non-professional fisherman that pay a harvest charge; fishery area (the rest of the area), for harvest of wild clams. Spatial density of the clams was monitored in 51 sites (filled circle) in the culture area in 1988–2014. Numerals on the chart indicate water depth (m) during the mean low water level of the spring tide. |
2.2 Investigation of clam abundance
To obtain the temporal variation of clam density in the culture area, quantitative sampling of clams was conducted at 51 sites bimonthly (in even number months) from April 1988 to December 2014 (Fig. 1). Clams were collected using harvesting gear, short-handled basket rake (50 cm width of mouth, 2 mm × 2 mm mesh screen). By dredging this gear for >2 m on the bottom surface, clams were collected at a sand depth of ca. 10 cm. Sample collection was performed once per station per sampling event. All collected material, including clams, were weighed, and 1-kg portions were subsampled to enumerate clams. The entire collected material was used as a subsample when its total weight was ≤1.0 kg. The clams in the subsampled material were separated into seven groups according to size. For this, sieves with mesh sizes of 2.0, 3.6, 5.0, 10.0, 14.0, 18.0, and 21.0 mm, which retained clams with shell length larger than approximately 4, 7, 11, 16, 23, 27, and 30 mm, respectively, were used. Hereafter, the seven size groups of clams are referred to as D1–D7.
The number of size-separated clams were counted, then the spatial density of the clams (Di, ind. m−2) in D1–D7 was calculated using equation (1): (1)where Ni is the number of clams retained by the sieve, T is the total weight of retained material, S is the weight of the subsampled material, W is the mouth width of the collection gear (=50 cm), and L is the dredged distance of the gear.
2.3 Collection of records in the clam culture operation
Monthly data for the weight quantities of harvested and seeded clams (hereafter, weight of quantity is referred simply as quantity), the value of seeded clams, and the number of fishermen working in the culture areas from January 1986 to September 2017 were obtained from operation records in six FCAs. The number of operating fishermen was recorded from 1992 on. All records from 2004 were excluded from the analysis because of a major lack of data.
2.4 Size of harvested and seeded clams
As determined by the Committee of Fisheries Regulation in Chiba Prefecture, the minimum harvestable size of asari clams is 28 mm in shell length. The FCAs further determined a minimum harvestable size of >30–35 mm, which changed throughout the years (e.g. from >35 mm to >30 mm during the study period; interview with FCA). Additionally, the shell length of the seeded clams increased from 20–25 mm to >25 mm during these decades (the same as above).
In the present study, therefore, we determined the size of the harvestable and seeded clams as >27 mm (D6–D7) and 23–30 mm (D5–D6), respectively. With this, D6 included both sizes of harvestable and seeded clams, whereas D1–D4 (<23 mm) consisted of wild clams occurring in the culture area.
2.5 Analysis
We intended to assess the stock and culture operations of asari clams in the entire Banzu culture area. Therefore, the data regarding our field observations of each culture area and the collected records regarding six FCAs were combined. The spatial density of clams was averaged for 51 stations. The quantity of harvested and seeded clams and number of operating harvester were summed for the six FCAs.
Prior to the estimation of stock biomass in D6 and D7, the body weights of the clam (w6
, w7
; g) for the median shell length (MLi
) in D6 (ML6
28.5 mm) and D7 (ML7
32.0 mm) were calculated using equation (2), which is the length–weight relationship obtained from the measurements of the collected clams: (2)
(2)
Stock biomass of harvestable-sized clams (s, mt) in the Banzu culture area was calculated using equation (3): (3)where d6j
and d7j
are the averaged densities (ind. m−2) of D6 and D7 in the culture area of FCA j, w6
and w7
are the body weights, and aj
is the area of culture plot (m2).
(3)where d6j
and d7j
are the averaged densities (ind. m−2) of D6 and D7 in the culture area of FCA j, w6
and w7
are the body weights, and aj
is the area of culture plot (m2).
Capture per unit effort (CPUE) was calculated using equation (4): (4)where H is harvested quantity (mt), E is the summed number of the persons operated harvesting.
Annual harvested ratio (f, harvested quantity/harvestable-sized biomass) was the averaged value of the ratios obtained from the bimonthly investigation of clam abundance: (5)where s is the harvestable biomass, and n is the annual number of samplings (= 6).
As an index of contribution of seeded clams to harvest, the contribution ratio (r) was calculated using equation (6): (6)where A is the quantity of seeded clams (mt).
To assess the contribution of harvestable stock biomass (s) and number of operating harvester (E) to the harvested quantity of clams (H), multiple regression analysis was carried out; as criterion variable was H, and explanatory variables were s and E.
The R software i386.3.6.2 (R Core Team, 2019) was used for statistical analysis.
3 Results
3.1 Abundance of clams
Temporal variation in the annual mean density of the clams monitored in the field investigation was different among size classes. The densities (ind. m−2) of the small-sized clams in D1 and D2 was 20–40 from the late 1980s to mid-1990s, followed by a continuous decrease from the late 1990s to early 2000s, when it reached <5–10 (Fig. 2a). However, since the mid-2000s, when the outbreak of sea spiders occurred, the mean density in D1 and D2 increased to 10–30 and 30–60, respectively. Slopes of the regression lines fitted to the changes of standardized densities exhibited decreasing (−0.033, p < 0.05) and stational (0.014, p > 0.05) trends in the study period in D1 and D2, respectively (Fig. 2e).
The densities of D3 and D4 were of approximately 100–200 from the late 1980s to mid-1990s (Fig. 2b). Afterwards, these densities varied similarly to those of D1 and D2, with a decrease in the early 2000s followed by a recovering period after the mid-2000s. Decreasing trends in density were observed in both D4 and D3, with the decrease in the former being a little larger than that in the latter (Fig. 2e).
The variations in density of D5 and D6 were different from those of D1–D4 (Fig. 2c). The densities in D5 and D6 continuously decreased from 120–330 and 70–150 before the early 1990s to 20–40 and <5–20 after 2010, respectively, without a subsequent recovery period. These large decreasing trends were detected for both groups over the study period (Fig. 2e).
Although the density in D7 varied largely, within 40–100, until the mid-2000s without clear trends, a sharp decrease after the outbreak of sea spiders led to a density of <5–20 after 2008 (Fig. 2d). The slope of the regression line was steeper in D7 than in D5 and D6 (Fig. 2e).
Decreasing variation trends were common in D1–D6 over the study period, except after the mid-2000s. The difference found in D5 and D6 compared to D1–D4 represents the lack of recovery in this period. In contrast, the variation in D7 was different from those in D1–D6, in which only a small variation was noted until the outbreak of sea spiders occurred.
 |
Fig. 2 Variation in the spatial density of sampled clams in seven size classes (D1–D7) divided by sieves of different mesh sizes (a–d), and comparison of the gradients of regression lines fitted to the temporal variations of standardized spatial density in the size classes (e). Lower limits of the shell length in D1–D7 were approximately 4, 7, 11, 16, 23, 27, and 30 mm, respectively. |
3.2 Seeding, harvestable stock, and harvest
The quantity of seeded clams, after reaching 2500–3000 mt in the late 1980s, gradually decreased to approximately 1000 mt in the mid-2000s (Fig. 3a). The sea spider infestation then led it to 50–300 mt after 2008. With this, the purchase price (yen kg−1) of seed clams increased from <200 in the late 1980s to >220 after 1990s (Fig. 3a).
The relationship between D4 (large wild clams) density and quantity of seeded clams could be divided into three periods: A) 1988–1990; B) 1991–2007; and C) 2008–2014 (Fig. 3b). In A, both wild large clams and seeded quantity were abundant; in C, quantity of seeded clams decreased because of the outbreak of sea spiders; and B was the period of decrease in quantity of seeded clams between periods A and C. In period B, seeded quantity seemed to be negatively correlated with D4 density (R 2 = 0.22, p = 0.18), which indicates that the introduction of seed clams may have been controlled according to the abundance of wild large clams in the culture area.
Stock biomass of harvestable clams (D6–D7) peaked at 4400–5000 mt and 4000–4900 mt in 1990–1991 and 1998–2000, respectively (Fig. 4a). After these periods, the stock decreased to 1500–3000 in the mid-2000s. Quantity of harvested clams varied, peaking at 3200–3700 mt and 3000–3700 mt in 1990–1992 and 1997–1999, respectively, which was synchronized with the variation of harvestable stock (Fig. 4b). Harvested quantity was correlated with stock biomass of harvestable clams not only over the study period (R 2 = 0.71, p < 0.01), but also during the period before sea spider infestation (1988–2007, R 2 = 0.34, p < 0.05) (Fig. 4c). No correlation between stock biomass of harvestable clams and seeded quantity was found in 1988–2007 (R 2 = 0.05, p = 0.35) (Fig. 4d).
 |
Fig. 3 Variations in quantity and unit price of seeded clams in the culture area in 1988–2014 (a), and relationship between density of wild juveniles and annual summed weight of seeded clams (b), which could be divided into three periods: A) 1988–1990; B) 1991–2007; and C) 2008–2014. Records of seeding in 2004 were unavailable. |
 |
Fig. 4 Variations in the stock biomass of the clams in harvestable size (D6–D7) (a) and harvest of the clams (b) in the culture area in 1988–2014, and relationship between harvestable stock and harvest (c), and the quantity of introduced seed clams and harvestable stock (D6–D7) (d). Records of harvest in 2004 were unavailable. |
3.3 Harvest effort and CPUE
The number of operating harvester (103 persons) continuously decreased from 21–26 in the 1990s to 14–16 in the late 2000s (Fig. 5a). The number of operating harvester was correlated with stock biomass of harvestable clams not only over the study period (R 2 = 0.74, p < 0.01), but also in 1992–2007 (R 2 = 0.31, p < 0.05) (Fig. 5b). This indicates that the number of operating harvesters increased with harvestable stock even in the period before sea spider infestation.
Generally, harvest is considered to be a function of harvestable stock and harvest effort. As a result of multiple regression analysis, the standard partial regression coefficients for s and E were 0.15 (p = 0.13) and 0.87 (<0.001) for 1992–2014 and 0.16 (0.30) and 0.86 (<0.001) for 1992–2007, respectively (Tab. 1). This clearly shows that, in both periods, the harvest depended more on the number of harvesters than on the harvestable biomass. The number of operating harvester was correlated with CPUE (R 2 = 0.40, p < 0.05) in the period before sea spider infestation (Fig. 5c).
 |
Fig. 5 Variation in the yearly sum of harvest effort (number of operating harvesters) in the culture area in 1988–2014 (a), and relationships between stock biomass of harvestable clams (D6, D7) and harvest effort (b) and CPUE and harvest effort (c). Records from 1986–1991 and 2004 were unavailable. |
Results of the multiple regression analysis for assessing the relationship of the biomass of harvestable stock (s) and the sum of operating persons (E) to the harvest (H) in the culture area in the Banzu tidal area.
3.4 Harvested and contribution ratios
In 1988–2003, the harvested ratio varied within 0.10–0.25 in accordance with the harvestable stock (R 2 = 0.69, p < 0.01) (Fig. 6a). This indicates that the harvested ratio increased with decreasing harvestable stock.
The contribution ratio increased with the decreasing quantity of seeded clams in 1986–2007 (R 2 = 0.44, p < 0.01) (Fig. 6b). The contribution ratio was approximately 1.0 when the quantity of seeded clams was as large as ca. 3000 mt, which indicates that harvest was comparable to quantity of seeded clams in those years.
 |
Fig. 6 Relationship between harvestable stock and f (ratio of harvest to harvestable stock) (a), and quantity of introduced seed clams stock and r (ratio of harvest to transplanted stock) (b). |
4 Discussion
4.1 Harvest and clam abundance
The correlation between harvested quantity and stock biomass of harvestable clams (D6–D7) indicates that the decrease in harvest was influenced by the abundance of harvestable clams in the Banzu culture area not only over the study period but also in the period before sea spider infestation (Fig. 4c). In 1988–2007, the decrease in clam density was obvious in D6, but not in D7 (Fig. 2c). The decrease of D6, which included the wild clams, may have been responsible for the decrease of harvest during this period. The sharp decrease of harvest after 2008 was caused by the high mortality rates of the large-sized clams because of the sea spider infestation, which also resulted in the suspension of seeding. During 1988–2007, the increased stock of large-sized clams by the considerable quantity of seeding (816–2458 mt) would have made the decrease of wild stock inconspicuous on the harvest. The decrease of the stock may have been apparent by the suspension of seeding since 2008.
Since the late 1980s, clam density decreased in D1–D6. The variations of clam densities were characterized and distinguished by whether they had a recovering period after the late 2000s, which coincides with the prevalence of sea spiders. The successive decreasing trend in D5–D7 over the study period resulted from an absence of recovery. Conversely, the increased density after the late 2000s in D1–D4 does not appear to have been influenced by the sea spider infestation. This difference between the size groups implies that different processes may have affected the decreases before 2007 and after 2008.
The mortality effects caused by predation (Kraeuter and Castagna 1989), parasitic disease (Waki and Yoshinaga, 2013), and hydrodynamic stress (St-Onge and Miron, 2007) have often varied with clam size. Strong mortality impact on large sizes of asari clams has been reported in predation (Shigeta et al., 2016) and physical disturbance (Kakino, 2006; Toba et al., 2016). The predation by the black porgy Acanthopagrus schlegelii may have caused the recent decline of asari clams in Banzu (Toba et al., 2020). Although, fatal effect of sea spider infection on asari clams was confirmed (Kobayashi and Toba, 2014; Yamada et al., 2018), difference of impact intensity with the clams size has not been reported.
4.2 Harvest effort and CPUE
The decrease in harvest effort after the late 1990s can be understood as the result of decreasing stock of harvestable clams (Fig. 5b). The fact that the harvest depended more on the harvest effort than on the stock biomass of harvestable clams (Tab. 1) explains the process in which the decline of harvestable stock lowered harvest effort, which in turn resulted in a low harvest.
The positive correlation between CPUE and harvest effort (Fig. 5c) indicates that the decrease in harvestable stock seemed not to be attributable to overharvesting, which has been often posed in the decreased events in clam harvest (Ren et al., 2008; Hamaguchi, 2011; Brusà et al., 2013). Additionally, this correlation represents the decrease in the number of operating harvester in 1991–2007 was resulted from a decrease of daily personal harvest. In the period of harvest decline, the work period was longer and some operators were unable to reach their daily quota (interview with FCA). Although the work period of the operators was not in the FCAs' records, harvest per unit time would have lowered in this period. If the work period of the operators were included in the calculations (unfortunately, it could not be included), CPUE could be used as an index of economic profitability for an operator. In this period, the personal daily quota was reduced by FCA, while working period was prolonged. A low profitability would lead operators to hesitate to go harvesting. The decrease of harvest in the Banzu culture area may be explained by the low number of harvesters, which in turn resulted from the reduced profitability because of the decline of harvestable stock.
4.3 Harvested and contribution ratios
The correlation between the harvested ratio and harvestable stock biomass (Fig. 6b) indicates that harvest pressure elevated in the years when harvestable stock was at a reduced level, probably due to the annual harvest planned by FCA not to the clam abundance. In the late 1980s, a large quantity of seed clams (2500–3400 mt) were introduced (Fig. 3a) despite the densities of large-sized clams (D5–D7) were high (Fig. 2c). The contribution ratio of approximately 1.0, recorded in the years when seeded quantity was approximately 3000 mt, indicated that the enhancing effect of harvestable stock by seeding was insignificant in these years, and culture profit simply depended on the difference of price between seeded and harvested clams. Considering that the contribution ratio increased when seeded quantity reduced (1991–2007), an excessive quantity of seed clams that exceeded biological productivity of the culture area may have introduced in this period, which would be encouraged by the affordable price of seed clams.
In Japan, the large-scale seeding of natural asari clams (>1000 mt annually) was performed for decades in Tokyo Bay (Toba, 2017) and Mikawa Bay (Kamohara et al., 2014). In the 1960–1970s, abundant low-priced seed clams could be introduced to the Banzu culture area (interview with FCA), because the stock level of asari clams was high in major areas of asari production in Japan. However, such condition may have led to the introduction of a large quantity of seeds with no regard to the carrying capacity in terms of biological productivity in the culture area. If this was the case, the excessive seeding observed in the late 1980s in the present study may have been implemented over preceding years based on the abundant seed supply.
After the late 1990s, harvest was declining mainly because of the extensive decrease of wild clams despite of seeding. Although the contribution ratio rose in this period compared to former years, seeding should have only limitedly enhanced harvestable stock. Considering that harvestable stock was not correlated with seeded quantity (Fig. 4d), harvest should have significantly depended on the wild clams even in the culture area in the study period.
5 Conclusions
The present study emphasizes two findings, which are especially pertinent to the management of asari clam culture areas supported by the introduction of seed clams. First, a certain management style, based on accurate predictions of the contributions of wild and introduced clams to future stock biomass, is essential for economically-feasible culturing. This indication is common in culture operations using artificial seed clams (Kraeuter and Castagna, 1989, Castagna, 2001). However, there are several examples of culture areas using natural seed clams, particularly in cases of abundant seed supply. Periodical evaluation of the standing biomass of clam stock in addition to estimation of the carrying capacity of the culture areas will support reliable planning even at high levels of stock.
Second, the final factor behind the observed decrease in harvested quantity may be due to the decreased profitability of clam harvesting in Banzu. Basically, harvest quantity is determined by the quota established by the culturing plans of FCAs. In areas with less harvestable stock (e.g., reduced occurrence of wild juveniles or insufficient supply of seed clams), actions should be taken to maintain the incomes of harvesters while avoiding overexploitation, even if the total harvest quantity decreases.
Acknowledgements
The authors express their sincere gratitude to the fishermen for their generous cooperation to the field work performed during the investigation of clam abundance; to the relevant FCAs for providing records of the culture activities and interviews; and to Ms. H. Miki, Ms. Y. Watanabe, Ms. Y. Fukuda, and Ms. M. Ishii for their assistance in sample processing and treatment. This study was carried out in the research programs of Chiba Prefectural Fisheries Research Center and Chiba Federation of Fisheries Cooperative Associations under their own financial resources.
Appendix 1
Seasonal variations in the spatial density of wild juveniles (a) and clams in harvestable size (b), weight of harvested clams (c) and introduced seed clams (d), operating harvesters day−1 (e), and capture per unit effort (CPUE, harvest per operating person) in the culture area of the Banzu tidal area in 1986–2016. Spatial densities (a, b) and records of production (c–f) were investigated bimonthly and monthly, respectively. NA, data were not available. In c–f, data from 2004 were excluded due to a major absence of records (open triangles).

References
- Bartoli M, Nizzoli D, Viaroli P, Turolla E, Castaldelli G, Fano EA, Rossi R. 2001. Impact of Tapes philippinarum farming on nutrient dynamics and benthic respiration in the Sacca di Goro. Hydrobiologia 455: 203–212. [CrossRef] [Google Scholar]
- Bartoli M, Castaldelli G, Nizzoli D, Fano EA, Viaroli P. 2016. Manila clam introduction in the Sacca di Goro Lagoon (Northern Italy): ecological implications. Bull Jap Fish Res Edu Agen 42: 43–52. [Google Scholar]
- Becker P, Barringer C, Marelli DC. 2008. Thirty years of sea ranching Manila clams (Venerupis philippinarum): successful techniques and lessons learned. Rev Fish Sci 16: 44–50. [CrossRef] [Google Scholar]
- Brusà RB, Cacciatore F, Ponis E, Molin E, Delaney E. 2013. Clam culture in the Venice lagoon: stock assessment of Manila clam (Venerupis philippinarum) populations at a nursery site and management proposals to increase clam farming sustainability. Aquat Living Resour 26: 1–10. [CrossRef] [Google Scholar]
- Campos CJA, Cachola RA. 2005. The introduction of the Japanese Carpet Shell in coastal lagoon systems of the Algarve (South Portugal): a food safety concern. Internet J Food Saf 8: 1–2. [Google Scholar]
- Canu DN, Campostrini P, Riva SD, Pastres R, Pizzo L, Rossetto L, Solidoro C. 2011. Addressing sustainability of clam farming in the Venice Lagoon. Ecol Soc 16: 26. [Google Scholar]
- Castagna M. 2001. Aquaculture of the hard clam, Mercenaria mercenaria, in: J.N. Kraeuter, M. Castagna (Eds.) Biology of the Hard Clam, Elsevier Science B. V., Amsterdam, pp. 675– 699. [CrossRef] [Google Scholar]
- Chiba Prefectural Fisheries Research Center. 2019. Information on seawater quality in Tokyo Bay. https://www.pref.chiba.lg.jp/lab-suisan/suisan/suisan/kaikyoujouhou/index.html (accessed March 28, 2020) (in Japanese) [Google Scholar]
- Chew KK. 1989. Manila clam biology and fishery development in western North America, in: J.J. Manzi, M. Castagna (Eds.) Developments in Aquaculture and Fisheries Science 19, Clam Mariculture in North America, Elsevier Science Publishers B. V, Amsterdam, pp. 243– 261. [Google Scholar]
- Chung EY, Hur YB, Shin MS, Kim Y. 2001. Gonadal Maturation and Artificial Spawning of the Manila Clam, Ruditapes philippinarm (Bivalvia: Veneridae), in Komso Bay, Korea. Fish Aquat Sci 4: 208–218. [Google Scholar]
- Cigarrı́a J, Fernández JM. 2000. Management of Manila clam beds. Aquaculture 182: 173–182. [CrossRef] [Google Scholar]
- Clarke LJ, Esteves LS, Stillman RA, Herbert RJH. 2019. Population dynamics of a commercially harvested, non-native bivalve in an area protected for shorebirds: ruditapes philippinarum in Poole Harbour, UK. Aquat Living Resour 32: 10. [CrossRef] [Google Scholar]
- de Montaudouin X, Arzula I, Caill-Milly N, Khayati A, Labrousse J-M., Lafitte C, Paillard C, Soudant P, Goulletquer P. 2016. Asari clam (Ruditapes philippinarum) in France: history of an exotic species 1972-2015. Bull Japan Fish Res Educ Agency 42: 35–42. [Google Scholar]
- Fang J, Lin Z. 2016. Development of manila clam industry in China. Bull Japan Fish Res Educ Agency 42: 29–34. [Google Scholar]
- Food and Agriculture Organization of the United Nations, 2018a. Global capture production. http://www.fao.org/fishery/statistics/global-capture-production/query/en (accessed November 15, 2019). [Google Scholar]
- Food and Agriculture Organization of the United Nations, 2018b. Global aquaculture production. http://www.fao.org/fishery/statistics/global-aquaculture-production/query/en (accessed November 15, 2019). [Google Scholar]
- Goulletquer P. 1997. A bibliography of Manila clam Tapes philippinarum. IFREMER, RIDRV-97.021RN La Tremblade, France. https://archimer.ifremer.fr/doc/00000/3221/ [Google Scholar]
- Hamaguchi M. 2011. Relationship among primary production, marine environment and fisheries production of bivalves in the Seto Inland Sea. Bull Fish Res Agen 34: 33–47. [Google Scholar]
- Humphreys J, Harris MRC, Herbert RJH, Farrell P, Jensen A, Cragg SM. 2015. Introduction, dispersal and naturalization of the Manila clam Ruditapes philippinarum in British estuaries, 1980–2010. J Mar Biol Assoc UK 95: 1163–1172. [CrossRef] [Google Scholar]
- Juanes JA, Bidegain G, Echavarri-Erasun B, Puente A, García Ana, García Andrés, Bárcena JF, Álvarez C, García-Castillo G. 2012. Differential distribution pattern of native Ruditapes decussatus and introduced Ruditapes phillippinarum clam populations in the Bay of Santander (Gulf of Biscay): considerations for fisheries management. Ocean Coast Manag 69: 316–326. [CrossRef] [Google Scholar]
- Kakino J. 2006. Study on the effects of physical and chemical environmental factors on the Japanese littleneck clam Ruditapes philippinarum (memorial lecture on receiving the award of the society). Fish Eng 43, 117–130. [Google Scholar]
- Kamohara S, Yamada S, Sone R, Aoki S. 2014. Production mechanism of the juvenile Japanese littleneck clam, Ruditapes philippinarum, in the Rokujo tidal flats of Mikawa Bay. Bull Aichi Pref Fish Exp Sta 19: 1–9. [Google Scholar]
- Kraeuter JN, Castagna M. 1989. Factors affecting the growth and survival of clam seed planted in the natural environment, in: J.J. Manji, M. Castagna (Eds.) Clam Mariculture in North America. Elsevier, New York, pp. 149–165. [Google Scholar]
- Kobayashi Y, Toba M. 2014. Affects of severe outbreak of parasitic sea spider, Nymphonella tapetis, on fisheries and mortality of manila clam in Banzu tidal flat, Tokyo Bay. Bull Chiba Pref Fish Res Ctr 8: 27–33. [Google Scholar]
- Mizuno T, Maruyama T, Higano J. 2009. Transition and prospects of asari clam (Ruditapes philippinarum) fisheries in Ise Bay, Mie Prefecture. Bull Mie Pref Fish Res Inst 17: 1–21. [Google Scholar]
- Moura P, Garaulet LL, Vasconcelos P, Chainho P, Costa JL, Gaspar MB. 2017. Age and growth of a highly successful invasive species: the manila clam Ruditapes philippinarum (Adams & reeve, 1850) in the Tagus estuary (Portugal). Aquat Invasions 12: 133–146. [CrossRef] [Google Scholar]
- Paillard C, Maes P, Oubella R. 1994. Brown ring disease in clams. Ann Rev Fish Dis 4: 219–240. [CrossRef] [Google Scholar]
- Park KI, Choi KS, Choi JW. 1999. Epizootiology of Perkinsus sp. found in the Manila clam, Ruditapes philippinarum in Komsoe Bay, Korea. J Korean Fish Soc 32: 303–309. [Google Scholar]
- Park KI, Choi KS. 2001. Spatial distribution of the protozoan parasite Perkinsus sp. found in the Manila clams, Ruditapes philippinarum, in Korea. Aquaculture 203: 9–22. [CrossRef] [Google Scholar]
- Pellizzato M, Da Ros L. 2005. Clam farming quality as a management tool: a proposal based on recent studies in Northern Adriatic lagoons. Aquac Int 13: 57–66. [CrossRef] [Google Scholar]
- Ponti M, Castellini A, Ragazzoni A, Gamba E, Ceccherelli VU, Abbiati M. 2017. Decline of the Manila clams stock in the northern Adriatic lagoons: a survey on ecological and socio-economic aspects. Acta Adriat 58: 89–104. [CrossRef] [Google Scholar]
- Ponurovsky S. K, Yakovlev Y. M. 1992. The reproductive biology of the Japanese littleneck, Tapes philippinarum (A. Adams and Reeve, 1850) (BIVALVIA: Veneridae). J. Shellfish Res 11: 265–277. [Google Scholar]
- R Core Team. R: A language and environment for statistical computing. R Foundation for Statistical Computing, Vienna, Austria. 2019. https://www.R-project.org/ [Google Scholar]
- Ren Y, Xu B, Guo Y, Yang M, Yang J. 2008. Growth, mortality and reproduction of the transplanted Manila clam (Ruditapes philippinarum Adams & Reeve 1850) in Jiaozhou Bay. Aquac Res 39: 1759–1768. [CrossRef] [Google Scholar]
- Robert R, Sánchez JL, Pérez-Parellé L, Ponis E, Kamermans P, O'Mahoney M. 2013. A glimpse on the mollusc industry in Europe. Aquac Eur 1–12. [Google Scholar]
- Shigeta T, Saito H, Tomiyama T, Sakai Y, Shimizu N. 2016. Seasonal occurrence of large-sized black porgy, Acanthopagrus schlegelii in an intertidal short-neck clam fishery ground in Hiroshima Bay, Japan. Bull Hiroshima Univ Museum 8: 31–37. [Google Scholar]
- Sladonja B, Bettoso N, Zentilin A, Tamberlich F, Acquavita A. 2011. Manila clam (Tapes philippinarum Adams & Reeve, 1852) in the Lagoon of Marano and Grado (Northern Adriatic Sea, Italy): socio economic and environmental pathway of a shell farm, in: B. Sladonja (Ed.) Aquaculture and the Environment − A Shared Destiny, InTech Publisher, pp. 51−78. [Google Scholar]
- St-Onge P, Miron G. 2007. Effects of current speed, shell length and type of sediment on the erosion and transport of juvenile softshell clams (Mya arenaria). J Exp Mar Biol Ecol 349: 12−26. [CrossRef] [Google Scholar]
- Suhrbier AD, Cheney DP, Cordell JR, Dewey WF, Davis JP, Ferreira JG. 2017. Innovative farming methods for production and harvest of Manila clams in Washington State. World Aquac 49–57. [Google Scholar]
- Tamaki A, Nakaoka A, Maekawa H, Yamada F. 2007. Bivalve resources in the phytoplankton-feeding guild on an intertidal sandflat in Ariake Sound: Proposition of a hypothesis on the carrying capacity limitation. Jap J Benthol 62: 73–81. [Google Scholar]
- Tezuka N, Kamimura S, Hamaguchi M, Saito H, Iwano H, Egashira J, Fukuda Y, Tawaratsumida T, Nagamoto A, Nakagawa K. 2012. Settlement, mortality and growth of the asari clam (Ruditapes philippinarum) for a collapsed population on a tidal flat in Nakatsu, Japan. J Sea Res 69: 23–35. [CrossRef] [Google Scholar]
- Toba M. 2004. The decline of Manila clam stock in Tokyo Bay. Bull Fish Res Agency Suppl, 13–18. [Google Scholar]
- Toba M. 2017. Revisiting recent decades of conflicting discussions on the decrease of asari clam Ruditapes philippinarum in Japan: a review. Nippon Suisan Gakkaishi 83: 914–941. [CrossRef] [Google Scholar]
- Toba M, Kobayashi Y, Kakino J, Yamakawa H, Ishii R, Okamoto R. 2016. Stocks and fisheries of asari in Japan. Bull Japan Fish Res Educ Agency 42: 9–21. [Google Scholar]
- Toba M, Kobayashi Y, Shibata T. 2020. Characteristic changes in the population dynamics of asari (Manila) clam Ruditapes philippinarum in a period of stock decrease on the Banzu intertidal flat, Tokyo Bay. J Sea Res 157: 101845. [CrossRef] [Google Scholar]
- Tomiyama T, Yamada K, Wakui K, Tamaoki M, Miyazaki K. 2016. Impact of sea spider parasitism on host clams: relationships between burial patterns and parasite loads, somatic condition and survival of host. Hydrobiologia 770: 15–26. [CrossRef] [Google Scholar]
- Tsutsumi H. 2005. Marked decline of clam harvesting fisheries and environmental changes on the tidal flats facing the Ariake Sea in Kumamoto Prefecture. Ecol Civ Eng 8: 83–102. [CrossRef] [Google Scholar]
- Waki T, Yoshinaga T. 2013. Experimental challenges of juvenile and adult Manila clams with the protozoan Perkinsus olseni at different temperatures. Fish Sci 79: 779–786. [CrossRef] [Google Scholar]
- Yamada K, Miyazaki K, Tomiyama T, Kanaya G, Miyama Y, Yoshinaga T, Wakui K, Tamaoki M, Toba M. 2018. Impact of sea spider parasitism on host clams: susceptibility and intensity-dependent mortality. J Mar Biol Assoc UK 98: 735–742. [CrossRef] [Google Scholar]
Cite this article as: Toba M, Kakino J, Tada K, Kobayashi Y, Tsuchie H. 2020. Production of asari (Manila) clams, Ruditapes philippinarum, during the period of harvest decrease in the 2000s in the Banzu tidal area, Tokyo Bay. Aquat. Living Resour. 33: 14
All Tables
Results of the multiple regression analysis for assessing the relationship of the biomass of harvestable stock (s) and the sum of operating persons (E) to the harvest (H) in the culture area in the Banzu tidal area.
All Figures
|
Fig. 1 Map of the Banzu tidal area. The licensed areas are spatially divided into three areas: culture area, where clams are restocked with transplanted seed clams; leisure harvested area, which are open seasonally to non-professional fisherman that pay a harvest charge; fishery area (the rest of the area), for harvest of wild clams. Spatial density of the clams was monitored in 51 sites (filled circle) in the culture area in 1988–2014. Numerals on the chart indicate water depth (m) during the mean low water level of the spring tide. |
| In the text | |
|
Fig. 2 Variation in the spatial density of sampled clams in seven size classes (D1–D7) divided by sieves of different mesh sizes (a–d), and comparison of the gradients of regression lines fitted to the temporal variations of standardized spatial density in the size classes (e). Lower limits of the shell length in D1–D7 were approximately 4, 7, 11, 16, 23, 27, and 30 mm, respectively. |
| In the text | |
|
Fig. 3 Variations in quantity and unit price of seeded clams in the culture area in 1988–2014 (a), and relationship between density of wild juveniles and annual summed weight of seeded clams (b), which could be divided into three periods: A) 1988–1990; B) 1991–2007; and C) 2008–2014. Records of seeding in 2004 were unavailable. |
| In the text | |
|
Fig. 4 Variations in the stock biomass of the clams in harvestable size (D6–D7) (a) and harvest of the clams (b) in the culture area in 1988–2014, and relationship between harvestable stock and harvest (c), and the quantity of introduced seed clams and harvestable stock (D6–D7) (d). Records of harvest in 2004 were unavailable. |
| In the text | |
|
Fig. 5 Variation in the yearly sum of harvest effort (number of operating harvesters) in the culture area in 1988–2014 (a), and relationships between stock biomass of harvestable clams (D6, D7) and harvest effort (b) and CPUE and harvest effort (c). Records from 1986–1991 and 2004 were unavailable. |
| In the text | |
|
Fig. 6 Relationship between harvestable stock and f (ratio of harvest to harvestable stock) (a), and quantity of introduced seed clams stock and r (ratio of harvest to transplanted stock) (b). |
| In the text | |
Current usage metrics show cumulative count of Article Views (full-text article views including HTML views, PDF and ePub downloads, according to the available data) and Abstracts Views on Vision4Press platform.
Data correspond to usage on the plateform after 2015. The current usage metrics is available 48-96 hours after online publication and is updated daily on week days.
Initial download of the metrics may take a while.