Free Access
Fig. 5
Download original image
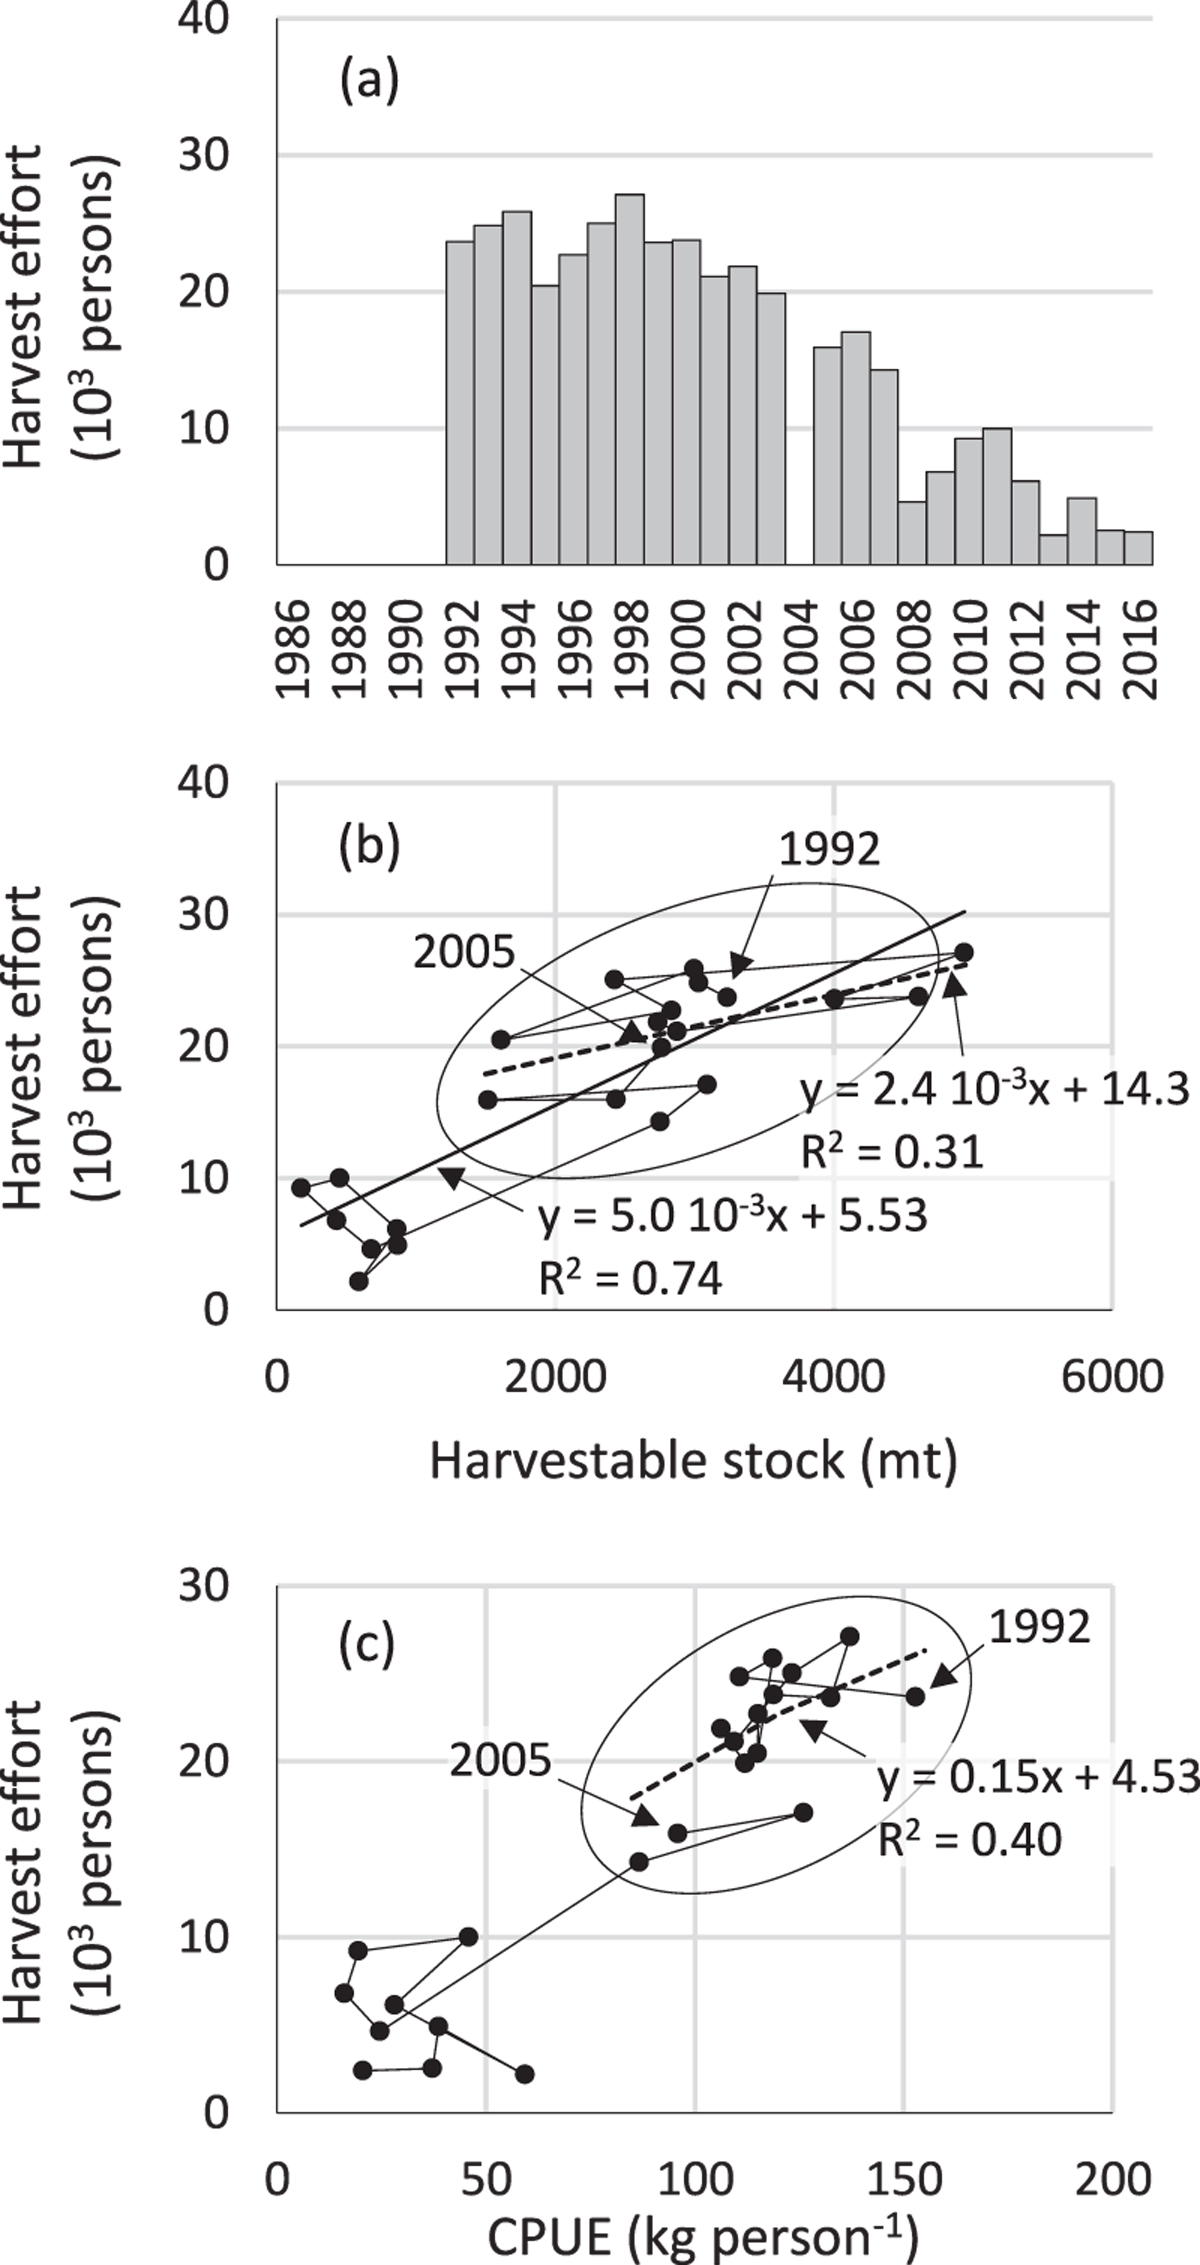
Variation in the yearly sum of harvest effort (number of operating harvesters) in the culture area in 1988–2014 (a), and relationships between stock biomass of harvestable clams (D6, D7) and harvest effort (b) and CPUE and harvest effort (c). Records from 1986–1991 and 2004 were unavailable.
Current usage metrics show cumulative count of Article Views (full-text article views including HTML views, PDF and ePub downloads, according to the available data) and Abstracts Views on Vision4Press platform.
Data correspond to usage on the plateform after 2015. The current usage metrics is available 48-96 hours after online publication and is updated daily on week days.
Initial download of the metrics may take a while.