


| Issue |
Aquat. Living Resour.
Volume 39, 2026
Special Issue - Interdisciplinary issues on Manila and European clams in their socio-ecosystems
|
|
|---|---|---|
| Article Number | 25 | |
| Number of page(s) | 14 | |
| DOI | https://doi.org/10.1051/alr/2026016 | |
| Published online | 28 July 2026 | |
Research Article
Using Environmental DNA metabarcoding to detect clams in lagoons
1
MARBEC, Univ Montpellier, CNRS, Ifremer, IRD, Montpellier, France
2
MARBEC, Univ Montpellier, CNRS, Ifremer, IRD, Sète, France
3
Argaly, Bâtiment CleanSpace, Sainte-Hélène-du-Lac, France
4
Ifremer, IRSI, SeBiMER Service de Bioinformatique de l’Ifremer, Plouzané, France
* Corresponding author: This email address is being protected from spambots. You need JavaScript enabled to view it.
Received:
27
September
2025
Accepted:
15
June
2026
Abstract
Clams are coastal resources widely exploited by both fishing and aquaculture. Most inhabit shallow waters, especially lagoons, that are transitional zones between the sea and land. In the Mediterranean French lagoons, two clam species are usually exploited: the native European clam, Ruditapes decussatus, and the introduced Manila clam, Ruditapes philippinarum, whereas several others are not of fishing interest, such as the golden carpet shell, Polititapes aureus. Those animals are relatively small, spend most of their lives buried, and can be difficult to identify based on shell morphology. Therefore, we tested a metabarcoding approach to detect clam species from environmental DNA (eDNA) samples. After an in silico comparison between a universal and a group-specific metabarcode, we conducted an in vivo experiment to characterise this metabarcode on clams and tested it in situ in two French lagoons. Specifically, we aimed to answer the following questions: (1) Is the group-specific metabarcode developed for freshwater Venerida also usable for marine Venerida and, more specifically, for clam species? (2) What clam species are detected in two French Mediterranean lagoons? (3) Is the intraspecific information of interest in characterising the populations and improving the surveys? The metabarcode proved to be very powerful to detect the targeted clam species and allowed support for a very significant depletion of the European clam in one lagoon and the predominance of the Manila clam in another lagoon. This eDNA metabarcoding protocol allows species identification with an easy deployment on the field and no clam sampling.
Key words: Clams / metabarcoding / lagoons / Venerida / Ruditapes
Handling Editor: Pierre Boudry
© S. Lapègue et al., Published by EDP Sciences 2026
 This is an Open Access article distributed under the terms of the Creative Commons Attribution License (https://creativecommons.org/licenses/by/4.0), which permits unrestricted use, distribution, and reproduction in any medium, provided the original work is properly cited.
1 Introduction
Environmental DNA (eDNA) is a complex mixture of DNA from various organisms extracted from environmental samples such as soil, water, or air (Taberlet et al., 2012). It was first studied by microbiologists (Ogram et al., 1987) as it provided access to unculturable microorganisms in marine sediments. This difficulty in detecting and characterising organisms is also prevalent in the aquatic realm. In 2008, eDNA was first employed to detect invasive species in freshwater (Ficetola et al., 2008) and subsequently to monitor marine mammals (Foote et al., 2012). eDNA surveys focus on the presence or absence of genetic material from target species within a sampled area, which is vital for detection and monitoring. They are particularly useful for detecting rare, elusive, threatened, or emerging invasive species. Furthermore, this method offers significant advantages in habitats that are difficult and/or time-consuming to sample with classic methods, such as large aquatic systems like lakes, lagoons, rivers (e.g., Rees et al., 2014), or open sea (Jaquier et al., 2024).
Lagoons are transitional zones between the sea and land. They are typically under the influence of the sea, yet more or less isolated by a physical barrier (Fiandrino et al., 2017). Often quite shallow, with depths generally around 1 m, some of the French Mediterranean lagoons can reach depths of 4 to 6 m. They are vulnerable to human pressure, often leading to eutrophication (Le Fur et al., 2019). They often exhibit very high primary and secondary production, making them ideal for fishing and aquaculture. This productivity is partly exploited by shellfish farming, and most lagoons support fishing to varying extents. Clams are one of these coastal resources widely exploited by both fishing and aquaculture. They are bivalve molluscs of the order Venerida (Gray, 1854) and the family Veneridae, found in both freshwater and marine environments. China is the major producer, followed by Italy, whose production represented 92% of the European market in 2021 (FAO, 2021). Total French commercial clam fishing production is roughly estimated at around 2000 to 3000 tons per year (Caill-Milly et al., 2025). This includes catches from two species found along the French coasts, the Manila clam Ruditapes philippinarum (A. Adams and Reeve, 1850), and the European clam Ruditapes decussatus (Linnaeus, 1758). The latter is currently in scarce supply and comprises only 1%–10% of the Veneridae abundance when the two species cohabit in the same deposit. The Manila clam was initially introduced to France for aquaculture purposes in the early 1970s (de Montaudouin et al., 2016). This species has rapidly demonstrated better growth performance than the native species, R. decussatus, especially along the Bay of Biscay, English Channel, and Mediterranean coasts, forming naturalized populations (Velez et al., 2017). Both species bury in sandy, muddy gravel or clay bottoms and occupy lower shores and shallow sublittoral areas (Bidegain and Juanes, 2013). Reproduction occurs in the Mediterranean from April to May, and larvae travel into the water column for a period of 1–2 months.
Interestingly, the two species have a unique history in two main lagoons along the French Mediterranean coast. In the Berre lagoon, located near Marseille (Bouches-du-Rhône, France; Fig. 1), two clam species were present in the 1950s: R. decussatus and Polititapes aureus (Gmelin, 1791). In 1966, the installation of a hydroelectric power plant in the north of the lagoon led to the extinction of many species, including clams. Surprisingly, a stock assessment conducted in 2015 identified only R. philippinarum individuals, despite there being no record of an introduction program for this species into the Berre lagoon. In 2018, a new ecological crisis resulted in the depletion of the clam stock and consequently the end of fishing activity that same year (Mahé et al., 2020). Yet, a morphological and genetic analysis confirmed the presence of R. philippinarum in the Berre lagoon, as well as in the nearby Carteau inlet (Mahé et al., 2022). This same study concluded that only R. decussatus was present in the westerner lagoons, on the Mediterranean coast of Occitanie from the Spanish border to Montpellier (Hérault, France), including the Thau Lagoon (Fig. 1). However, knowledge on the clam community in the Thau lagoon is scarce and limited to fishing volumes. The period from 1979 to 1985 was the ‘golden age’ of clam fishing in the lagoon. From the 1990s onwards, fishing volumes began to decline due to the decrease in the R. decussatus stock. In 1980, a study was conducted in the lagoon to compare the repopulation potential of R. philippinarum and R. decussatus (Maître-Allain, 1983). A total of 30,000 R. philippinarum spat were seeded on the south shore of the lagoon with no further information regarding their potential settlement in the lagoon. Today, clam digging serves as a partial substitute activity for fishermen.
Although R. philippinarum and R. decussatus are morphologically very similar, the main external criterion for discriminating these species is the degree of siphon separation: in R. decussatus, the siphons are entirely separated, whereas in R. philippinarum, they are not (Hurtado et al., 2011). However, when considering the external morphology of the shell, several ecological factors (Caill-Milly et al., 2014) may come into play, leading to high phenotypic plasticity of the Ruditapes shell in general, especially at the spat level. Moreover, other species of marine clam are present in lagoons that are not of fishing interest due to their small size or rarity: for example, in France the pink clam Polititapes rhomboides (Pennant, 1777), the pullet carpet shell clam Venerupis corrugata (Gmelin, 1791), or the golden carpet shell P. aureus. Finally, like freshwater bivalves, those animals are relatively small, spend most of their lives buried, are difficult to identify based on shell morphology (Prié and Puillandre, 2014), and are consequently very difficult to detect in the field without sampling.
To support sustainable management for both fisheries and conservation of clams in lagoons, it is important to understand which clam species are present, their population dynamics, and their effects on the environment (Caill-Milly et al., 2021). Because R. philippinarum has been introduced in several places in Europe and exhibits characteristics of an invasive species (de Montaudouin et al., 2016), it has successfully occupied areas previously inhabited by native species. In some cases, it coexists with related clam species, such as R. decussatus and V. corrugata, as observed in Portugal (Velez et al., 2017; Bidegain and Juanes, 2013), or it replaces native species, as seen in the Venice lagoon (Cebrian et al., 2013). Therefore, our aim was to use a molecular tool on eDNA samples to detect the presence and potential coexistence of clam species, including the two main ones found in France. Without considering human transfers, both species exhibit different strategies against temperature exposure, which may influence their distribution in lagoons, given the climate change and particularly the global warming occurring in the Mediterranean Sea.
While DNA barcoding is a diagnostic technique in which a short DNA sequence can be used for species identification, DNA metabarcoding involves the simultaneous identification of many taxa mixed within the same sample (Taberlet et al., 2012). eDNA metabarcoding consists of taking samples from the environment via water, sediment, or air; extracting DNA; amplifying it using universal primers; and sequencing it to generate thousands to millions of reads. For metabarcoding, the development of universal primers targeting all species from a wide group has been a focus. Moreover, recent studies have begun to use multiple group-specific primers to increase taxonomic coverage (Couton et al., 2022). Our objective, focused on clam biodiversity assessment, was to use a narrower group-specific metabarcode. Therefore, we were interested in the metabarcoding approach developed by Prié et al. (2021) for all freshwater bivalves of the Western Palearctic. After an in silico comparison between a universal metabarcode and the group-specific metabarcode developed by Prié et al. (2021), we conducted an in vivo experiment to assess the reliability of this metabarcode on our targeted species and then tested it in situ in two French lagoons. We aimed to answer the following questions: (1) Is the metabarcode designed specifically for freshwater Venerida also adapted for the marine Venerida, and more specifically, clam species? (2) What clam species are detected in the Thau and Berre lagoons? (3) Is the intraspecific information of interest in characterising the populations and improving the surveys?
2 Materials and methods
2.1 Metabarcode choice
The eDNA samples were amplified using a pair of primers targeting a small fragment of the mitochondrial 16S ribosomal gene called Vene01 (Venerida forward: 5’-CSCTGTTATCCCYRCGGTA-3’; Venerida reverse: 5’-TTDTAAAAGACGAGAAGACCC-3’) (Prié et al., 2021). These primers were originally designed for freshwater Venerida, but during the in silico PCR analysis performed by Prié et al. (2021), they amplified more than 1000 haplotypes belonging to 683 taxa, including marine species. More specifically, several clam species were mentioned, such as R. decussatus, R. philippinarum, V. corrugata, P. aureus, or P. rhomboides, that are likely to be present in Mediterranean lagoons. The choice of the Vene01 metabarcoding marker was formally validated by performing an in silico analysis to examine two criteria: (1) primer conservation and specificity for Veneroida and (2) taxonomic resolution for R. decussatus, R. philippinarum, and P. aureus as well as P. rhomboides and V. corrugata.
Primer conservation was also evaluated for the marker developed by Leray et al. (2013), which targets a 313 bp fragment (excluding primers) of the mitochondrial Cytochrome c Oxidase subunit I gene (COI), a fragment of the standard animal barcoding region widely referenced in public sequence databases.
To assess the first criterion, the program ecoPCR (Ficetola et al., 2010) was used to run an in silico PCR with the Vene01 or COI Leray primers on the GenBank public sequence database version 249. Up to three mismatches per primer were allowed, and the in silico amplicon size (excluding primers) was set in the interval 10–1000 bp. To avoid biasing results in favour of widely sequenced species, one amplicon was randomly selected for species displaying several in silico amplicons. The resulting amplicons were used to build mismatch plots for both Venerida and non-Venerida taxa and primer sequence logos using the ggseqlogo R package (Wagih, 2017). Sequence logos are graphical representations of primer conservation at each position of the primer for a target group. They consist of stacks of letters symbolising the nucleotides, with one stack for each position in the sequence. The overall stack height indicates nucleotide conservation at that position, while letter heights within the stack are proportional to nucleotide frequencies at that position. The second criterion, taxonomic resolution, was evaluated for Vene01 by checking the specificity of in silico MOTUs (molecular operational taxonomic units) associated with the studied species, i.e., whether they were shared with other species.
2.2 Study design
2.2.1 In situ locations
Water samples were collected from the Thau and Berre lagoons. Sampling was conducted at a total of 12 sites: 9 in the Thau Lagoon and 3 in the Berre Lagoon (Fig. 1A). These sites were chosen based on abundance indices measured during clam stock assessments (Mahé et al., 2020; Patrissi et al., 2023). At each site, water samples of 30 L were taken in two replicates.
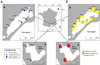 |
Fig. 1 In situ clam species detection. (A) Map of sampling locations in two Mediterranean lagoons with three different levels of clam abundance. (B) Clam species detection. The species are identified by a colour code: P. aureus in yellow, R. decussatus in green, and R. philippinarum in red. |
2.2.2 Experimental design
The experimental phase took place at the Ifremer station in Sète, in a room specifically arranged for wet environment manipulations. New, lidless aquariums, cleaned with fresh water, were filled with 15 L of non-filtered seawater. The water was pumped from the canal next to the station, which connects the Thau lagoon to the Mediterranean Sea. The aquariums were spaced approximately 50 cm apart. In each aquarium, aerators were operated for 48 h to degas the water. The R. philippinarum animals used to create the reconstituted communities were harvested in November 2022 in the Berre lagoon by the company Murex Coquillages (Sète, France). The R. decussatus animals were harvested from a shallow zone of the Thau lagoon at the same period. The average weight of the R. philippinarum and R. decussatus clams was 12.7 ± 2.1 g and 9.1 ± 2.1 g, respectively. All individuals were stored by species in acclimation tanks for 48 h. The reconstituted communities were assembled for a duration of 24 h following the design in Figure 2A.
Aquariums AQ01 and AQ07 were free of clams, while AQ13 and AQ14 were, respectively, filled with 25 and 47 clams of R. decussatus and R. philippinarum, respectively, initially acting as reserves of samples. In other aquariums, there were a total of 10 clams with a varying proportion of both species.
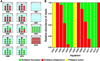 |
Fig. 2 Experimental clam species detection. (A) Diagram of the experimental setup. The reconstituted communities are created in two replicates with different numbers of animals represented by coloured clams, and the remaining clams are grouped in aquariums AQ13 (n = 25) and AQ14 (n = 47). The two empty aquariums (AQ01 and AQ07) are filled with the same canal water as the other aquariums. (B) Relative abundance of the species detected in the different aquariums. The species are identified by a colour code: P. aureus in yellow, R. decussatus in green, and R. philippinarum in red. |
2.3 Water sample collection
In situ water samples were collected in June and July 2023 from the Thau and Berre lagoons, respectively. Using a small inflatable boat, a Waterra™ peristaltic pump (60 L h−1) (Mississauga, ON, Canada) was connected via a sterile disposable tube to a Waterra™ filtration capsule with a filtration surface area of 600 cm2 and a pore diameter of 0.45 μm. The capsule was attached to a table positioned about 30 cm from the bottom. After 30 min of filtration, the table was brought to the surface. Once the setup was out of the water, the capsules were inverted, and the pump was reactivated to remove any residual water. For the experimental samples, the entire volume of water from the 14 aquariums was filtered using the same equipment as that used in the field.
After filtration, the capsules were filled with 50 ml of Longmire’s preservation buffer (Longmire et al., 1997). The capsules were shaken for 1 min, mechanically with a shaker for those used at the Ifremer station and manually for those used in situ. The capsules were then stored at 4 °C until the DNA extraction step. Longmire buffer is known to stabilize metazoan DNA for at least 1 year when samples are stored in a cool place, away from UV light.
2.4 eDNA extraction, amplification, and sequencing
Both eDNA extraction and amplification were performed by Argaly (Sainte-Hélène-du-Lac, France). Two to eight months after sampling, DNA was extracted following the NucleoSpin® Soil protocol (Macherey-Nagel, Düren, Germany) with the following modifications: (1) the capsules were shaken mechanically for 2 min; (2) all filtrates were transferred to 50 ml tubes and centrifuged for 1 h at 12 000 g; (3) the pellets were resuspended in ATL buffer (Qiagen, Hilden, Germany) and proteinase K, then incubated for 2 h at 56 °C. The extraction then proceeded according to the manufacturer’s protocol. The obtained DNA extracts were eluted in a final volume of 100 μl of elution buffer.
The samples were amplified using a pair of primers targeting a small fragment of the 16S ribosomal gene (Prié et al., 2021; see Sect. 2.1). Each sample was amplified in eight replicates. The forward and reverse primers were indexed with an eight-nucleotide tag on the 5’ end. These tags are used to assign the sequences to the corresponding replicate during bioinformatic analysis. The PCR reaction mix included 10 μl of AmpliTaq Gold Master Mix, 2 μl of a mix of both primers (with a concentration of 5 μM each), 0.16 μl of bovine serum albumin (20 mg ml−1; Roche Diagnostics, Bâle, Switzerland), and 2 μl of DNA extract diluted to 1/5, for a total volume of 20 μl. The amplification program began with an initial denaturation step at 95 °C for 10 min, followed by 36 cycles of denaturation at 95 °C for 30s, hybridization at 53 °C for 30s, and elongation at 72 °C for 1 min. The final elongation step lasted 7 min at 72 °C. PCR results were purified using the MinElute™ kit (Qiagen, Hilden, Germany) and checked on a 2% agarose gel using E-Gel™ Power Snap (Invitrogen, Carlsbad, CA, USA). To check for contamination, two extraction and two PCR negative controls were included in the experiment and amplified in eight PCR replicates, like any sample. Positive control samples were prepared using DNA extraction from the tissues of 6 different clams (CPOS180 and CPOS181 for P. aureus, CPOS182 and CPOS183 for R. philippinarum, and CPOS184 and CPOS185 for R. decussatus). Another control was formulated by mixing the six extracts (CPOS186).
The library construction and sequencing were performed by Fasteris (Geneva, Switzerland), following the Metafast protocol (Fasteris, 2025). This protocol limits chimera formation within the amplicon pool and thus tag jumps between PCR replicates (Schnell et al., 2015). Sequencing was conducted on an Illumina NextSeq platform with 2 × 150 bp paired-end reads (Illumina, San Diego, CA, USA). Bioinformatic controls, i.e., tag combinations that do not exist in the experiment (n = 32), were also analysed to assess the levels of tag jumps.
2.5 DNA extraction, amplification, and sequencing from the clam tissue samples of the experiment in aquariums
After sampling, all the clams present in the aquariums were frozen at −20 °C until the dissection of the mantles, which were preserved in 96% EtOH at 4 °C. DNA extraction and purification were performed using the Maxwell® 16 Instrument (Promega corporation, Madison, WI, USA) and the Maxwell® 16 LEV Blood DNA kit, following the manufacturer’s instructions. Pinhead-sized pieces of mantles were dissected using a sterile scalpel and incubated 2 h at 56 °C in 300 μl of lysis buffer and 20 μl of proteinase K (Maxwell® 16 LEV Blood DNA kit solutions), in a Dry Block Heater SBH200D/3 (Stuart, Stafford, United Kingdom). Then, the extracted DNA were purified by magnetic beads technology before being eluted in 100 μl of elution buffer (Promega Corporation, Madison, USA) and quantified by spectrophotometry NanoDrop™One (Thermo Scientific, Waltham, MA, USA).
As above, the amplification of the small 16S region (Vene01) was done using primers barcode developed by Prié et al. (2021). Amplifications were performed using the PCR illustra™ puReTaq Ready-To-Go™ kit (Cytiva, Waltham, MA, USA) in a total volume of 25 μl, containing 5–50 ng of template DNA and 1.25 μl of each primer, Venerida Forward (10 μM) and Venerida Reverse (10 μM), completed up to 25 μl with molecular biology grade water. The PCR reactions were carried out in a Mastercycler®ep thermocycler (Eppendorf, Hamburg, Germany). Cycling parameters were 3 min at 95 °C, followed by 50 cycles of 30 s at 95 °C, 30 s at 50°C, and then 30 s at 72 °C and a final elongation step of 5 min at 72 °C. PCR products (3 μl) were controlled by migration on 1% agarose gel prepared in 0.5× TAE with Midori Green Advance nucleic acid dye (Genetics) for 35 min at 100 V constant, using the Mupid®One electrophoresis system (Advance, Tokyo, Japan). The amplified DNAs were stored at −20 °C, before being shipped for Sanger sequencing in both directions by GenoScreen (Lille, France).
2.6 Bioinformatics pipeline
The raw metabarcoding data were analyzed using SAMBA v4.0.0 (Cormier et al., 2021), a standardized and automated metabarcoding analysis workflow. The workflow included three main components: data integrity checking, bioinformatics processes, and statistical analyses. QIIME 2 v2022.11.1 (Bolyen et al., 2019) and DADA2 v1.26.0 (Callahan et al., 2016) were utilized initially. Raw data processing involved filtering, including primer trimming and removing reads with complete or incorrect primer sequences, using Cutadapt v4.2.0 (Martin, 2011). DADA2 is an approach based on a model-based error correction algorithm to infer exact amplicon sequence variants (ASVs). This approach resolves sequence variation down to single-nucleotide differences resulting in higher-resolution and more reproducible clusters. To mitigate potential overestimation of diversity inherent to DADA2, an additional step of ASV clustering was performed using dbOTU3 V1.5.3 (Olesen et al., 2017). Subsequently, taxonomic assignment of resulting ASVs was conducted using a consensus approach between a naive Bayesian method implemented in QIIME2 and BLAST v12.2.0 (Altschul et al., 1990). Both taxonomic assignment methods were performed against the MIDORI2 16S database (Leray et al., 2022).
Data decontamination was carried out using Thresholds Cross-Contamination (TCC; Galan et al., 2016), referencing negative controls and bioinformatic controls. For each ASV, the maximum sequence count observed in blank samples served as the threshold for cross-contamination. These values were subtracted from the abundances present in the actual samples. Additionally, ASVs were removed from samples where they represented less than 0.5% of the sequences.
2.7 Clam tissue sequence and diversity analyses
The sequences were aligned and manually edited using Geneious Prime® 2025.0.2 (Drummond et al., 2009). Only high-quality sequences were retained for analysis. Visual inspection of peaks on chromatograms was used to identify polymorphic sites and determine unique haplotypes. The haplotypic diversity index h (Nei, 2019) was estimated for the R. decussatus population used in the experimental design. Median-joining haplotype networks (Templeton et al., 1992) were constructed to assess the level of genetic variation within each of the targeted clam populations using popART version 1.7 (Leigh and Bryant, 2015). Haplotype networks accurately represent differences existing among sampled haplotypes through grouping identical DNA sequences within the same vertex. The size of a given vertex is proportional to the number of DNA sequences it contains. Divergent haplotypes are connected via edges that display the number of mutational differences separating adjacent vertices.
2.8 Statistical analyses
Statistical analyses were performed using R software v4.3.2 (R Core Team, 2023). The relationship between the abundance of clams present in the aquariums and the number of reads for a given species was assessed using a Pearson correlation test. Additionally, the influence of clam species and the number of individuals on the number of reads for a given species in the aquariums was examined using a two-factor ANOVA. Another analysis of variance was conducted to determine whether the clam abundance index had an impact on the numbers of reads detected in samples collected from the lagoons.
Finally, the figures were improved and grouped thanks to Inkscape v1.3.2 (Inkscape Project, 2020).
3 Results
3.1 Raw data description and decontamination
The raw sequencing data encompass 166 files from 45 controls (32 bioinformatic, 2 negative extraction, 2 negative PCR, and 9 positive PCR), 14 experimental samples, and 24 in situ samples. They are available in the European Nucleotide Archive under BioProject accession number PRJEB82463 (https://www.ebi.ac.uk/ena/browser/view/PRJEB82463). From the raw 5901,076 paired-end reads, a total of 4054 ASVs were retrieved after bioinformatic analyses. After the decontamination process, 130 ASVs, representing 5269,985 assembled reads from the 6 positive, 14 experimental, and 24 in situ samples, were retained for further analyses. The characteristics of those ASVs are detailed in Lapègue et al. (2025).
3.2 A marine Venerida metabarcode
Mismatch plots reveal that both Vene01 primers are conserved across Venerida. Most amplicons of this target group show one mismatch at most per primer (Fig. 3A), whereas for non-Venerida, the average number of mismatches per primer is higher for both primers (Fig. 3B). This suggests that Vene01 primers are well-adapted for Venerida amplification while being rather specific to this group. This contrasts with the mismatch plots for the COI Leray marker, where the forward primer is more conserved for non-target taxa than for Venerida on average and where there is no obvious difference in the number of mismatches on the reverse primer for target and non-target taxa (Figs. 3C and 3D). Moreover, the forward primer shows as many as three mismatches for about 38% of Venerida species.
The sequence logos provide additional information on primer conservation in Venerida, specifically regarding the localisation of mismatches along the primer sequences. For Vene01, variability mostly occurs in 5’ of the primers, and the last bases in 3’, where primer extension occurs, are not polymorphic (Figs. 3E and 3F). This is not the case for the COI Leray primers, which have variable nucleotides in the 3’ end and throughout the primer sequences, generally every three bases, although this is somewhat compensated by base degeneracy (Figs. 3G and 3H).
Finally, taxonomic resolution of the Vene01 metabarcode is excellent for the three studied species, with an in silico size range of 121–164 bp (Fig. S1), as they are represented by several sequences and MOTUs in GenBank, and none are shared with other species (Tab. 1). Furthermore, for those three species but also the other clam species potentially present in the area (P. rhomboides and V. corrugata), analyses of in silico Vene01 amplicons revealed similar levels of primer conservation (Tab. S1).
The in situ experiment allowed characterising the specificity of the marker in a marine environment, the Thau and Berre lagoons. A total of 2816, 176 sequences were obtained in situ, with important variations among sites (Fig. S2A). Among these, 55% could be assigned to the Venerida order and to three species in particular: P. aureus, R. decussatus, and R. philippinarum.
At a higher taxonomic level, the Mollusca phylum represents 88% of the sequences. Within Mollusca, the Bivalvia and Gastropoda orders are both represented. Within the Bivalvia, members of the Cardiida, such as Abra alba (6%) and Cerastoderma glaucum (4%), can be noted. Within the Gastropoda, three genera were more prominently present: Pusilina, Rissoa, and Bittium (21%). The presence of these taxa was particularly pronounced in the Berre Lagoon. In these three sites, although almost all the sequences were molluscs (Fig. S2B), less than half were bivalves (Fig. S2C), including the aforementioned Cardiida, which accounted for around 25%, 50%, and 75%, respectively, at the three Berre sites sampled (Fig. S2D).
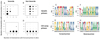 |
Fig. 3 Comparison of Vene01 and COI Leray primers. Numbers of forward and reverse in silico mismatches of Vene01 primers with their target sequences in Venerida (A) and non-Venerida (B) species; numbers of forward and reverse in silico mismatches of the COI Leray primers with their target sequences in Venerida (C) and non-Venerida (D) species. Sequence logo representations of forward (E) and reverse (F) Vene01 primer conservation in Venerida and sequence logo representations of forward (G) and reverse (H) COI Leray primer conservation in Venerida. |
In silico taxonomic resolution of the Vene01 metabarcoding marker for the three studied species, as well as P. rhomboides and V. corrugata. ‘MOTUs’ refer to unique sequences, and ‘amplicons’ refer to occurrences of the MOTU(s) in GenBank.
3.3 Detection of the clam species
The in vivo testing in aquariums shows that Vene01, the 16S Venerida metabarcode, is very efficient in detecting the two clam species that were combined in different ratios (Fig. 2B). Globally, the mean abundance of sequences was 168,654 (± 59,995) per aquarium. Of these, 98% were assigned to R. decussatus and R. philippinarum. The empty clam aquariums (AQ01 and AQ07) contained fewer sequences (10,186 and 29,753, respectively), with about half attributed to P. aureus. The sequences of the positive tissue controls (CPOS180 to CPOS185) were attributed to the species used in their design. The size of the fragments varied from 122 to 165 bp according to the species. In aquariums with clams (AQ02 to AQ06 and AQ08 to AQ14), the sequence abundance of both species accurately represents the composition of the reconstituted communities. For example, in aquarium AQ05, we found 93% and 7% of sequences assigned to R. decussatus and R. philippinarum, respectively, compared with an expected 90%:10% ratio. Pearson correlations reveal very strong and significant positive correlations between sequence numbers and biomass for the two species making up the reconstructed communities (Fig. 4).
Moreover, analysis of variance indicates that biomass is a factor with a significant effect on the abundance of reads detected (F1,16 = 97.6, P-value <0.001), while the ‘species’ factor alone or in interaction with the ‘biomass’ factor has no significant effect (F1,16 = 0.099, P-value = 0.757; F1,16 = 0.210, P-value = 0.653, respectively). In summary, the biomass is a determining factor in the number of reads, independently of the species, confirming a robust and consistent relationship between these variables. The 16S marker is therefore well suited for detecting the eDNA of R. philippinarum and R. decussatus, even when these two species cohabit.
In situ, only three species of Venerida were detected: P. aureus, R. decussatus, and R. philippinarum. In the Thau lagoon, P. aureus is highly detected, while R. decussatus appears in only one sample (Thau 4) at a very low level (0.02% of all reads). In the Berre lagoon, almost all the clams detected are R. philippinarum, even if 1.4% of reads are attributed to P. aureus in Berre1 (Fig. 1B). Moreover, the analysis of variance showed that the 'density index' factor has no significant effect on the abundance of clam reads detected in situ (F2,21 = 1.155, P-value >0.1).
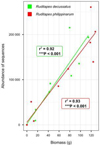 |
Fig. 4 Correlation between the abundance of reads and biomass in the aquariums. |
3.4 Intraspecific diversity
Among the 130 ASVs obtained, 14 were assigned to clam species: 6 to R. decussatus (named RD1 to RD6), 3 to R. philippinarum (named RP1 to RP3), and 5 to P. aureus (named PA1 to PA5) (Lapègue et al., 2025; Fig. 5A). Those sequences are thereafter referred to as haplotypes.
In aquariums (left of Fig. 5A), the 6 haplotypes of R. decussatus are present, with RD1 being the most abundant. In AQ11, there are 6 clams with RD1 and 2 clams with RD2, and in AQ06, there are 6 clams with RD1, 1 with RD2, and 3 with RD3. Moreover, the high diversity can be seen in AQ13, filled with 25 European clams, with 19 RD1, 2 RD3, 2 RD4, 1 RD5, and 1 RD6. This pattern contrasts with 100% R. philippinarum clams being RP1 in all aquariums where the species is present, even in AQ14 filled with 47 R. philippinarum clams.
To confirm these intraspecific results, we sequenced the same 16S region from the 172 R. philippinarum and R. decussatus clams of the aquariums. We got 169 reliable sequences that exactly correspond to the 9 haplotypes detected with the water samples in the corresponding aquariums, in very close proportions (Lapègue et al., 2025; Fig. S3). Only a few minor discrepancies could be found, for example, in AQ06, with a percentage of 86% RD1, 2% RD2, and 12% RD3, whereas there are 7 clams with RD1, 1 clam with RD2, and 2 clams with RD3, giving expected percentages of 70% RD1, 10% RD2, and 20% RD3. The 75 R. decussatus clam samples all come from the same population, and the haplotypic diversity index h for this population was estimated at 0.2970.
In situ (right of Fig. 5A), R. decussatus, detected at a very low level in the Thau lagoon, was represented only by haplotype RD1 in Thau3. On the contrary, the intraspecific diversity of R. philippinarum can be mainly seen in situ in Berre1, where about 25% of the sequences are RP2. This RP2 haplotype is very divergent from RP1 (Fig. 5B) with 33 mutations and could be assigned with 100% similarity in GenBank to the male lineage of the partial 16S mitochondrial genome (AF492465). It has to be noted that PA4 is also very divergent from PA1 with 14 mutations.
Considering P. aureus, it was detected in the two empty aquariums with PA1 in AQ01 and PA2 in AQ07, which we can consider as a trace of P. aureus specimens near the IFREMER station. Properly speaking, in situ sampling, PA1 is largely predominant in Thau Lagoon but absent in Berre Lagoon. Haplotypes PA2 to PA5 were also observed in the Thau and Berre lagoons.
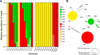 |
Fig. 5 Intraspecific diversity within the three clam species. (A) Relative abundance of the 14 clam haplotypes detected in the aquariums and in situ. (B) Haplotype networks of the three species. The haplotypes are identified by a colour gradient: P. aureus in yellow, R. decussatus in green, and R. philippinarum in red. The size of each circle is proportional to the number of reads of each haplotype found both in aquariums and in situ. |
4 Discussion
The choice of a metabarcode is crucial in any DNA metabarcoding study (Zinger et al., 2019). Although many mitochondrial DNA regions have been suggested, the Consortium for the Barcode of Life has adopted the mitochondrial COI gene for standard DNA barcoding of single animal specimens. However, it has been argued that COI does not contain suitably conserved regions for most amplicon-based metabarcoding applications (Deagle et al., 2014). This is what we observed in the sequence logo representations in Venerida with variable nucleotides in 3’ and throughout the primer sequences. Furthermore, the non-Venerida taxa tend to display fewer primer mismatches on the reverse primer than the Venerida, and the forward primer showed as many as three mismatches for about 38% of Venerida species. As the marker choice is contingent on study system and research question, especially in relation to desired taxonomic resolution, we decided to use the Vene01 barcode developed by Prié et al. (2021) in a small 16S region as a kind of ‘ targeted metabarcoding ’ for clams, being more reliable and more suited to our inquiry than COI. For the three studied species but also the other clam species potentially present in the area (P. rhomboides and V. corrugata), analyses of in silico Vene01 amplicons revealed similar levels of primer conservation, suggesting that these five species do not face any amplification bias with this marker. Moreover, all five species do not share any in silico Vene01 MOTU with another species, indicating that the Vene01 can discriminate between them perfectly. Considering the trace amounts of degraded DNA from the study organisms in environmental samples, a small barcode size (usually <200 bp) is recommended for higher PCR success rates (Taberlet et al., 2018), which is the case for Vene01 with the size of the fragments varying between 122 and 165 bp according to the three target clam species. Furthermore, our analyses could rely on a comprehensive and relevant reference database extracted from GenBank (version 249).
This metabarcode was mainly used for diversity analyses of freshwater Venerida populations. However, in Prié et al. (2021) and studies using those barcodes, the specificity of the Vene01 metabarcode to Venerida was not mentioned. In our study, the use of the MIDORI2 16S database, which includes eukaryotic 16S sequences, allowed us to detect that 45% of the sequences did not belong to Venerida (Fig. S2), although 88% of the sequences belonged to Molluscs. Hence, while very powerful for Venerida and especially the targeted clams, this metabarcode is not specific in the marine realm. This was confirmed in the study of Shi et al. (2024), where Vene01 was tested in a marine environment, the Yangtze River estuary. The results also indicated that about 80% of the amplified sequences belonged to Bivalvia, but about 20% to Gastropoda and a few to non-Molluscs (Fig. 2 in Shi et al., 2024). However, even considering the potential ‘lost sequences’ assigned to non-Venerida taxonomic groups, Vene01 proved to be very useful in detecting our targeted clam species. In particular, among the bivalves, it did not detect Crassostrea gigas (Thunberg, 1793), the Pacific oyster, which is largely present in the Thau lagoon.
Following the in silico evaluation of primer conservation, we performed in vivo testing by deploying the assay in aquariums containing our clams of interest, as recommended for environmental DNA studies for aquatic species detection (Goldberg et al., 2016). Alongside several negative controls, we added positive controls, among which were tissues of three clam species, a form of in vitro testing, although not using non-targeted species. The results obtained with these controls were satisfactory for analysing the in vivo dataset. In aquariums, the 16S Venerida metabarcode proved to be very efficient in detecting the two clam species that were reconstituted in different ratios. Moreover, we found correlations between eDNA quantities and biomass without any bias towards one species or the other, indicating that this marker is well suited to detect the eDNA of R. philippinarum and R. decussatus, even when these two species cohabit. Such quantitative positive correlations have often been found in experimental settings but not always in the field, being observed in 90% of the studies in Rourke et al. (2022) but only 50% in Yates et al. (2019). Hence, we did not find any correlations between the number of reads and the density index used in the in situ sampling in the lagoons. Our sampling strategy indeed suffers from several weaknesses. For the Berre lagoon sampling, the density parameter was based on the data by Mahé et al. (2020), 3 years before our sampling. In the Thau lagoon, the water sampling was performed a few weeks after the specific sampling designed to assess the demographic structure and estimate the marketable stock of clams in the lagoon (Patrissi et al., 2023). Although using the same GPS coordinates to return to sites considered with high, average, or zero abundance (Fig. 1A), the two samplings could be a few tens of metres apart. Moreover, critical factors to consider in the water body are the transport, dilution, and decay of eDNA. Although our sampling methodology was designed to be as close as possible to the target community, we know that water movement is important in those lagoons (Fiandrino et al., 2017; Lagarde et al., 2019). Moreover, aqueous eDNA from macroorganisms generally occurs at very low concentrations and can be heterogeneously distributed throughout a water body (Pilliod et al., 2013). As a consequence, eDNA originating outside of a sampling area can be transported into and deposited within the sampling area (Mahon et al., 2013). Aquariums AQ01 and AQ07 perfectly illustrate this, as they did not contain any clams but were filled with water from a canal linked to the Thau lagoon, in which a few thousand reads of P. aureus were detected. As a result, our in situ results are discussed solely based on species detection.
As a final step, our in situ sampling and analysis validated the assay performance by applying the primers to eDNA samples collected from two lagoons where the target species are known (or supposed) to be absent and present (Goldberg et al., 2016). Moreover, following the development of the assay, such an eDNA survey eliminates the need for physically sampling individuals and replaces time-consuming and often difficult morphological identifications (Klymus et al., 2017). For comparison, 2874 clams were extracted from 326 sites of the Thau lagoon over approximately three full weeks of diving and boarding a boat in Patrissi et al. (2023), whereas only three days of water sampling were required for eDNA pumping and filtering. In the Berre lagoon, this number reached 4059 clams in 238 sites (Mahé et al., 2020). Although quantitative information cannot be retrieved from the eDNA survey, the non-invasiveness and time-efficiency of this tool are clearly major advantages. However, at this stage, the eDNA survey may deserve to be tested in other areas where R. decussatus is more abundant.
Our in situ eDNA results align with the clam species recently detected in the Berre (Mahé et al., 2020) and Thau lagoons (Patrissi et al., 2023). In the Thau lagoon, two species were found, with a large predominance of P. aureus and one site with a few sequences of the European clam, R. decussatus. Although current practices for water sampling involve filtering about 1–5 L (Bruce et al., 2021), we choose to filter a higher volume (about 30 L) to achieve a sufficient level of true positives and minimise false absences (Valentini et al., 2016; Couton et al., 2023). Increasing the volume is particularly important when the DNA concentration of the target taxa is expected to be low. Despite this, R. decussatus was only marginally detected, although we know it is present. Some animals were sampled very close to the edge, mainly at sites far from shellfish farming areas, in shallow zones (maximum depth 30 cm). These sites were called ‘pépite’ (‘nugget’ in English) sites in Patrissi et al. (2023), and some of those animals from one specific site were used in our experimental design in aquariums. However, our water sampling strategy did not include those shallow zones. In this context, the presence of R. decussatus might be slightly underestimated, despite the dilution effect of the water body. As in Patrissi et al. (2023), our findings do not allow concluding that the European clam has disappeared from the Thau lagoon, but they do support a very significant depletion of this species. P. aureus is the predominant clam species detected in the Thau lagoon. Although P. aureus has a potential economic interest in countries such as Egypt or Tunisia (Kandeel, 2018; Derbali, 2024), an important limitation in the Thau lagoon is its low growth potential, with a mean size of 13.9 mm and about 95% of the clam smaller than 20 mm (Patrissi et al., 2023). This species, known as ‘clovisse’ in the Thau lagoon and sometimes included in bivalve fisheries (Derolez, 2020), is not of commercial interest locally and more generally in France. It is important to note that, despite its presence in numerous lagoons in France, its invasive species traits (Savini et al., 2010), and the spat seeding performed in 1980 (Maître-Allain, 1983), the Manila clam was not detected in the Thau lagoon. P. aureus is also detected in Berre lagoon but at a very low rate, with R. philippinarum being the predominant species. This confirms the observations from Mahé et al. (2022).
In general, mitochondrial genes are maternally inherited, do not recombine, and are physically linked together. Because of this, single short mtDNA markers may not contain enough intraspecific genetic variation to conduct detailed population genetic analyses (Andres et al., 2023). However, in recent years, studies have begun to explore the detection and quantification of mitochondrial genetic variation within species using eDNA approaches and their potential for population genetics (see reviews in Andres et al. 2023 and Couton et al. 2023). For example, Sigsgaard et al. (2016) recovered mitochondrial haplotypes of whale sharks from seawater samples and tissue samples in similar frequencies, using a mitochondrial fragment of more than 400 bp. In our study, we detected intraspecific variation in the 16S fragment, mainly as SNPs. However, we also observed indels in P. aureus with a range length of 121–122 bp and 164–165 bp for R. philippinarum, but all haplotypes were 134 bp for R. decussatus. Our bioinformatic pipeline proved to accurately downscale at the intraspecific level, as all the haplotypes present in the tissue samples from the aquariums were successfully distinguished in the same eDNA samples. This can be seen for R. decussatus with six haplotypes detected, one of which is predominant (Fig. 5 and Fig. S3). All those clams came from one of the ‘pepite ’ sites, and the haplotypic diversity h can also be interpreted as about a 30% probability of observing a previously unseen haplotype upon sampling a new individual (Wares and Pappalardo, 2016). Furthermore, the presence of numerous rare haplotypes in the R. decussatus ‘star-like ’ network may suggest undersampling of intraspecific genetics and/or a population bottleneck effect. These interpretations are questionable given the low sequence size of the 16S fragment studied (134 bp for R. decussatus) but indicate that a certain level of genetic diversity is still present after the significant depletion observed, which might be encouraging for restoration plans. However, further analyses with other barcodes may be needed to better characterize the demographic history of those clams. In situ, the only haplotype detected in Thau4 is the more abundant one (RD1). On the contrary, we detected only one haplotype (RP1) of R. philippinarum in the aquariums, both in tissues and in the water, although a total of 97 clams participated in this experiment. These animals were provided by a fisherman, and their origin in the Berre lagoon is unknown. Haplotype RP1 is also the only one detected in eDNA from Berre2 and Berre3 where few or no clams are known to be present. However, in Berre1, where an abundant population is living, three different haplotypes where detected, especially RP2, very divergent from RP1 (33 SNPs for a 165 bp fragment), accounting for about 25% of the sequences. This RP2 sequence was similar to the male lineage (M-type) of the 16S part of the mitochondrial genome (Passamonti et al., 2003) of R. philippinarum and RP1 to the female lineage (F-type). Hence, the existence of such divergent mitochondrial lineages in a species corresponds to doubly uniparental inheritance (DUI), which has been reported so far only in bivalve species, but in more than 100 different ones (Passamonti and Plazzi, 2020). After first being discovered first in Mytilus edulis (Skibinski et al., 1994; Zouros et al., 1994), it is now well described in the Veneridae family, where 18 species are known to exhibit DUI but 10 do not (Xu et al., 2024). Among them, R. philippinarum exhibits DUI, but R. decussatus does not, while it is unknown for P. aureus. Unlike the strict maternal inheritance found in the broad majority of metazoans, DUI is characterised by the F-type lineage being transmitted through the egg and the M-type through the sperm. Therefore, these two sex-associated mtDNAs undergo independent evolution, explaining such high divergence. The R. philippinarum M-type lineage was found in Berre1 where an abundant population of clams is present in June, corresponding to the reproductive period of this species. Hence, we hypothesise that the detection of this large amount of M-type lineage may be linked to a male spawning event in the Berre1 area. We did not detect this RP2 sequence in aquariums because the experiment was performed in November, outside the reproductive period. The eDNA tool might therefore be very efficient to detect the presence of R. philippinarum during the spawning period thanks to this feature of mitochondrial inheritance. In addition, the Vene01 barcode can be used not only to detect the invasive species R. philippinarum, as performed by other barcodes (Couton et al., 2019; Fernandez et al., 2021), but also to analyse clam species and intraspecific diversity. Concerning P. aureus, haplotype PA4, which had 14 differences with the most abundant haplotype PA1, was also found in Berre1 like RP2. It is identical to P. aureus sequences found in Tunisia (PP270288 to PP270290), but those sequences were not associated with any more information. Therefore, although we cannot reject the hypothesis of PA4 being the male lineage (M-type) of the 16S part of the mitochondrial genome in P. aureus, more specific studies are needed for this species.
To conclude, our study showed that, although not specific to the Venerida order in the marine realm, the Venerida metabarcode proved to be very powerful to detect the targeted clam species, with an easy deployment on the field and no clam sampling. This eDNA approach could be expanded to study resources on a European scale as part of the ‘European Network for Clam Research and Management’ (Riquet et al. 2026). In southern France, it allowed support a very significant depletion of the European clam in the Thau lagoon, without any Manila clam detected. In many lagoons and estuaries (Arcachon Bay in France and Venice lagoon in Italy, for example), the Manila clam seems to have replaced the endemic European clam, completely occupying its ecological niche (Marin et al., 2003). However, in other European estuaries, such as the Bay of Santander, both resources regularly persist. Very few studies have examined the extent of competition between the two species and the impact of the Manila clam on the endemic species (Bidegain and Juanes, 2013). The causes of the collapse of the European clam stock must be sought elsewhere and take into account hazards during larval development leading to poor recruitment, the trend towards oligotrophication over the last 50 years (Derolez, 2020), the presence of pathogens, repeated bottom anoxia (Borsa and Millet, 1992), and the acidification and warming of the coastal waters (Van Colen et al., 2020).
Acknowledgements
We would like to thank Florian Hugo, Jordane Limonet, Michela Patrissi, and Jean-François Holley from CEPRALMAR and Ismaël Bernard from Eureka-Mer for providing clam density data of the PALTEVA campaign. We would also like to thank Béatrice Pary of SMBT for her links with the bivalve fishing sector in the region, CRPMEM and CRCM for their contacts, and Jean-Marie Ricard and Yannick Cartier of the Thau-Ingril prudhommie for their support and access to fishing sites. We would also like to thank Nicolas Mayot of GIPREB for exchanging information on the Berre lagoon, and Florence Sanchez and Nathalie Caill-Milly of Ifremer for fruitful discussions on clams in general. Manila clams from the Berre lagoon for the eDNA experiment were donated by Jean-Marc Vitale of Murex Coquillages. This work was supported by Ifremer Scientific department (PALDIAG project, 2022–2024).
Supplementary Material
Fig. S1. Visual representation of the different MOTUs identified in silico for the species of interest. MOTU1 is always the most abundant MOTU.
Fig. S2. Taxonomic characterisation of the 130 ASVs obtained in the study. A: Abundance of sequences in situ. Relative abundance of reads at different taxonomic levels: Phylum (B), Class within Mollusca (C), Order within Bivalvia (D). The level of interest is always represented in orange in the figures and the corresponding text in bold in the legends.
Fig. S3. Comparison of the proportion of the haplotypes detected in clam tissues and water ADNe in the 12 aquariums where clams were present. The haplotypes are identified by a colour gradient: R. decussatus in green and R. philippinarum in red.
Table S1. Information on in silico primer conservation of the Vene01 primers for the three studied species, as well as P. rhomboides and V. corrugata.
Access Supplementary MaterialReferences
- Altschul SF, Gish W, Miller W, Myers EW, Lipman DJ. 1990. Basic local alignment search tool. J Mol Biol 215: 403–410. [CrossRef] [PubMed] [Google Scholar]
- Andres KJ, Lodge DM, Sethi SA, Andrés J. 2023. Detecting and analysing intraspecific genetic variation with eDNA: From population genetics to species abundance. Mol Ecol 32: 4118–4132. [Google Scholar]
- Bidegain G, Juanes JA. 2013. Does expansion of the introduced Manila clam Ruditapes philippinarum cause competitive displacement of the European native clam Ruditapes decussatus? J Exp Mar Biol Ecol 445: 44–52. [Google Scholar]
- Bolyen E, Rideout JR, Dillon MR, Bokulich NA, Abnet CC, Al-Ghalith GA, et al. 2019. Reproducible, interactive, scalable and extensible microbiome data science using QIIME 2. Nat Biotechnol 37: 852–857. [CrossRef] [PubMed] [Google Scholar]
- Borsa P, Millet B. 1992. Recruitment of the clam Ruditapes decussatus in the Lagoon of Thau, Mediterranean. Estuar Coast Shelf Sci 35: 289–300. [Google Scholar]
- Bruce K, Blackman R, Bourlat SJ, Hellström AM, Bakker J, Bista I, et al. 2021. A practical guide to DNA-based methods for biodiversity assessment. Adv Books 1: e68634. [Google Scholar]
- Caill-Milly N, Bru N, Barranger M, Gallon L, D’Amico F. 2014. Morphological trends of four Manila clam populations (Venerupis philippinarum) on the French Atlantic coast: Identified spatial patterns and their relationship to environmental variability. J Shellfish Res 33: 355–372. [Google Scholar]
- Caill-Milly N, Sanchez F, Lissardy M, Bru N, Kermorvant C, de Montaudouin X, et al. 2025. Manila clam (Ruditapes philippinarum) in France: Fishing activity, governance and present knowledge challenges regarding its biology and ecology. Estuar Coast Shelf Sci 317: 109206. [Google Scholar]
- Caill-Milly N, Sanchez F, Lissardy M, de Montaudouin X, Bru N, Kermorvant C, Ganthy F. 2021. Drawing lessons from a pluridisciplinary approach associating stakeholders for a better management of a bivalve population (French Atlantic coast)? Estuar Coast Shelf Sci 251: 107194. [Google Scholar]
- Callahan BJ, McMurdie PJ, Rosen MJ, Han AW, Johnson AJA, Holmes SP. 2016. DADA2: High-resolution sample inference from Illumina amplicon data. Nat Methods 13: 581–583. [CrossRef] [PubMed] [Google Scholar]
- Cebrian E, Francour P, Galil B, Otero M del M, Savini D. Monitoring marine invasive species in Mediterranean marine protected areas (MPAs): a strategy and practical guide for managers. IUCN Report, 2013, 138 pages. [Google Scholar]
- Cormier A, Durand P, Noel C, Leroi L. SAMBA: Standardized and Automated MetaBarcoding Analyses workflow. WorkflowHub Report, 2021. https://doi.org/10.48546/WORKFLOWHUB.WORKFLOW.156.1 [Google Scholar]
- Couton M, Comtet T, Le Cam S, Corre E, Viard F. 2019. Metabarcoding on planktonic larval stages: An efficient approach for detecting and investigating life cycle dynamics of benthic aliens. Manag Biol Invasions 10: 657–689. [Google Scholar]
- Couton M, Lévêque L, Daguin-Thiébaut C, Comtet T, Viard F. 2022. Water eDNA metabarcoding is effective in detecting non-native species in marinas, but detection errors still hinder its use for passive monitoring. Biofouling 38: 367–383. [Google Scholar]
- Couton M, Viard F, Altermatt F. 2023. Opportunities and inherent limits of using environmental DNA for population genetics. Environ DNA 5: 1048–1064. [Google Scholar]
- de Montaudouin X, Arzul I, Caill-Milly N, Khayati A, Labrousse JM, Lafitte C, Paillard C, Soudant P, Goulletquer P. 2016. Asari clam (Ruditapes philippinarum) in France: History of an exotic species 1972–2015. Bull Jpn Fish Res Educ Agency 42: 35–42. [Google Scholar]
- Deagle BE, Jarman SN, Coissac E, Pompanon F, Taberlet P. 2014. DNA metabarcoding and the cytochrome c oxidase subunit I marker: not a perfect match. Biol Lett 10: 20140562. [Google Scholar]
- Derbali A. 2024. Age, growth, mortality and population structure of Polititapes aureus (Mollusca: Bivalvia) in the Gulf of Gabes, Tunisia. Oceanol Hydrobiol Stud 53: 102–110. [Google Scholar]
- Derolez V. Approche dynamique et intégrée de l’évaluation d’un socio-écosystème côtier. Application à la lagune de Thau, son état écologique et ses bouquets de services écosystémiques sur la période 1970–2018. PhD thesis, Université de Montpellier, 2020, 281 pages. [Google Scholar]
- Drummond, A.J., Ashton, B., Cheung, M., Heled, J., Kearse, M., Moir, R., Stones-Hava, S., Thierer, T. and Wilson, A., 2009. Geneious v4.8. [software]. http://www.geneious.com [Google Scholar]
- FAO. 2021. FAO Yearbook. Fishery and Aquaculture Statistics 2019. [Google Scholar]
- Fasteris. 2025. Amplicon sequencing services. https://www.fasteris.com/en-us/NGS/DNA-sequencing/Amplicons-sequencing [Google Scholar]
- Fernandez S, Miller DL, Holman LE, Gittenberger A, Ardura A, Rius M, Mirimin L. 2021. Environmental DNA sampling protocols for the surveillance of marine non-indigenous species in Irish coastal waters. Mar Pollut Bull 172: 112893. [Google Scholar]
- Fiandrino A, Ouisse V, Dumas F, Lagarde F, Pete R, Malet N, Le Noc S, de Wit R. 2017. Spatial patterns in coastal lagoons related to the hydrodynamics of seawater intrusion. Mar Pollut Bull 119: 132–144. [Google Scholar]
- Ficetola GF, Coissac E, Zundel S, Riaz T, Shehzad W, Bessière J, Taberlet P, Pompanon F. 2010. An in silico approach for the evaluation of DNA barcodes. BMC Genomics 11: 434. [CrossRef] [PubMed] [Google Scholar]
- Ficetola GF, Miaud C, Pompanon F, Taberlet P. 2008. Species detection using environmental DNA from water samples. Biol Lett 4: 423–425. [Google Scholar]
- Foote AD, Thomsen PF, Sveegaard S, Wahlberg M, Kielgast J, Kyhn LA, Salling AB, Galatius A, Orlando L, Gilbert MTP. 2012. Investigating the potential use of environmental DNA for genetic monitoring of marine mammals. PLoS One 7: e41781. [CrossRef] [PubMed] [Google Scholar]
- Galan M, Razzauti M, Bard E, Bernard M, Brouat C, Charbonnel N, et al. 2016. 16S rRNA amplicon sequencing for epidemiological surveys of bacteria in wildlife. mSystems 1: e00032-16. [Google Scholar]
- Goldberg CS, Turner CR, Deiner K, Klymus KE, Thomsen PF, Murphy MA, et al. 2016. Critical considerations for the application of environmental DNA methods to detect aquatic species. Methods Ecol Evol 7: 1299–1307. [CrossRef] [Google Scholar]
- Hurtado NS, Pérez-García C, Morán P, Pasantes JJ. 2011. Genetic and cytological evidence of hybridization between native Ruditapes decussatus and introduced Ruditapes philippinarum in NW Spain. Aquaculture 311: 123–128. [Google Scholar]
- Inkscape Project. 2020. Inkscape v1.3.2 [software]. https://Inkscape.org [Google Scholar]
- Jaquier M, Albouy C, Bach W, Waldock C, Marques V, Maire E, et al. 2024. Environmental DNA recovers fish composition turnover of coral reefs of West Indian Ocean islands. Ecol Evol 14: e11337. [Google Scholar]
- Kandeel KE-S. 2018. Population dynamics of Venerupis aurea in two different clam beds in Lake Timsah, Suez Canal, Egypt. Thalassia Salentina 40: 67–94. [Google Scholar]
- Klymus KE, Marshall NT, Stepien CA. 2017. Environmental DNA metabarcoding assays to detect invasive invertebrate species in the Great Lakes. PLoS One 12: e0177643. [Google Scholar]
- Lagarde F, Fiandrino A, Ubertini M, d’Orbcastel ER, Mortreux S, Chiantella C, et al. 2019. Duality of trophic supply and hydrodynamic connectivity drives spatial patterns of Pacific oyster recruitment. Mar Ecol Prog Ser 632: 81–100. [Google Scholar]
- Lapègue S, Fortunato H, Bouvier C, Violette H, Cornette F, Bonin A, et al. 2025. Clam sequences from eDNA and tissue samples. https://doi.org/10.17882/105470 [Google Scholar]
- Leigh JW, Bryant D. 2015. Popart: full-feature software for haplotype network construction. Methods Ecol Evol 6: 1110–1116. [CrossRef] [Google Scholar]
- Le Fur I, de Wit R, Plus M, Oheix J, Derolez V, Simier M, et al. 2019. Re-oligotrophication trajectories of macrophyte assemblages in Mediterranean coastal lagoons based on 17-year time-series. Mar Ecol Prog Ser 608: 13–32. [Google Scholar]
- Leray M, Knowlton N, Machida RJ. 2022. MIDORI2: a collection of quality controlled, preformatted, and regularly updated reference databases for taxonomic assignment of eukaryotic mitochondrial sequences. Environ DNA 4: 894–907. [Google Scholar]
- Leray M, Yang JY, Meyer CP, Mills SC, Agudelo N, Ranwez V, et al. 2013. A new versatile primer set targeting a short fragment of the mitochondrial COI region for metabarcoding metazoan diversity: application for characterizing coral reef fish gut contents. Front Zool 10: 34. [CrossRef] [PubMed] [Google Scholar]
- Longmire J, Maltbie M, Baker RJ. 1997. Use of lysis buffer in DNA isolation and its implications for museum collections. Occasional Papers Museum of Texas Tech University, Vol. 163. https://doi.org/10.5962/bhl.title.143318 [Google Scholar]
- Mahé M, Aurelle D, Poggiale JC, Mayot N. 2022. Assessment of the distribution of Ruditapes spp. in northern Mediterranean sites using morphological and genetic data. J Molluscan Stud 88: eyac029. [Google Scholar]
- Mahé M, Delanghe D, Grisel R, Poggiale JC, Mayot N. 2020. Distribution of Manila clam Ruditapes philippinarum into Berre Lagoon according to the environmental condition. Vie Milieu 70: 269–277. [Google Scholar]
- Mahon AR, Jerde CL, Galaska M, Bergner JL, Chadderton WL, Lodge DM, et al. 2013. Validation of eDNA surveillance sensitivity for detection of Asian carps in controlled and field experiments. PLoS One 8: e58316. [Google Scholar]
- Maître-Allain T. Suivi d’un essai de repeuplement de palourdes dans l’étang de Thau (Hérault): croissance, mortalité, reproduction. PhD thesis, Université Paris 6, 1983, 136 pages. [Google Scholar]
- Marin MG, Moschino V, Deppieri M, Lucchetta L. 2003. Variations in gross biochemical composition, energy value and condition index of T. philippinarum from the Lagoon of Venice. Aquaculture 219: 859–871. [Google Scholar]
- Martin M. 2011. Cutadapt removes adapter sequences from high-throughput sequencing reads. EMBnet J 17: 10–12. [CrossRef] [Google Scholar]
- Nei M. Molecular Evolutionary Genetics. Columbia University Press, New York, 2019. https://doi.org/10.7312/nei-92038 [Google Scholar]
- Ogram A, Sayler GS, Barkay T. 1987. The extraction and purification of microbial DNA from sediments. J Microbiol Methods 7: 57–66. [Google Scholar]
- Olesen SW, Duvallet C, Alm EJ. 2017. dbOTU3: a new implementation of distribution-based OTU calling. PLoS One 12: e0176335. [Google Scholar]
- Passamonti M, Boore JL, Scali V. 2003. Molecular evolution and recombination in gender-associated mitochondrial DNAs of the Manila clam Tapes philippinarum. Genetics 164: 603–611. [Google Scholar]
- Passamonti M, Plazzi F. 2020. Doubly uniparental inheritance and beyond: the contribution of the Manila clam Ruditapes philippinarum. J Zool Syst Evol Res 58: 529–540. [Google Scholar]
- Patrissi M, Bernard I, Hugo F, Limonet J, Violette H, Sanchez F, Caill-Milly N, Bouvier C, Lapègue S, Holley JF, Lagarde F. 2023. Projet PALTEVA: diagnostic de l’état de la population de palourdes européennes (Ruditapes decussatus) dans la lagune de Thau. Suivi 2023. https://archimer.ifremer.fr/doc/00877/98910 [Google Scholar]
- Pilliod DS, Goldberg CS, Arkle RS, Waits LP. 2013. Estimating occupancy and abundance of stream amphibians using environmental DNA from filtered water samples. Can J Fish Aquat Sci 70: 1123–1130. [Google Scholar]
- Prié V, Puillandre N. 2014. Molecular phylogeny, taxonomy, and distribution of French Unio species. Hydrobiologia 735: 95–110. [Google Scholar]
- Prié V, Valentini A, Lopes-Lima M, Froufe E, Rocle M, Poulet N, Taberlet P, Dejean T. 2021. Environmental DNA metabarcoding for freshwater bivalves biodiversity assessment. Hydrobiologia 848: 2931–2950 [Google Scholar]
- R Core Team. 2023. R: A language and environment for statistical computing. R Foundation for Statistical Computing. [Google Scholar]
- Rees HC, Maddison BC, Middleditch DJ, Patmore JRM, Gough KC. 2014. The detection of aquatic animal species using environmental DNA − a review. J Appl Ecol 51: 1450–1459. [CrossRef] [Google Scholar]
- Riquet F, Sanchez F, Antajan E, Bru N, Caill-Milly N. 2026. The International Manila and European Clams Conference: Euro-Mediterranean overview and future directions to support sustainable clam fisheries. Aquat Living Resour 39: 4. [Google Scholar]
- Rourke ML, Fowler AM, Hughes JM, Broadhurst MK, DiBattista JD, Fielder S, et al.. 2022. Environmental DNA as a tool for assessing fish biomass: a review. Environ DNA 4: 9–33. [Google Scholar]
- Savini D, Occhipinti-Ambrogi A, Marchini A, Tricarico E, Gherardi F, Olenin S, et al. 2010. The top 27 animal alien species introduced into Europe for aquaculture and related activities. J Appl Ichthyol 26: 1–7. [Google Scholar]
- Schnell IB, Bohmann K, Gilbert MTP. 2015. Tag jumps illuminated – reducing sequence-to-sample misidentifications in metabarcoding studies. Mol Ecol Resour 15: 1289–1303. [CrossRef] [PubMed] [Google Scholar]
- Shi X, Jiang Y, Cao L, Zeng C. 2024. Development of environmental DNA metabarcoding primers for marine mollusks and comparison with published primers. BMC Ecol Evol 24: 73. [Google Scholar]
- Sigsgaard EE, Nielsen IB, Bach SS, Lorenzen ED, Robinson DP, Knudsen SW, et al. 2016. Population characteristics of a large whale shark aggregation inferred from seawater environmental DNA. Nat Ecol Evol 1: 1–5. [Google Scholar]
- Skibinski DOF, Gallagher C, Beynon CM. 1994. Sex-limited mitochondrial DNA transmission in the marine mussel Mytilus edulis. Genetics 138: 801–809. [Google Scholar]
- Taberlet P, Bonin A, Zinger L, Coissac E. Environmental DNA: For Biodiversity Research and Monitoring, Oxford University Press, 2018. https://doi.org/10.1093/oso/9780198767220.001.0001 [Google Scholar]
- Taberlet P, Coissac E, Hajibabaei M, Rieseberg LH. 2012. Environmental DNA. Mol Ecol 21: 1789–1793. [Google Scholar]
- Templeton AR, Crandall KA, Sing CF. 1992. A cladistic analysis of phenotypic associations with haplotypes inferred from restriction endonuclease mapping and DNA sequence data. III. Cladogram estimation. Genetics 132: 619–633. [Google Scholar]
- Valentini A, Taberlet P, Miaud C, Civade R, Herder J, Thomsen PF, et al. 2016. Next-generation monitoring of aquatic biodiversity using environmental DNA metabarcoding. Mol Ecol 25: 929–942. [CrossRef] [MathSciNet] [PubMed] [Google Scholar]
- Van Colen C, Ong EZ, Briffa M, Wethey DS, Abatih E, Moens T, et al. 2020. Clam feeding plasticity reduces herbivore vulnerability to ocean warming and acidification. Nat Clim Chang 10: 162–166. [Google Scholar]
- Velez C, Figueira E, Soares AMVM, Freitas R. 2017. Effects of seawater temperature increase on economically relevant native and introduced clam species. Mar Environ Res 123: 62–70. [Google Scholar]
- Wagih O. 2017. ggseqlogo: a versatile R package for drawing sequence logos. Bioinformatics 33: 3645–3647. [Google Scholar]
- Wares JP, Pappalardo P. 2016. Can theory improve the scope of quantitative metazoan metabarcoding? Diversity 8: 1. [Google Scholar]
- Xu T, He C, Han X, Kong L, Li Q. 2024. Comparative mitogenomic analysis and phylogeny of Veneridae with doubly uniparental inheritance. Open Biol 14: 240186. [Google Scholar]
- Yates MC, Fraser DJ, Derry AM. 2019. Meat-analysis supports further refinement of eDNA for monitoring aquatic species-specific abundance in nature. Environ DNA 1: 5–13. [CrossRef] [Google Scholar]
- Zinger L, Bonin A, Alsos IG, Bálint M, Bik H, Boyer F, et al. 2019. DNA metabarcoding – need for robust experimental designs to draw sound ecological conclusions. Mol Ecol 28: 1857–1862. [CrossRef] [PubMed] [Google Scholar]
- Zouros E, Oberhauser Ball A, Saavedra C, Freeman KR. 1994. An unusual type of mitochondrial DNA inheritance in the blue mussel Mytilus. Proc Natl Acad Sci USA 91: 7463–7467. [Google Scholar]
Cite this article as: Lapègue S, Fortunato H, Bouvier C, Violette H, Cornette F, Bonin A, Noël C, Lagarde F. 2026. Using Environmental DNA metabarcoding to detect clams in lagoons. Aquat. Living Resour. 39: 25. https://doi.org/10.1051/alr/2026016
All Tables
In silico taxonomic resolution of the Vene01 metabarcoding marker for the three studied species, as well as P. rhomboides and V. corrugata. ‘MOTUs’ refer to unique sequences, and ‘amplicons’ refer to occurrences of the MOTU(s) in GenBank.
All Figures
|
Fig. 1 In situ clam species detection. (A) Map of sampling locations in two Mediterranean lagoons with three different levels of clam abundance. (B) Clam species detection. The species are identified by a colour code: P. aureus in yellow, R. decussatus in green, and R. philippinarum in red. |
| In the text | |
|
Fig. 2 Experimental clam species detection. (A) Diagram of the experimental setup. The reconstituted communities are created in two replicates with different numbers of animals represented by coloured clams, and the remaining clams are grouped in aquariums AQ13 (n = 25) and AQ14 (n = 47). The two empty aquariums (AQ01 and AQ07) are filled with the same canal water as the other aquariums. (B) Relative abundance of the species detected in the different aquariums. The species are identified by a colour code: P. aureus in yellow, R. decussatus in green, and R. philippinarum in red. |
| In the text | |
|
Fig. 3 Comparison of Vene01 and COI Leray primers. Numbers of forward and reverse in silico mismatches of Vene01 primers with their target sequences in Venerida (A) and non-Venerida (B) species; numbers of forward and reverse in silico mismatches of the COI Leray primers with their target sequences in Venerida (C) and non-Venerida (D) species. Sequence logo representations of forward (E) and reverse (F) Vene01 primer conservation in Venerida and sequence logo representations of forward (G) and reverse (H) COI Leray primer conservation in Venerida. |
| In the text | |
|
Fig. 4 Correlation between the abundance of reads and biomass in the aquariums. |
| In the text | |
|
Fig. 5 Intraspecific diversity within the three clam species. (A) Relative abundance of the 14 clam haplotypes detected in the aquariums and in situ. (B) Haplotype networks of the three species. The haplotypes are identified by a colour gradient: P. aureus in yellow, R. decussatus in green, and R. philippinarum in red. The size of each circle is proportional to the number of reads of each haplotype found both in aquariums and in situ. |
| In the text | |
Current usage metrics show cumulative count of Article Views (full-text article views including HTML views, PDF and ePub downloads, according to the available data) and Abstracts Views on Vision4Press platform.
Data correspond to usage on the plateform after 2015. The current usage metrics is available 48-96 hours after online publication and is updated daily on week days.
Initial download of the metrics may take a while.