Fig. 3
Download original image
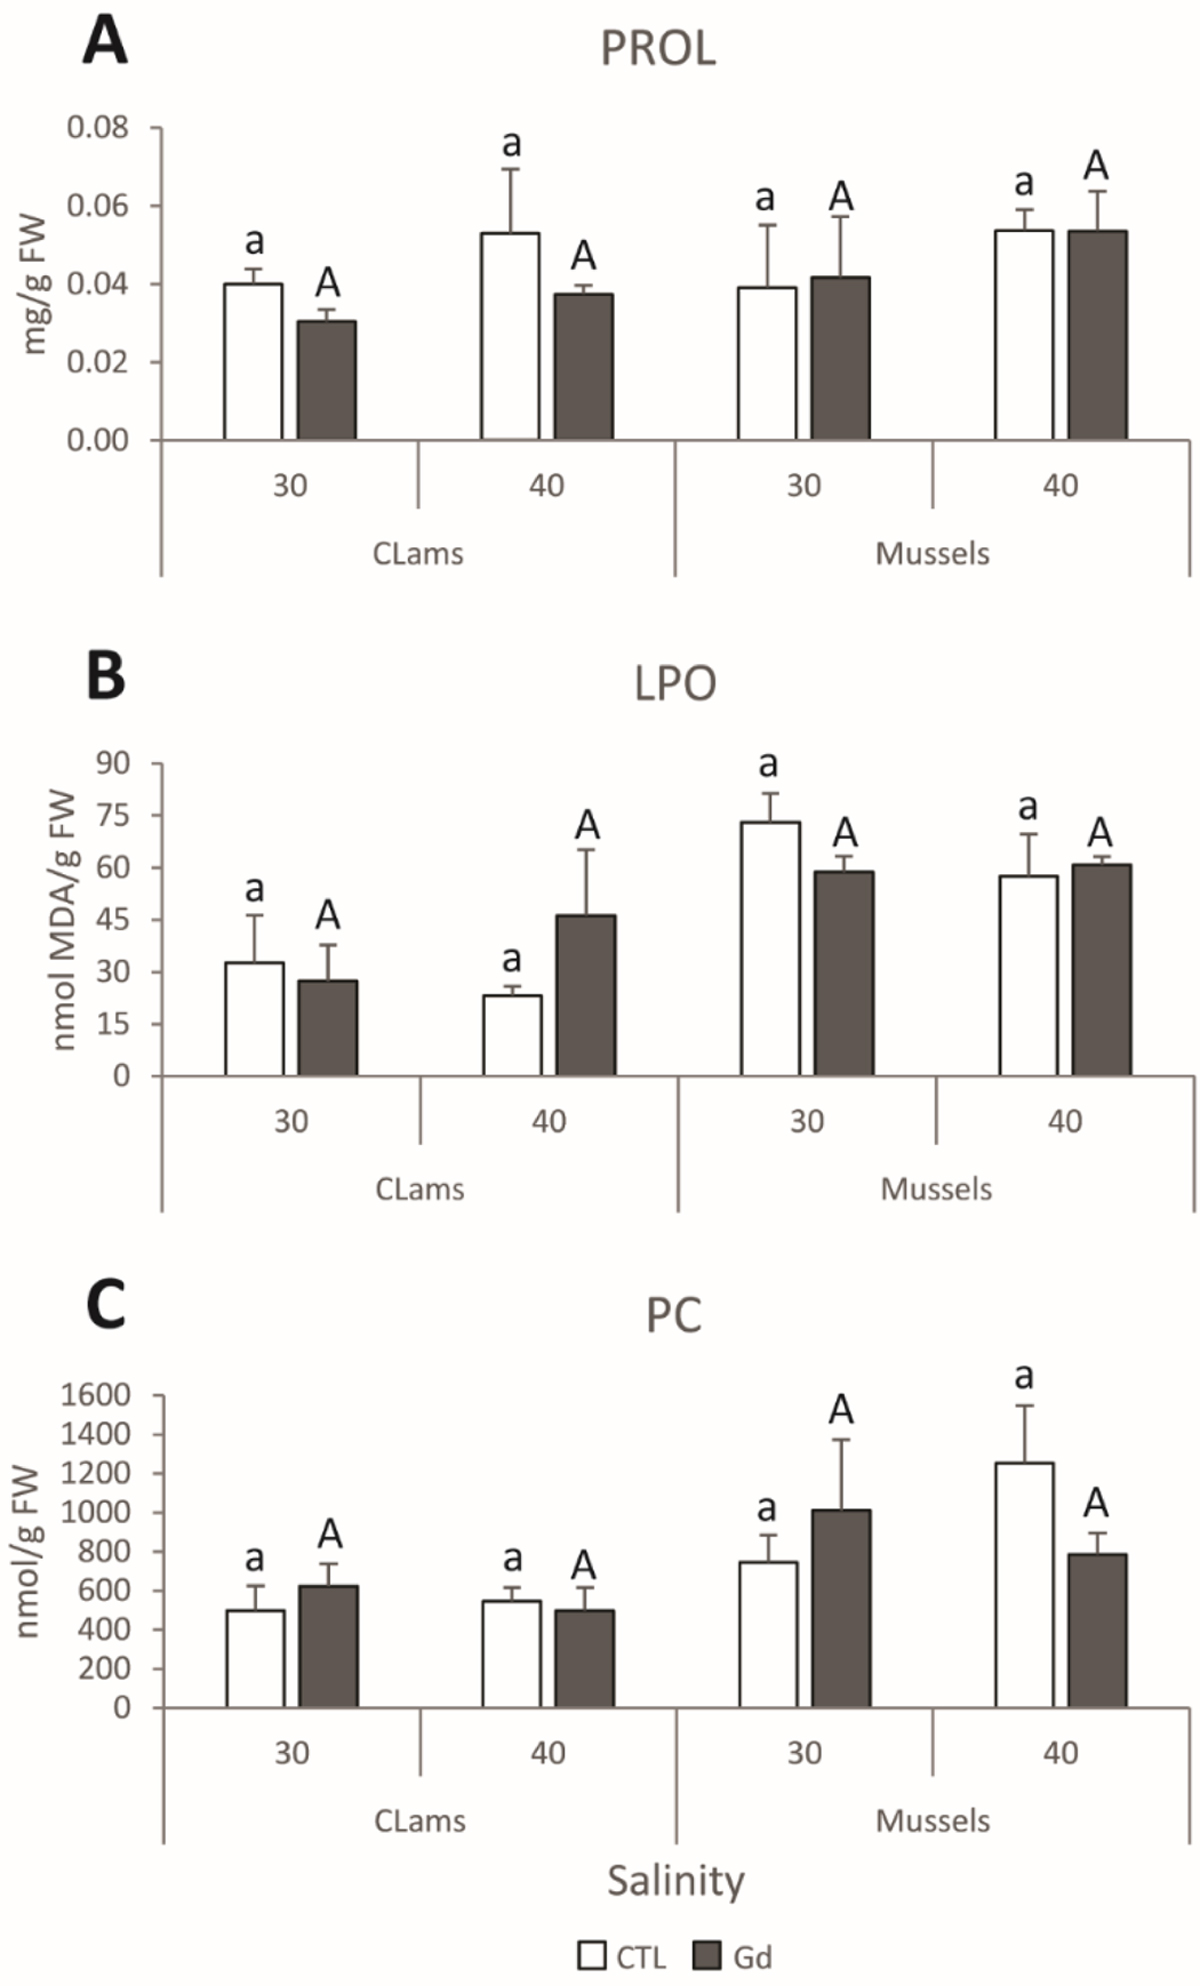
A: Proline (PROL) content; B: Lipid peroxidation (LPO) levels; C: Protein carbonylation (PC) levels, in clams and mussels exposed to 0 µg/L (CTL, white bars) and 10 µg/L of gadolinium (Gd, colored bars) at different salinity levels (30 and 40). Results are means with standard deviations. For each species, different lowercase letters represent significant differences (p < 0.05) between non‐exposed individuals; for each species, different uppercase letters represent significant differences (p < 0.05) between Gd‐exposed individuals; asterisks represent significant differences (p < 0.05) between Gd‐exposed and non‐exposed treatments.
Current usage metrics show cumulative count of Article Views (full-text article views including HTML views, PDF and ePub downloads, according to the available data) and Abstracts Views on Vision4Press platform.
Data correspond to usage on the plateform after 2015. The current usage metrics is available 48-96 hours after online publication and is updated daily on week days.
Initial download of the metrics may take a while.