Fig. 3
Download original image
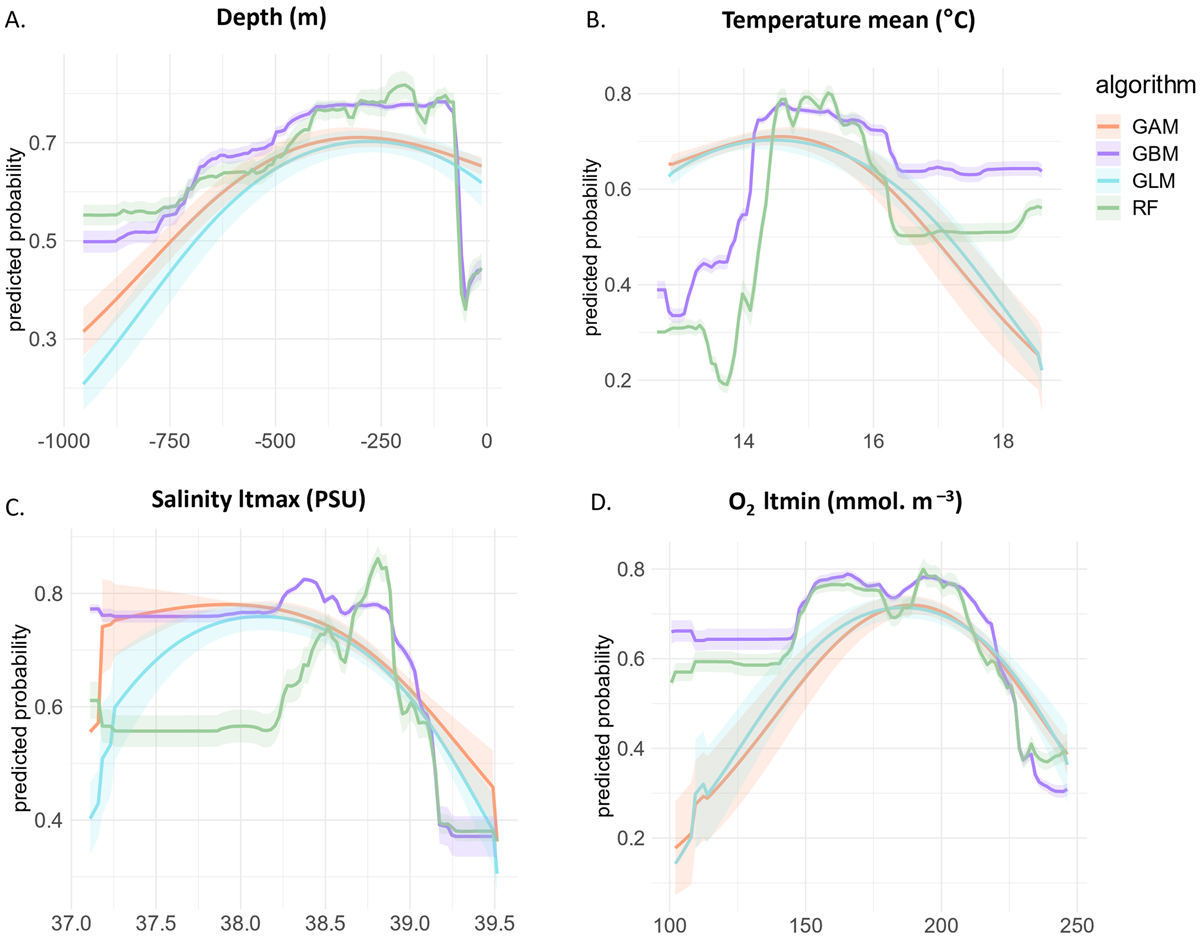
Response curves of the probability of presence of F. quadrangularis as a function of the different environmental predictors selected, coloured by algorithm: (A) depth, (B) mean bottom temperature, (C) long-term maximum bottom salinity, and (D) long-term minimum bottom oxygen. The solid line represents the mean response curve across individual models of each algorithm, with shaded areas indicating the 95% confidence interval.
Current usage metrics show cumulative count of Article Views (full-text article views including HTML views, PDF and ePub downloads, according to the available data) and Abstracts Views on Vision4Press platform.
Data correspond to usage on the plateform after 2015. The current usage metrics is available 48-96 hours after online publication and is updated daily on week days.
Initial download of the metrics may take a while.