Fig. 3
Download original image
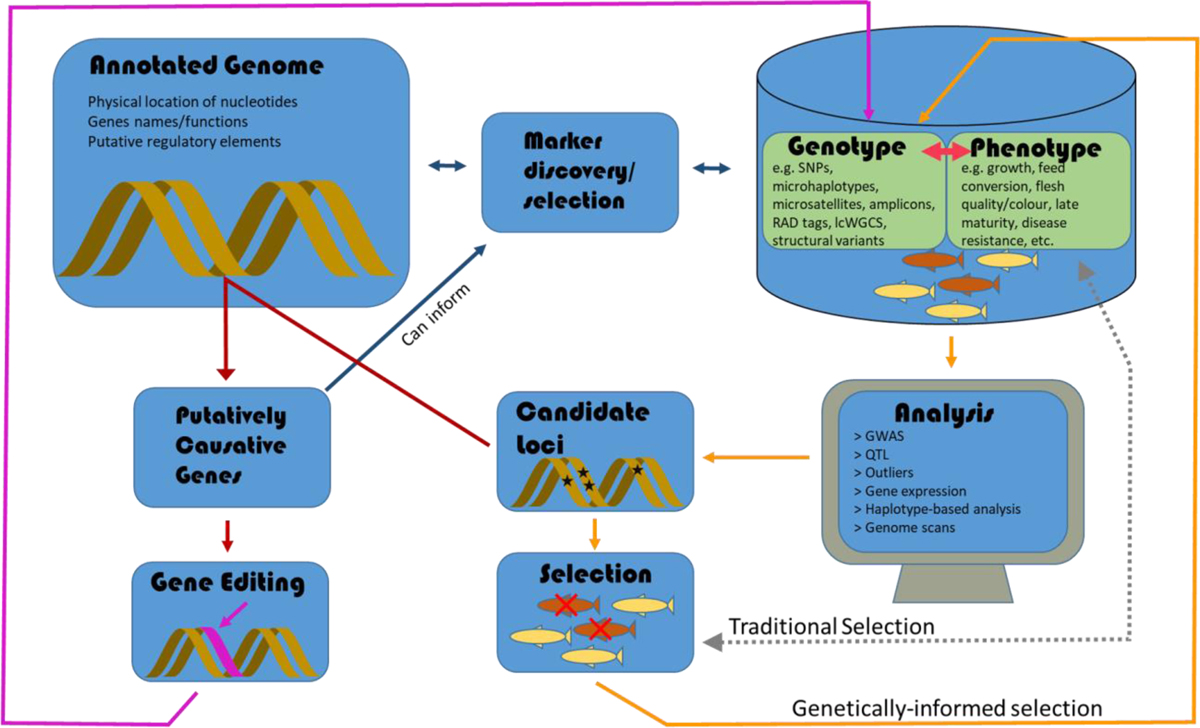
Schematic illustration of the utility of an annotated, whole genome in aquaculture or conservation breeding programs. Solid arrows represent directionality of information or activity with colours denoting common pathways. The grey dashed line, representing traditional selection, is included to reinforce that it operates primarily based on phenotypes and that it can occur while genomic tools are being developed.
Current usage metrics show cumulative count of Article Views (full-text article views including HTML views, PDF and ePub downloads, according to the available data) and Abstracts Views on Vision4Press platform.
Data correspond to usage on the plateform after 2015. The current usage metrics is available 48-96 hours after online publication and is updated daily on week days.
Initial download of the metrics may take a while.