Open Access
Fig. 7
Download original image
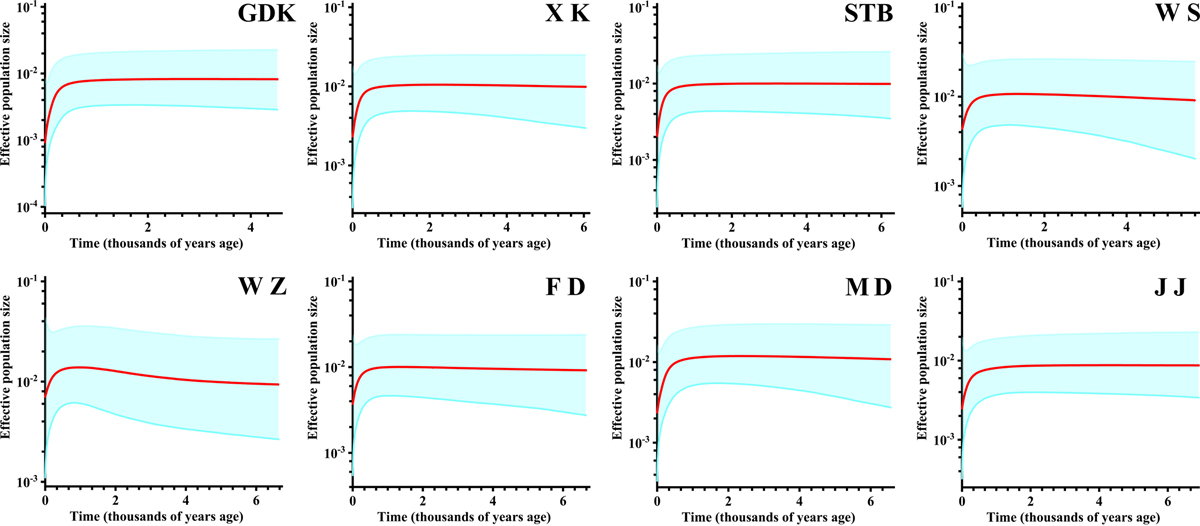
Bayesian skyline plot of the effective population sizes through time for M. nipponense population. The X axis is the time scale in units of thousands of years, and the Y axis is the estimated effective population size.
Current usage metrics show cumulative count of Article Views (full-text article views including HTML views, PDF and ePub downloads, according to the available data) and Abstracts Views on Vision4Press platform.
Data correspond to usage on the plateform after 2015. The current usage metrics is available 48-96 hours after online publication and is updated daily on week days.
Initial download of the metrics may take a while.