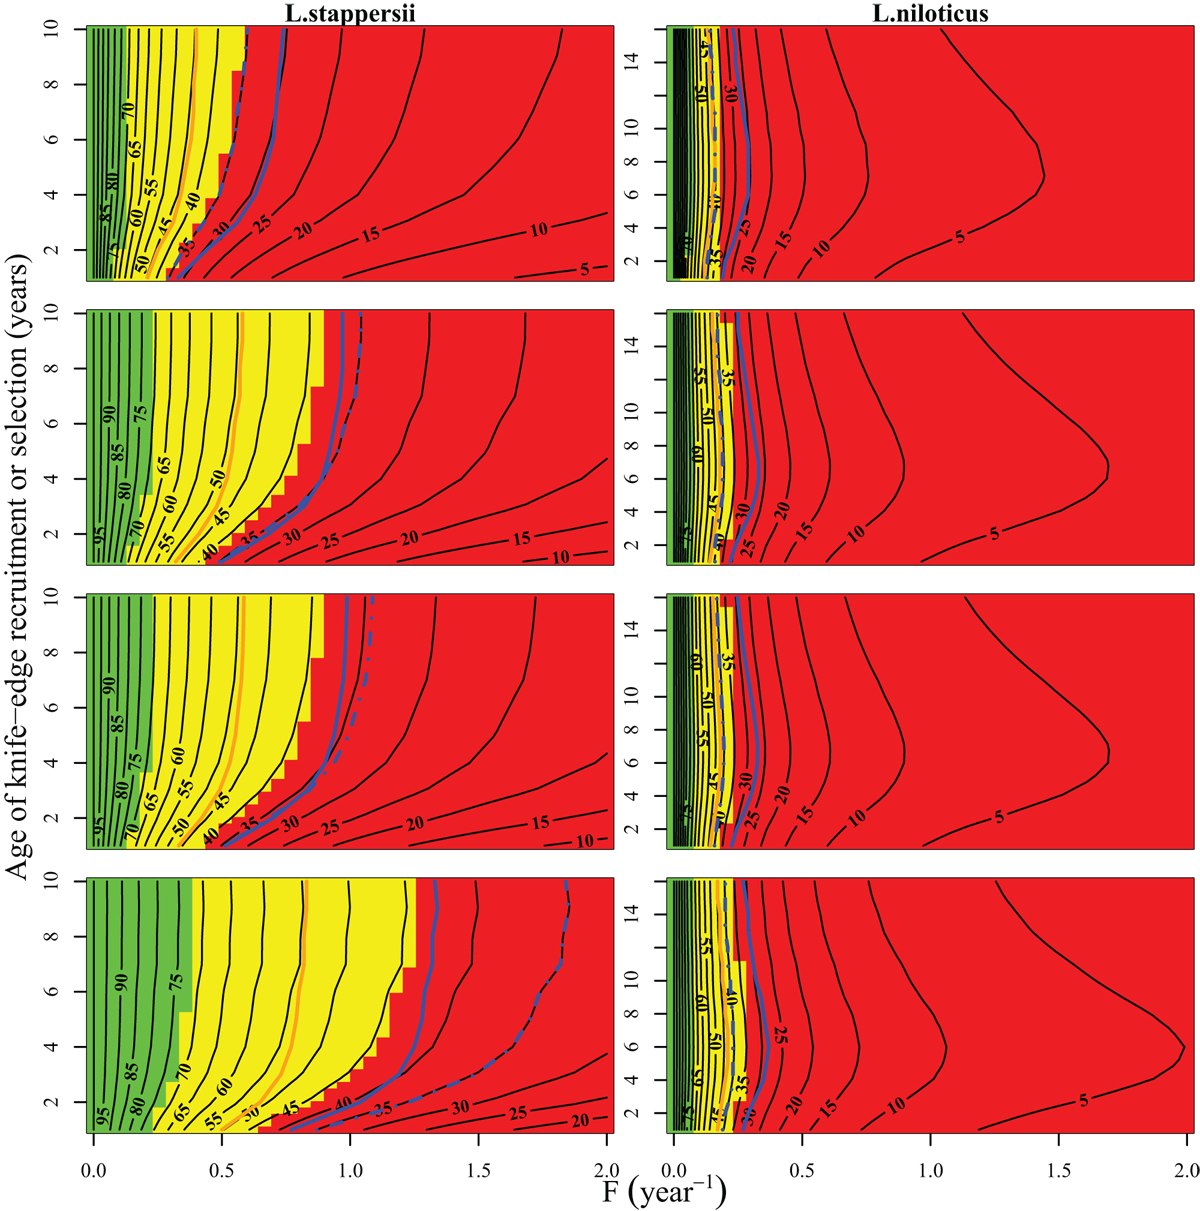
Fig. 5
Download original image
Isopleths of, from top to bottom, the 2.5% percentile, median, mean, and 97.5% percentile of CSPR involving a declining survivorship (%) as a function of fishing mortality (F) and the age of knife-edge recruitment or the age of knife-edge selection for L. stappersii in Lake Tanganyika (left panels) and L. niloticus in Lake Victoria (right panels). The plots also show the variations of the 2.5% percentile, median, mean, and 97.5% percentile of FCYPR (blue solid line), F0.1 (orange solid line), as well as F35%CSPR for L. stappersii and F40%CSPR for L. niloticus (blue dash-dotted line) against the age of knife-edge recruitment. Areas shaded by the red color, yellow color, and green color are, respectively, topographies of low CSPR, intermediate CSPR, and high CSPR. If FCYPR, F0.1, or F at a target CSPR is treated as the fishing mortality target, the region below and to the right of the corresponding lines represents recruitment-overfishing.
Current usage metrics show cumulative count of Article Views (full-text article views including HTML views, PDF and ePub downloads, according to the available data) and Abstracts Views on Vision4Press platform.
Data correspond to usage on the plateform after 2015. The current usage metrics is available 48-96 hours after online publication and is updated daily on week days.
Initial download of the metrics may take a while.