Fig. 3
Download original image
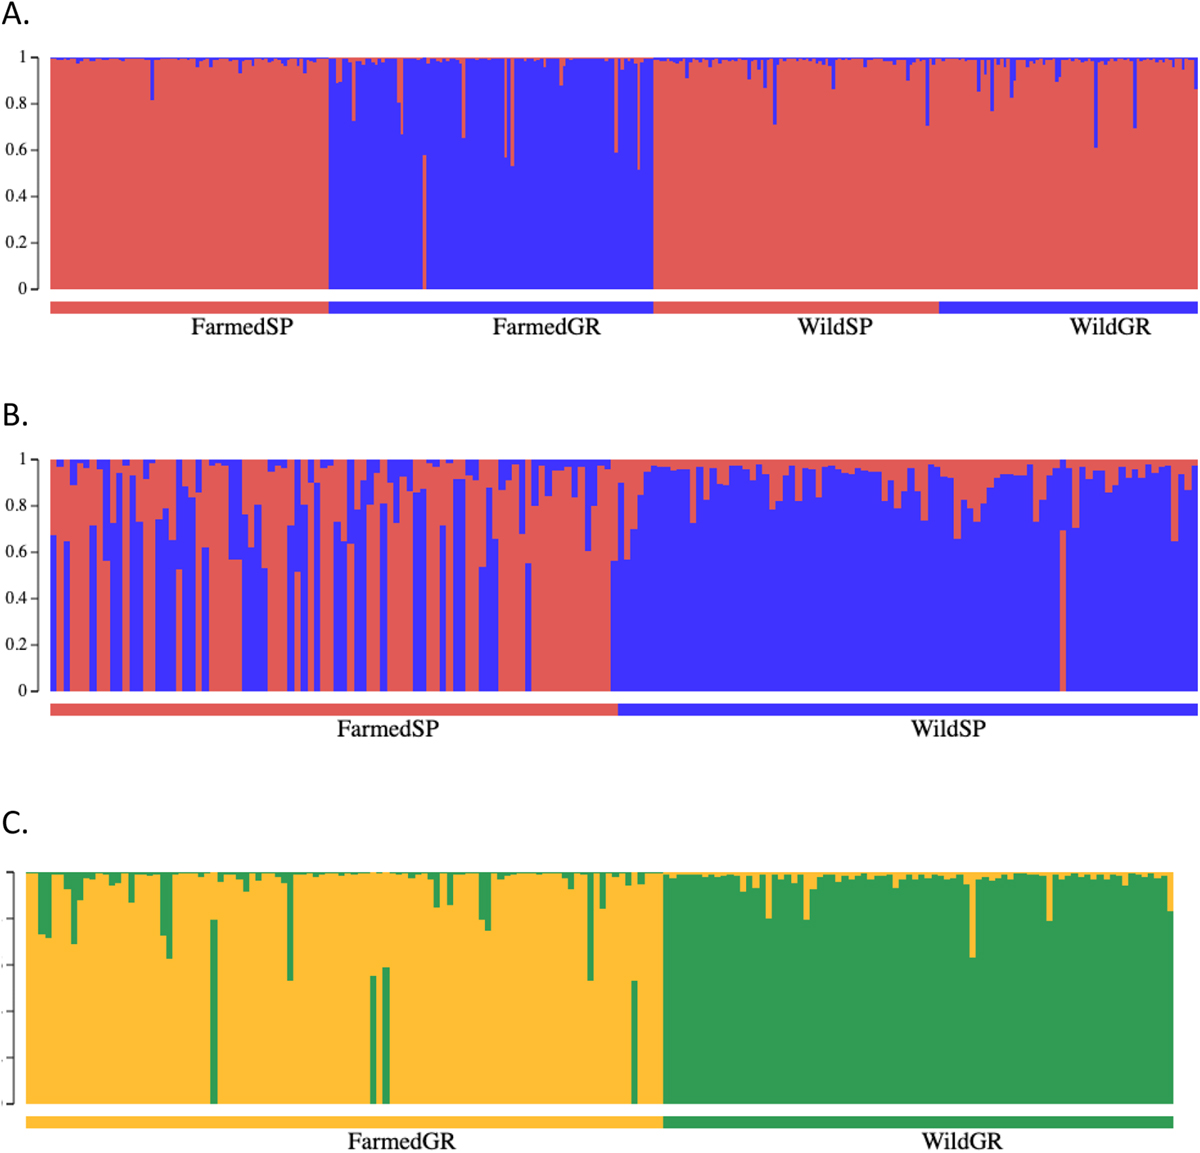
Bayesian clustering of S. aurata samples. A. All four samples form two clusters. B. Spanish samples. C. Greek samples. The different colors represent the groups that the program STRUCTURE has clustered the individuals. The length of the colored bar shows the probability that a specific individual belongs to the respective group. The length of the colored bars per individual adds up to 1.
Current usage metrics show cumulative count of Article Views (full-text article views including HTML views, PDF and ePub downloads, according to the available data) and Abstracts Views on Vision4Press platform.
Data correspond to usage on the plateform after 2015. The current usage metrics is available 48-96 hours after online publication and is updated daily on week days.
Initial download of the metrics may take a while.