Fig. 3
Download original image
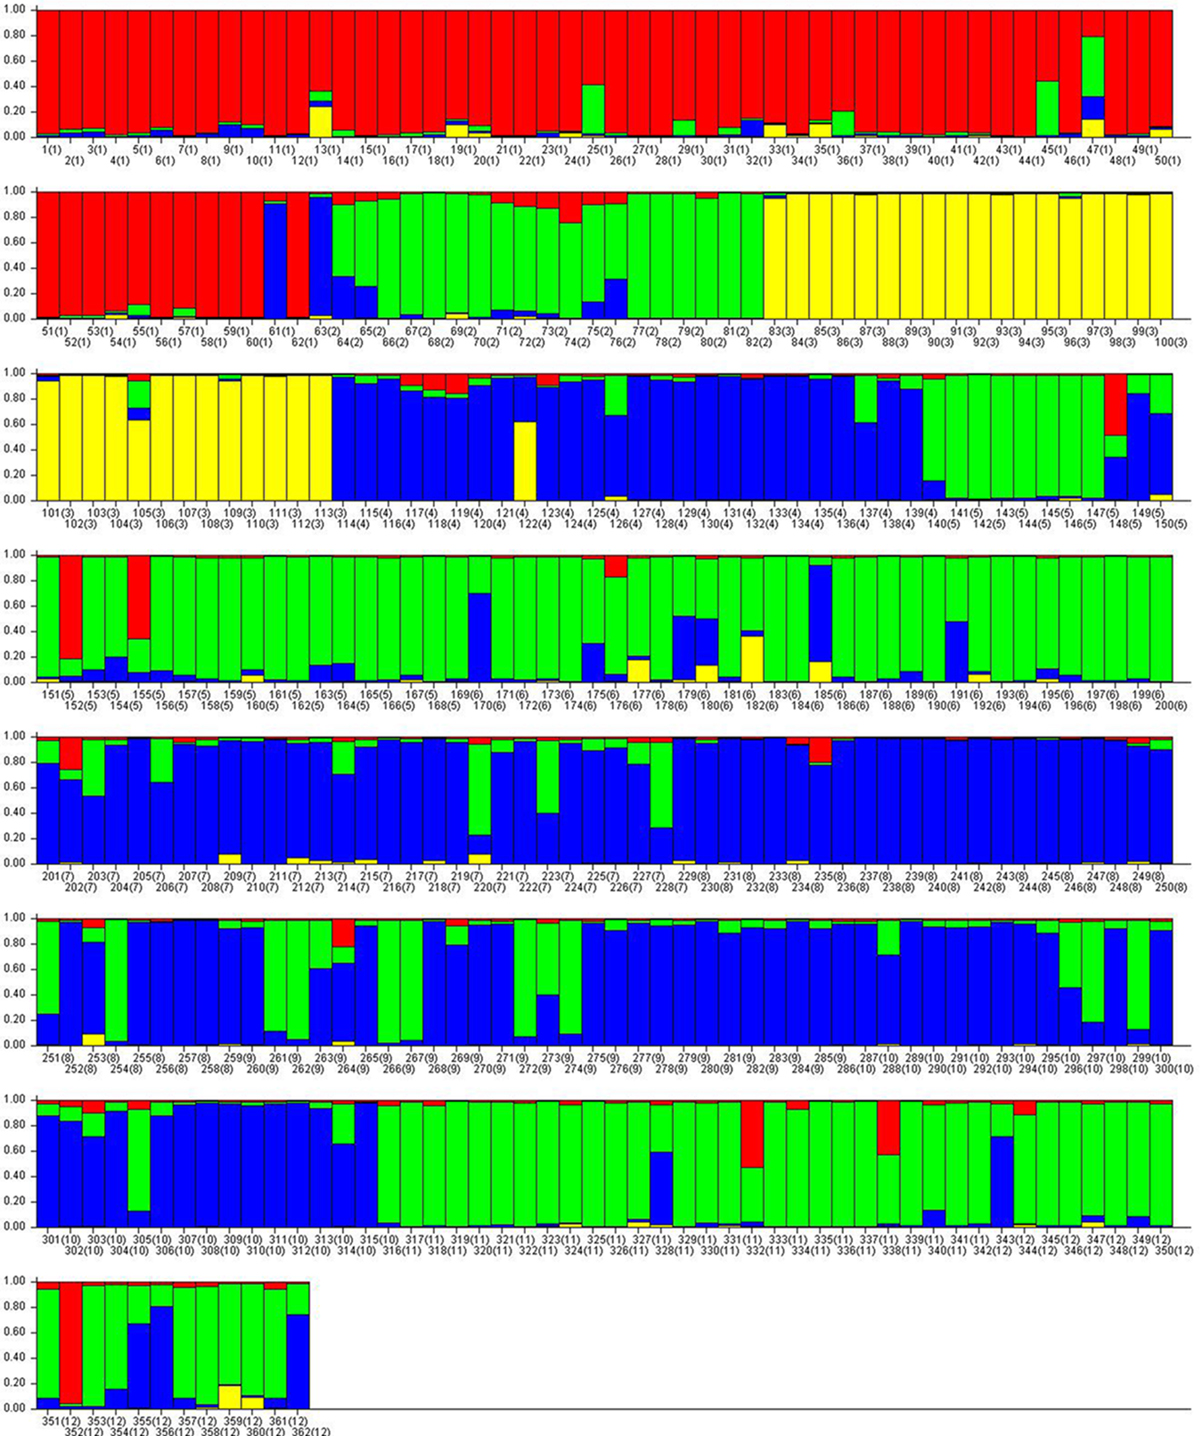
Bayesian Structure results showing the individual membership of the samples from 12 Romanian rivers populations (K = 4). Each individual is represented by a vertical line partitioned into segments according to the proportion of the genome assigned to each of the identified clusters. Vertical line-the membership coefficient (Q), horizontal line-individuals. The populations are grouped from east to west as follows: (1) − Uz, (2) − Oituz, (3) − Ucea, (4) − Cârțișoara, (5) − Porumbacu, (6) − Avrig, (7) − Topolog, (8) − Sebeșel, (9) − Bistra Mărului, (10) − Craiului, (11) − Bârzava, (12) − Caraș.
Current usage metrics show cumulative count of Article Views (full-text article views including HTML views, PDF and ePub downloads, according to the available data) and Abstracts Views on Vision4Press platform.
Data correspond to usage on the plateform after 2015. The current usage metrics is available 48-96 hours after online publication and is updated daily on week days.
Initial download of the metrics may take a while.