| Issue |
Aquat. Living Resour.
Volume 32, 2019
|
|
|---|---|---|
| Article Number | 22 | |
| Number of page(s) | 11 | |
| DOI | https://doi.org/10.1051/alr/2019020 | |
| Published online | 06 September 2019 | |
Research Article
Flat oyster fishery management during a time with fluctuating population size
Danish Shellfish Centre, National Institute of Aquatic Resources, Technical University of Denmark, Øroddevej 80, 7900 Nykøbing Mors, Denmark
* Corresponding author: This email address is being protected from spambots. You need JavaScript enabled to view it.
Handling Editor: Pauline Kamermans
Received:
20
March
2019
Accepted:
15
August
2019
Abstract
Wild populations of the native European flat oyster (Ostrea edulis) are nowadays rare. Worldwide, flat oyster populations have declined due to overexploitation, diseases and pollution. Yet, in the Limfjorden, Denmark, a small but persistent population of wild flat oyster have endured for more than 165 years, which has sustained a unique fishery on wild oyster beds. Over time, fluctuations in the wild population size has had implications for the fishery, alternating between a large population with high yields, and too small to withstand a fishery. The flat oyster fishery has been alleged to cause these unpredictable fluctuations in the population. However, the combined effect of natural variation (e.g. water temperature) and the fishery has not been investigated. Here we indicate that summer water temperature is an important factor causing fluctuations in the flat oyster population, thought to be due to its influence on recruitment success. Whereas the fishery often constitutes a minor part of the net oyster mortality. We found a positive correlation between summer water temperature and increased oyster landings ≥5 years later. Our results demonstrate the importance of adaptive management for the oyster fishery in the Limfjorden, which has ensured the survival of the flat oyster population, even when the oyster population has been low. These results highlight that management based on annual stock assessments, closed areas with brood stock, and dynamic annual total allowable catch, can ensure the persistence of an endangered oyster species and support a sustainable fishery.
Key words: Endangered species / sustainable fishery / population dynamics / temperature / recruitment
© P. Nielsen and J.K. Petersen, by EDP Sciences 2019
 This is an Open Access article distributed under the terms of the Creative Commons Attribution License (http://creativecommons.org/licenses/by/4.0), which permits unrestricted use, distribution, and reproduction in any medium, provided the original work is properly cited.
1 Introduction
For centuries the European native flat oyster (Ostrea edulis) has played a significant role in the fishing industries in Europe (Matthiessen, 2008). During the last 200 years the populations have declined. Disease, pollution, unsustainable fisheries and invasion of non-native species e.g. Pacific oysters (Crassostrea gigas) and common slipper shell (Crepidula fornicata), have led to population collapses (Sheail, 1986; Rothschild et al., 1994; Lenihan and Peterson, 1998; Ruesink et al., 2005; Laing et al., 2006; Lotze, 2007; Smyth et al., 2009; Beck et al., 2011; Long et al., 2017). Consequently, wild native oyster beds have been considered scarce in Europe since the 1950s (see e.g. Airoldi and Beck (2007) and references herein) and the few remaining native beds have generally been rated as “poor” or “functionally extinct”, defined as >90–99% lost (Beck et al., 2011). The global loss and degradation of oyster reefs has an effect on the ecosystem. As ecosystem engineers, oysters provide important ecosystem services e.g. water filtration, habitat provision and nitrogen cycling (Beck et al., 2011; Ermgassen et al., 2012; Grabowski et al., 2012; Kellogg et al., 2014; Lipcius et al., 2015; Vaughn and Hoellein, 2018). In recognition of their important function, several restoration projects have been initiated in Europe (Pogoda et al., 2019). The aim has been to re-establish native oyster reefs where they previously dominated the benthic community prior to collapse (Gercken and Schmidt, 2014; Sawusdee et al., 2015; Smyth et al., 2018; Kerckhof et al., 2018).
At present, the global oyster fisheries of native wild oyster are limited (Kirby, 2004; Beck et al., 2011; Airoldi and Beck, 2007). In 2009–2011 the total global landings of wild European oysters were less than 3000 metric tonnes (Gosling, 2015). In Europe, the fisheries for wild flat oysters occur in small, localised areas like Loch Ryan in Scotland (Eagling et al., 2015), Solent, Thames Estuary and River Fal (Long et al., 2017), small areas along the western and northern coasts of Ireland (Tully and Clarke, 2012) including Lough Foyle (Bromley et al., 2016) and the Limfjorden, Denmark. To prevent overexploitation, it has been necessary to strictly regulate the flat oyster fisheries. Furthermore, as the remaining fisheries of wild oyster populations are of great economic importance (Schrobback et al., 2014; Long et al., 2017), efficient management strategies are required to ensure sustainability (Gosling, 2015).
Historically, bivalve fisheries have been managed by volume restrictions, and through fisheries closures; in cases of declining populations (Kristensen, 1997, Kirby, 2004; Schrobback et al., 2014). However, it has not succeeded in preventing global overexploitation (Ruesink et al., 2005; Airoldi and Beck, 2007; Lotze, 2007; Beck et al., 2011; Wilberg et al., 2011; Ermgassen et al., 2012). Annual fluctuations in population size present a major challenge in fisheries management of wild oyster beds (Hart et al., 2011; Bromley et al., 2016). Fluctuations in population size occurs due to natural variations in environmental conditions. For example, recruitment and growth of the larval and adult life stages are influenced by abiotic factors e.g. temperature, salinity and substrate availability, as well as biotic factors e.g. food, predation, diseases, parasites and competition (Camp et al., 2015; Gosling, 2015). Thus, to safeguard oyster populations, even in years with poor recruitment, long-term management approaches are needed. Fundamental knowledge of the total population size, density and population structure are essential, and historic data on population size and landings would be advantageous parameters to include when defining sustainable management measures for the oyster fishery.
In the Limfjorden, Denmark, a wild population of native flat oysters have survived alongside the commercial fishery for almost 165 years. Although, high variability in yields (Kristensen, 1997) likely reflects fluctuations in the wild stock. Recently, new pressures add to the uncertainty of this economically important fishery located in a rural region of Denmark. Changes in community dynamics, caused by increased populations of competitors; C. gigas, predators; Ocinebrellus inornatus, and parasites; Bonamia ostreae (Anonymous, 2018) may contribute to the pressure on the flat oyster populations. As might climate change. Cumulatively, these pressures present an interesting challenge for researchers and managers.
The aim of this study is: (i) to review fluctuations in the oyster population and the management of the flat oyster fishery in the Limfjorden in view of its historic development. (ii) Determine the drivers causing fluctuations in the wild population i.e. the role of the commercial fishery, and differences in summer water temperature; and (iii) discuss the future of the flat oyster fishery in the Limfjorden based on the recent development in the flat oyster population and in view of new emerging treats.
2 Materials and methods
The Limfjorden (Fig. 1A) is a shallow sound that connects the North Sea on the west coast (32–34 PSU) with the Kattegat on the east coast (19–25 PSU). The surface area is approximately 1500 km2, and has a mean water depth of 5.5 m. The average water temperature is 2–3 °C in winter and 15–20 °C in summer. As a micro-tidal system, it has a tidal amplitude of 0.1–0.2 m. Eutrophic conditions result in high chlorophyll-a concentrations throughout the year, which supports a large biomass of benthic suspension feeders, dominated by the blue mussel, Mytilus edulis (Maar et al., 2010). Additionally, a native population of the flat oyster is found in the western part of the Limfjorden (Fig. 1B).
 |
Fig. 1 (A) Location of the Limfjorden, Denmark. (B) The surveyed areas included in the annual stock surveys in the Western part of the Limfjorden, where numbers refers to shellfish production areas and ★ = temperature monitoring station. |
2.1 Annual stock surveys and stock size estimation
The Limfjorden is divided into 37 shellfish productions areas (Fig. 1B) and in recent years, the flat oyster has been recorded, and fished, in production areas 1–9 and 11–13. Since 2004, the 12 production areas have been monitored during annual stock assessment, carried out by The National Institute for Aquatic Resources (DTU Aqua). The data collected is used to estimate the population size, and size distribution of flat oyster.
In 2004, shellfish production areas 1–9 and 11–13 were split into 258 squares of 0.5 × 0.5 km2 making 220 randomly allocated fixed sampling stations in areas where water depths >3 m (total surveyed area of over 320 km2). Although all of the 220 stations are included in the annual stock assessments, a minimum of 190 stations have been surveyed each year. A four minute haul was carried out at each station using a modified oyster dredge (with: 1 m, height: 25 cm, total maximum wet weight: 35 kg, wire length of 50–60 m) at a towing speed of 2.5–3.5 knots. The length of each dredge track was determined using GPS positions at the start and end of the tow. On board, the contents collected by the dredge was weighed to determine total wet weight (WW). Subsequently the catch was sorted and weighed, separating flat oysters, empty shells, stones and other invertebrates. Furthermore, the shell height was recorded for all oysters (or a maximum of 200 individuals) at each station. Shell height is measured as the maximal distance from the umbo to the margin of the shell.
The biomass of flat oysters (kg m−2) in each production area (1–9 and 11–13) was estimated using haul length, the total weight of flat oysters caught per haul (kg), total area of the production areas with water depth >3 m (km2) and applying a dredge efficiency of 33% for flat oysters (Dolmer and Hoffmann, 2004). To estimate the biomass of the entire flat oyster population (metric tonnes) in the western part of the Limfjorden, biomass estimates of each production area was summed together.
2.2 Landings and estimation of population size of target oysters
Cohort analysis of shell height was performed on the measured (shell height) oysters from the monitoring campaigns. Cohorts were separated by Bhattacharya's method using modal progression analysis software FiSAT II (FAO-ICLARM Fish Stock Assessment Tool). To estimate the proportion of target size oyster, the different flat oyster cohorts were converted into weight according to the following correlation between WW of flat oyster and shell height: where X is shell height (cm) of the flat oyster. The correlation is based on data from a supplementary survey conducted in 2011 throughout the Limfjorden, also covering areas in water depths less 3 m (unpublished data, DTU Aqua) to account for unfished areas. Based on the different cohorts and average weight of each cohort, the proportion of targeted flat oyster (>60 g for 2004–2005 and >80 g since 2006) and undersized flat oyster in the total population were estimated. Furthermore, the proportion of flat oysters preferred by the fishermen (60–175 g for 2004–2005 and 80–175 g for 2006-present) was estimated. The lower size limit is the minimum landing size regulated by the authorities, whereas the upper limit of 175 g reflects the lower price for oysters (above marked-size). Furthermore, it was assumed that it takes 3–4 years before one-year old oyster spats (<30 mm) observed in the annual stock surveys have reached a minimum landing size of 60–80 g (Richardson et al., 1993; Dolmer and Hoffmann, 2004). Annual landings of flat oysters were calculated based on the catch weight of flat oysters, which is reported to The Danish Fisheries Agency under the Foreign Ministry.
2.3 Mortality
The net mortality and the fishery mortality (landings) were estimated for each year and each fishing season, respectively. The net mortality was calculated based on two successive stock assessments, whereas the fishing mortality was estimated based on the landings reported for the equivalent fishing season. The net mortality of flat oyster (%) was calculated as: where SN
is the total flat oyster population size (metric tonnes) in year N and WN
is the average wet weight of flat oyster for the total population in year N. S
N+1 and W
N+1 are the total flat oyster population size (metric tonnes) and average wet weight for the total population in the following year, respectively.
where SN
is the total flat oyster population size (metric tonnes) in year N and WN
is the average wet weight of flat oyster for the total population in year N. S
N+1 and W
N+1 are the total flat oyster population size (metric tonnes) and average wet weight for the total population in the following year, respectively.
The mortality (%) caused by fishery (landings) of target flat oyster was calculated as: where LN
is the landings of flat oyster (metric tonnes) in fishing season N and WT
is the average wet weight of target flat oyster in year N. SN
is the total flat oyster population size (metric tonnes) in year N and WN
is the average wet weight of flat oyster for the total population in year N.
where LN
is the landings of flat oyster (metric tonnes) in fishing season N and WT
is the average wet weight of target flat oyster in year N. SN
is the total flat oyster population size (metric tonnes) in year N and WN
is the average wet weight of flat oyster for the total population in year N.
2.4 Temperature data
Data on water temperature for Nissum Broad were available from the national monitoring program NOVANA from 1982 to 2015 (★ in Fig. 1). Whereas the sea surface temperature (SST) dataset from the eastern part of the North Sea are available from 1900 to 2010 (The Climate Data Guide: SST data: HadiSST v1.1, National Center for Atmospheric Research Staff. https://climatedataguide.ucar.edu/climate-data/sst-data-hadisst-v11.). From 1982 to 2010 the two data sets are overlapping. In the period 1982 to 2010 the average annual summer temperature was calculated from June to August for both datasets (SST: n = 3 and NOVANA: n = 3–9). On average, the summer temperature in Nissum Broad is 3.2 °C higher than the SST in the North Sea. To estimate the average summer temperature in Nissum Broad from 1900 to 1981, a comparison of the variances was carried out on the two overlapping data sets (1982–2010). The residuals from the mean level in temperature were calculated for all observation months for both datasets and summed to annual values. The residuals for both datasets in the period 1982–2010 did not show significant differences in the variation in temperature between the two datasets (Linear regression analysis in Prism for Mac; slope: F (1,53) = 0.437, p = 0.512, intercept: F(1,54) = 3.07, p = 0.0885). The common equation (y = 0.01909x − 34.9) was used to convert the average summer SST in the North Sea to average summer temperature in Nissum Broad from 1900 to 1981.
2.5 Temperature and landings of oysters
The average summer temperature in Nissum Broad from 1900–2016 was compared with the landings of oysters. It is assumed that it will take at least five years before a successful recruitment will result in increased flat oyster landings (Richardson et al., 1993; Dolmer and Hoffmann, 2004). From 2004 and onwards the fishery has been regulated by annual TACs based on annual stock assessments. Hence, from 2004 to 2017, variations in the numbers of oysters landed are indirectly reflecting changes in the size of the oyster population. A correlation analysis was performed on average summer temperature in Nissum Broad from 1900–2016 and number of oysters landed five years later using the Pearson correlation analysis (GraphPad Prism for Mac).
3 Results
3.1 Historical oyster fisheries in the Limfjorden
The European flat oyster was a natural food source for the inhabitants surrounding the Limfjorden up until approximately 1200. However, when the opening to the North Sea at Agger Tange was blocked and the inflow of saline water was cut off, turning the Limfjorden into a brackish fjord for more than 600 years. In 1825, the North Sea once again broke through, re-establishing an inflow of saline water. As the salinity increased, the flat oysters were able to re-colonize. In the early 1850s the first record of commercial flat oyster landings was reported (Kristensen, 1997) and since, flat oysters have been exploited with varying intensity.
Thereafter, the fisheries landings increased to more than seven million in 1871–1872 (Fig. 2). To conserve the population, a large number of oyster seed were imported from European countries to supplement local population. However, with little success. The oyster fishery was either entirely closed, or restricted, between 1886 and the beginning of the 20th century due to overexploitation and lack of recruitment (Spärck, 1949). In 1910, the natural population had increased, and this was reflected in the landings, however, the import of oyster seeds from European countries continued to be a large part of the oyster population in the Limfjorden; e.g. in 1910–1925, 15 million seeds were imported and cultivated on culture plots to keep a high production (Kristensen, 1997) and the import of oysters continued until the beginning of the 1980s. Nonetheless, in 1982 the population reached its lowest record, and a total ban of fishing for flat oysters was enforced from 1982–1991 (Kristensen, 1997). From 1992 and the beginning of the millennium, flat oysters were only caught as bycatch in the traditional mussel fishery. As a result, less than 200,000 flat oysters were landed per year (Fig. 2). In the start of the new millennium, the flat oyster population increased, which led to a reopening of the flat oyster fishery in 2003. In the following years, the number of flat oyster landings increased, and reached more than 12,5 million in 2008; the highest ever landing recorded in Limfjorden (Fig. 2). However, in 2010 the flat oyster population decreased once again, and the total allowable catch (TAC) was accordingly regulated to ≤200 metric tonnes. The consequential total landings were approximately 1 million flat oysters per year from 2015 to 2017 (Fig. 2).
 |
Fig. 2 Harvest of European flat oysters (Ostrea edulis) in numbers (millions) from the Limfjorden from 1852 to 2017. |
3.2 Management of the oyster fishery in the Limfjorden
In 1587 the flat oysters in Denmark became a royal privilege, hence, the reigning monarch owned all oysters and only fishermen with a Royal Charter were allowed to fish oysters in Denmark. In 1849, the licencing was taken over by the Danish Government, but the oysters were still owned by the reigning monarch, ensuring the supply of oysters to the Danish Court. In 1983 the royal monopoly was annulled (Kristensen, 1997) and oysters became publicly owned.
With the Danish Government in charge of licencing, a more science-based management was introduced in 1849. Followed by the first biological investigation of the flat oyster population in the Limfjorden in the 1860s (see Kristensen, 1997 and references within). From the beginning of the 20th century, annual surveys were used to estimate the total standing stock, and to set sustainable fishing quantities (e.g. Petersen, 1907). The Danish Government initiated several other biological studies in the same period, investigating factors influencing spawning, larval settlement, and the nutritional status of oysters, as well as population densities, predation and mortality of the flat oyster (Spärck, 1925; 1929; 1935; 1949). However, scientific investigations ceased post 1940s, and during this time, no regular annual stock assessments were carried out until 2003. Since 2004, annual TACs have been set based on stock surveys carried out by DTU Aqua, which regulates the flat oyster fishery and in addition, a legal minimum size set at 60 g (80 g from 2006) was also enforced. After 2003 several adjustments and regulation initiatives have been implemented to ensure a sustainable flat oyster fishery but also to comply with different EU regulations. At present, the flat oyster fishery is regulated by using closed areas, minimum depths in which the fishery can occur (≥3 m), or temporal restrictions (closures; mid-May to October). Additionally, quotas are flexible and can be area-specific or set temporally (individual weekly and daily TACs). Restrictions can also be specific to the gear, for example lightweight dredge with a maximum total weight of 24 kg, or number of dredges per vessel (max 2). Furthermore, the number of vessels in each fishing area can be limited, and the requirement to have on-board sorting of catches, to ensure undersized oysters, shells, and debris are returned to the sea has be enforced. Furthermore, logbook reporting and installation of “black box” are mandatory. The black box registers the position of the vessel every 10 seconds, as well as the winch activity, thereby recording fishing activity. Black box data is used to estimate the area impacted by the fishery within each fishing season. A maximum of 15% areal cumulative impact over five years is accepted.
3.3 Flat oyster stock and landings 2004–2018
Since the initiation of annual stock assessments, it is clear that the standing stock fluctuates largely (Fig. 3). From 2006 to 2007 the population more than doubled (4300 t and 9900 t, respectively) and then remained constant around 10,000 t until 2010. Thereafter, the population decreased substantially, reaching a low of 1100 t in 2013. During 2014–2016 the flat oyster population was stable, increasing slowly to 2400 t in 2017. In 2018, the flat oyster population more than doubled to 6000 t, due to a successful settlement of flat oysters in Løgstør Broad (area 33, 34 and 36 in Fig. 1B).
In 2004–2008 the proportion of oyster at target size made up 28–83% of the total population size. In 2009, target sized oysters reached 98%. Generally, until 2017 targeted sized oysters constituted >90% of the total flat oyster population, but this fraction decreased to 40% in 2018 (Fig. 3).
Due to regulations set by annual TACs (Table 1) the annual flat oyster landings from 2004 to 2017 were relatively stable, which is in contrast to the large fluctuations in total population size, and the variation in target-sized oysters. The highest annual landings (1000–1350 t) were observed when the flat oyster population was at its maximum (2007 to 2010), where the TAC corresponded to 11–14% of the total population. Comparatively, the same TAC corresponded to 25% of total oyster population in 2005–2006. A smaller population size resulted in lower TACs for the flat oyster fishery with annual landings <200 t from 2013 to 2017 (corresponding to <11% of the total population). In 2018, a TAC of 400 t has been allocated for the 2018/2019 fishing season due to the doubling of the population size in 2018, which corresponds to 7% of the total population.
 |
Fig. 3 The annual flat oyster (Ostrea edulis) population size, landings and estimated proportion of target oysters (60 g in 2005 and >80 g since 2006) during 2004–2018 in the Limfjorden, Denmark. |
Total flat population data (tons) from 2004 to 2018 and total allowable catch (TAC) in tons and as percentage of total population.
3.4 Population structure
The cohort analysis showed that from 2004 to 2006 new recruits (<50 mm) were observed in the annual surveys. Yet, in the period 2007–2012, the population consisted mainly of one to two cohorts (Fig. 4) that grow into larger size-classes from year to year. In 2004, the proportion of small oysters (< minimum legal size) dominated (78%) the population caught in the annual population survey (Fig. 5) and declined to less than 10% in 2010. In contrast, the large oysters (> preferred marked-size) increased and constituted >35% of the oysters caught in the 2010 survey. The proportion of targeted oysters has been relatively stable and constituted 45–65% of the flat oyster caught in the annual surveys from 2005 to 2018. Changes in the proportion of non-targeted flat oysters (small and large) has shifted from being dominated by >30% of smaller oysters until 2009, whereas larger oysters dominated (>30%) until 2014 (Fig. 5). This is likely due to the large number of successful recruits in 2004–2006, which have grown into larger size classes. The increase in the proportion of small oysters suggest recent recruits in 2014 to 2018.
Indications of an aging population were also reflected in the increase in mean individual weight from 48 g in 2004 to 182 g in 2011 and from 100 g to 175 g (2010) for the target flat oysters (Fig. 6). From 2011, the mean individual weight of the total flat oyster population and the proportion of target oyster generally decreased, and in 2017 the mean individual weight was 128 g and 108 g, respectively, which corresponded with observations of general decline in the proportion of large oysters and increased recruitments since 2014 (Fig. 5). In 2018 the average individual weight of both the total flat oyster population and the target flat oyster proportion was approximately 160 g, which was the double of marked-sized oysters (80 g) providing the highest prices.
 |
Fig. 4 Size distribution of oysters (Ostrea edulis) in the annual stock surveys done from 2004 to 2018 in the Limfjorden, Denmark. The vertical dotted lines indicate the estimated shell height corresponding to the minimum landing size of 60 g for 2004–2005 and 80 g for 2006–2018. Note: different Y-scale on the 2004 plot. |
 |
Fig. 5 Population structure of oysters (Ostrea edulis) caught in the annual population surveys. Data are presented as the percentage in each shell height size category of pooled data for all sites in surveys carried out 2004–2018. Black bars: small oysters below minimal legal size; Light grey bars: targeted oysters above minimal legal size and below preferred marked-size; Dark grey bars: large oysters above preferred marked size (see text for more details). |
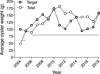 |
Fig. 6 The estimated average individual weight (g) for the total oyster (Ostrea edulis) population and target oysters (60–175 g in 2004–2005 and 80–175 g in 2006–2018). The horizontal dotted lines indicate the minimum landing sizes (60 or 80 g) of O. edulis for the given years. Data are from the annual stock surveys done in 2004–2018 in the Limfjorden, Denmark. |
3.5 Mortality
From 2004 to 2017, the fishery related mortality (landings) of flat oyster has constituted a smaller part of the net mortality (Fig. 7), whereas in the fishing seasons 2007/08, 2008/09 and 2011/12, which corresponded to seasons with the highest TACs (Fig. 3), fisheries constituted up to 73% of the total net mortality in the three fishing seasons. In the fishing seasons 2004/05, 2009/10, 2010/11 and 2012/13, the natural mortality was 54–79% higher than the mortality caused by fishery (Fig. 7). No net mortality was observed in the fishing seasons 2005/06, 2006/07, 2013/14, 2014/15, 2015/16 and 2016/17, since the recruitment of flat oyster (negative values in Fig. 7) exceeded the total mortality.
 |
Fig. 7 The annual total net mortality incl. fishery (black bars) and fishery related mortality (grey bars) of flat oysters (Ostrea edulis) within each fishing season from 2004 to 2017. Negative values of total net mortality indicate that recruitments were larger than total net mortality. |
3.6 Summer sea surface temperature
Increased summer temperature in Nissum Broad correlates positively (r = 0.449, P < 0.05) to landings of flat oysters five years later (Fig. 8). Furthermore, the progressive increase in the flat oyster population from 2005 to 2010 occurred after several warm summers with average water temperatures >15 °C from 2001 to 2010 (data not shown).
 |
Fig. 8 Average estimated summer temperature (June-August) in Nissum Broad 1900 to 2016 as a function of number of flat oysters (Ostrea edulis) landed five years after. |
4 Discussion
The overexploitation of oysters has previously been a problem in the Limfjorden. However, since the implementation of stock assessment driven TACs, the oyster population has been successfully sustained, despite large variations in stock size. Fluctuations in the flat oyster population due to variation in summer temperature can be accounted for, as oyster landings are positively correlated with summer temperature five years previous. Thus, a fishery on an endangered species can be managed without threatening the population.
The flat oyster fishery has been an important resource in the Limfjorden and still constitute an important income for the fishermen in a rural area of Denmark. The fluctuations observed in the flat oyster population in the Limfjorden (Fig. 2) during the twentieth century is also documented other parts of the world (Rothschild et al., 1994; Kirby, 2004; Ruesink et al., 2005; Airoldi and Beck, 2007; Lotze, 2007; Smyth et al., 2009; White et al., 2009; Beck et al., 2011; Ermgassen et al., 2012; Eagling et al., 2015). The large fluctuations indicate overexploitation, and the potential to collapse. However, unlike most other flat oyster populations in Europe, the wild flat oyster population in the Limfjorden was not infected by the parasites Bonamia sp. and Marteilia refringens in 1970–1980 (Madsen et al., 2013), where most other European flat oyster populations were dramatically affected by infections.
The annual surveys from 2004–2018 demonstrate fluctuations in the flat oyster population. The increase in flat oyster population from 2004–2007 was probably a result of several successful recruitments from 2000 to 2005 (Fig. 4). This corresponds to findings by Spärck (1935) and Hart et al. (2011), who also observed significant increase in biomass (metric tons) and a shift towards greater proportions of larger individuals in the oyster population after several successful recruitment events. The changes in the flat oyster population from 2004 to 2018 reflect the interactions between recruitment, population growth dynamics, and fisheries impact. Fishing mortality (landings) in most years constituted a minor part of the total net mortality (Fig. 7). In contrast, natural mortality ranged between 5–50%, which is in accordance with previous observations (20–70%, Spärck, 1929). Unregulated, the fishery induced mortality can indirectly influence the population dynamics, by skewing the populations size structure to be dominated by larger individuals when successful recruitments are erratic (Kirby, 2004). Furthermore, fishing mortality can affect the population dynamics a general reduction of the spawning stock, especially in years where fishing mortality is the major part of the total net flat oyster mortality. Continuing to exploit a declining, aging population of flat oyster may seem contradictory, and without adaptive management, it could have led to the total closure of the fishery. Certain management strategies were influential in the success of the fishery. For example, the regulations to increase minimum legal size from 60 g to 80 g to ensure a larger portion of spawning adults, implementation of spatial and temporal sanctuaries to ensure a brood stock for spawning, and the implementation of the “black box system” that has ensured monitoring and documentation of the fishery activities. Thus, all management implementations have contributed to, and ensured, the sustainable exploitation of the flat oyster even when the flat oyster population was decreasing.
Temporal variations in settlement of flat oysters have previously been documented in other oyster populations (Orton, 1927; Hart et al., 2011; Wilberg et al., 2011) and are often influenced by temperature. Warmer water temperature have positive effects on both the reproductive output, and the physical environment where larvae and settling juveniles are living (Spärck, 1925; Orton, 1927; Spärck, 1949; Hart et al., 2011) and several successive warm summers have induced larger spat fall of flat oysters in the Limfjorden (Spärck, 1935, 1949). In accordance, a positive correlation between summer temperature and oyster landings five years after was demonstrated (Fig. 8). Furthermore, oyster population doubled from 2017 to 2018 (Fig. 3) after a period (2013–2018) where annual average summer bottom water temperature in Nissum Broad was >16 °C. Especially 2014 was extreme, as the average water temperature reached 19.6 °C from mid-June to mid-August (data not shown). These results indicate that successful spawning of flat oysters in the Limfjorden is linked to summer temperature, which is in accordance with other studies (Orton, 1927; Spärck, 1949; Bromley et al., 2016). Additionally, we highlight that landings data, as a proxy for successful recruitment, might be prone to bias by factors like regulations (e.g. TAC, minimum legal size, spatial and temporal closures, and number of licenses), but also market demand and prices will affect the total landings (Lipton, 2008).
The future perspective for the flat oyster population in Limfjorden is promising with the increasing population and several successful spat falls within the last six years. However, several new emerging threats for the flat oyster population have appeared in the Limfjorden in recent years. The parasite, Bonamia ostreae was observed in flat oysters from aquaculture facilities in the Limfjorden collected in 2014, whereas observations of the parasite in wild flat oysters were first reported a few years later (Anonymous, 2018). The observation of B. ostreae has so far not resulted in mass mortality in neither aquaculture facilities nor wild beds in the Limfjorden (observations by DTU Aqua). However, the detection of B. ostreae has indirectly increased the risk of introduction of alien species, diseases and parasites harmful to the native flat oyster, since the Limfjorden lost its status as an area free of Bonamia in 2016, hence import of bivalves to the Limfjorden is now allowed.
Another potential threat is the invasive Pacific oyster (C. gigas), which within the last ten years has invaded the entire Limfjorden. C. gigas are especially common in shallow waters (0.5–2 m) but are also caught in depths >3 m (by-catch in the mussel and flat oyster fisheries). The co-occurrence of flat and Pacific oysters have recently been reported in other countries in Europe (Laugen et al., 2015; Christianen et al., 2018; Zwerschke et al., 2018a), and both positive and negative effects on the native flat oyster have been reported (Laugen et al., 2015; Green et al., 2017; Christianen et al., 2018; Zwerschke et al., 2018b).
Finally, changes in the distribution and/or densities of predators and competitors e.g. the predatory oyster drill (Ocinebrellus inornatus), the common starfish (Asteria rubens), the slipper limpet (Crepidula fornicate) and the parasitic copepod (Mytilicola intestinalis) in sub-areas or in the entire Limfjorden have been observed within the last couples of years (observations by DTU Aqua). Thus, several new emerging factors will influence future survival of the flat oyster population in the Limfjorden and the flat oyster fishery.
5 Conclusion
The persistence of the European flat oyster fishery in the Limfjorden may be attributed to a series of fortunate events, combined with well-timed adaptive management. First of all, the flat oyster population in the Limfjorden was not infected by the two parasites; Bonamia sp. and M. refringens in 1970–1980, when most flat oyster populations in Europe got infected. The observation of Bonamia sp. in European waters resulted in a total import ban of oysters to the Limfjorden and furthermore the flat oyster fishery was closed from 1982–1991 due to low population size. The closure of the fishery and the import ban most likely ensured the survival of the native flat oyster. Upon re-opening in the 1990s, the fishery was subjected to restrictions, and followed by adaptive management. Testament to the importance of management is that throughout time the focus has remained on sustaining the flat oyster. The outcome may have been less positive had another commercially valuable species become of interest, leading to improper management of the native flat oyster population (White et al., 2009). Although the population appears to be stable, the flat oyster population is not in the all clear, with the emergence of new threats in recent years. Thus, continuing a holistic and precautionary approach to fishery management is required, to improve the prospect of survival for the native flat oyster, and the future of a sustainable fishery.
References
- Airoldi L, Beck MW. 2007. Loss, status and trends for coastal marine habitats of Europe. Oceanogr Mar Biol 45: 345–405. [Google Scholar]
- Anonymous. 2018. Animal Health in Denmark 2017. Ministry of Environment and Food of Denmark. Danish Veterinary and Food Administration. [Google Scholar]
- Beck MW, Brumbaugh RD, Airoldi L, Carranza A, Coen LD, Crawford C, Defeo O, Edgar GJ, Hancock B, Kay MC, Lenihan HS, Luckenbach MW, Toropova CL, Zhang G, Guo X. 2011. Oyster reefs at risk and recommendations for conservation, restoration, and management. Bioscience 61: 107–116. [Google Scholar]
- Bromley C, McGonigle C, Ashton EC, Roberts D. 2016. Bad moves: pros and cons of moving oysters − a case study of global translocations of Ostrea edulis Linnaeus, 1758 (Mollusca: Bivalvia). Ocean Coast Manag 122: 103–115. [Google Scholar]
- Camp EV, Pine WEI, Havens K, Kane AS, Walters CJ, Irani T, Lindsey AB, Morris JGJ. 2015. Collapse of a historic oyster fishery: diagnosing causes and identifying paths toward increased resilience. Ecol Soc 20: 45. [Google Scholar]
- Christianen MJA, Lengkeek W, Bergsma JH, Coolen JWP, Didderen K, Dorenbosch M, Driessen FMF, Kamermans P, Reuchlin-Hugenholtz E, Sas H, Smaal A, van den Wijngaard KA, van der Have T. 2018. Return of the native facilitated by the invasive? Population composition, substrate preferences and epibenthic species richness of a recently discovered shellfish reef with native European flat oysters (Ostrea edulis) in the North Sea. Mar Biol Res 14: 590–597. [CrossRef] [Google Scholar]
- Dolmer P, Hoffmann E. 2004. Østersfiskeriet i Limfjorden − sammenligning af redskaber DFU report no. 136–04 (In Danish). [Google Scholar]
- Eagling LE, Ashton EC, Eagle J. 2015. The incentives of a resource owner: Evidence from a private oyster fishery. Mar Policy 58: 28–35. [Google Scholar]
- Ermgassen PSEZ, Spalding MD, Blake B, Coen LD, Dumbauld B, Geiger S, Grabowski JH, Grizzle R, Luckenbach M, McGraw K, Rodney W, Ruesink J, Powers SP, Brumbaugh R. 2012. Historical ecology with real numbers: past and present extent and biomass of an imperilled estuarine habitat. Proc R Soc B 279: 3393–3400. [CrossRef] [Google Scholar]
- Gercken J, Schmidt A. 2014. Current Status of the European Oyster (Ostrea edulis) and Possibilities for Restoration in the German North Sea. Bundesamt für Naturschutz. [Google Scholar]
- Gosling E. 2015. Marine Bivalve Molluscs. 2nd edn. Hoboken: Wiley-Blackwell, p. 258. [Google Scholar]
- Grabowski JH, Brumbaugh RD, Conrad RF, Keeler AG, Opaluch JJ, Peterson CH, Piehler MF, Powers SP, Smyth AR. 2012. Economic valuation of ecosystem services provided by Oyster Reefs. Bioscience 62: 900–909. [Google Scholar]
- Green DS, Christie H, Pratt N, Boots B, Godbold JA, Solan M, Hauton C. 2017. Competitive interactions moderate the effects of elevated temperature and atmospheric CO2 on the health and functioning of oysters. Mar Ecol Prog Ser 582: 93–103. [Google Scholar]
- Hart AM, Thomson AW, Murphy D. 2011. Environmental influences on stock abundance and fishing power in the silver-lipped pearl oyster fishery. Ices J Mar Sci 68: 444–453. [Google Scholar]
- Kellogg ML, Smyth AR, Luckenbach MW, Carmichael R, Brown BL, Cornwell JC, Piehler MF, Owens MS, Dalrymple D, Higgins CB. 2014. Use of oysters to mitigate eutrophication in coastal waters. Estuar Coast Shelf Sci 151: 156–168. [Google Scholar]
- Kerckhof F, Coolen JWP, Rumes B, Degraer S. 2018. Recent findings of wild European flat oysters Ostrea edulis (Linnaeus, 1758) in Belgian and Dutch offshore waters: new perspectives for offshore oyster reef restoration in the southern North Sea. Belg J Zool 148: 13–24. [CrossRef] [Google Scholar]
- Kirby MX. 2004. Fishing down the coast: historical expansion and collapse of oyster fisheries along continental margins. PNAS 101: 13096–13099. [CrossRef] [Google Scholar]
- Kristensen P. 1997. Oyster and mussel fisheries in Denmark, in: C. MacKenzie, V. Burrell, A. Rosenfield, W. Hobart (Eds.), The History, Present Condition, and Future of the Molluscan Fisheries of North and Central America and Europe, Volume 3, Europe. NOAA Technical Report NMFS, pp. 25–38. [Google Scholar]
- Laing I, Walker P, Areal F. 2006. Return of the native − is European oyster (Ostrea edulis) stock restoration in the UK feasible? Aquat Living Resour 19: 283–287. [CrossRef] [Google Scholar]
- Laugen AT, Hollander J, Obst M, Strand Å. 2015. The Pacific oyster (Crassostrea gigas) invasion in Scandinavian coastal waters: impact on local ecosystem services, in: J. Canning-Clode (ed.) Biological invasions in aquatic and terrestrial systems: biogeography, ecological impacts, predictions, and management. De Gruyter Open, Berlin, pp. 230–252. [Google Scholar]
- Lenihan HS, Peterson CH. 1998. How habitat degradation through fishery disturbance enhances impacts of hypoxia on oyster reefs. Ecol Appl 8: 128–140. [Google Scholar]
- Lipcius RN, Burke RP, McCulloch DN, Schreiber SJ, Schulte DM, Seitz RD, Shen J. 2015. Overcoming restoration paradigms: value of the historical record and metapopulation dynamics in native oyster restoration. Front Mar Sci 2: 3747. [Google Scholar]
- Lipton D. 2008. Economic benefits of a restored oyster fishery in Chesapeake Bay. J Shellfish Res 27: 619–623. [Google Scholar]
- Long S, Ffrench-Constant R, Witt M. 2017. Have centuries of inefficient fishing sustained a wild oyster fishery: a case study. Fish Aqua J 8: 2. [Google Scholar]
- Lotze HK. 2007. Rise and fall of fishing and marine resource use in the Wadden Sea, southern North Sea. Fish Res 87: 208–218. [Google Scholar]
- Maar M, Timmermann K, Petersen JK, Gustafsson KE, Storm LM. 2010. A model study of the regulation of blue mussels by nutrient loadings and water column stability in a shallow estuary, the Limfjorden. J Sea Res 64: 322–333. [Google Scholar]
- Madsen L, Kamp J, Mellergaard S. 2013. What can the Limfjorden tell us about limiting factors for Bonamia ostreae in northern Europe? Bul Eur Ass Fish Pathol 33: 165–169. [Google Scholar]
- Matthiessen GC. 2008. Oyster culture. John Wiley and Sons. [Google Scholar]
- Orton J. 1927. Observation and experiments on sex-change in the European Oyster (O. edulis): Part I. The change from female to male. J Mar Biol Assoc UK 14: 967–1045. [CrossRef] [Google Scholar]
- Petersen CGJ. 1907. Studier over østersfiskeriet og østersen i Limfjorden. Beretn.: fra Den Danske BioI. Sta. XV: I-70 (In Danish). [Google Scholar]
- Pogoda B, Brown J, Hancock B, Preston J, Pouvreau S, Kamermans P, Sanderson W, von Nordheim H. 2019. The Native Oyster Restoration Alliance (NORA) and the Berlin Oyster Recommendation: bringing back a key ecosystem engineer by developing and supporting best practice in Europe. Aquat Living Resour 32: 13. [CrossRef] [Google Scholar]
- Richardson CA, Collis SA, Ekaratne K, Dare P, Key D. 1993. The age-determination and growth-rate of the European flat Oyster, Ostrea edulis, in British waters determined from acetate peels of umbo growth lines. Ices J Mar Sci 50: 493–500. [Google Scholar]
- Rothschild B, Ault J, Goulletquer P, Héral M. 1994. Decline of the Chesapeake bay oyster population − a century of habitat destruction and overfishing. Mar Ecol Prog Ser 111: 29–39. [Google Scholar]
- Ruesink J, Lenihan HS, Trimble A, Heiman KW, Micheli F, Byers JE, Kay MC. 2005. Introduction of non-native oysters: ecosystem effects and restoration implications. Annu Rev Ecol Evol Syst 36: 643–689. [Google Scholar]
- Sawusdee A, Jensen AC, Collins KJ, Hauton C. 2015. Improvements in the physiological performance of European flat oysters Ostrea edulis (Linnaeus, 1758) cultured on elevated reef structures: implications for oyster restoration. Aquaculture 444: 41–48. [Google Scholar]
- Schrobback P, Pascoe S, Coglan L. 2014. History, status and future of Australia's native Sydney rock oyster industry. Aquat Living Resour 27: 153–165. [CrossRef] [Google Scholar]
- Sheail J. 1986. An historical perspective on the development of a marine resource the Whitstable Oyster fishery. Mar Environ Res 19: 279–293. [Google Scholar]
- Smyth D, Roberts D, Browne L. 2009. Impacts of unregulated harvesting on a recovering stock of native oysters (Ostrea edulis). Mar Pollut Bull 58: 916–922. [Google Scholar]
- Smyth D, Mahon AM, Roberts D, Kregting L. 2018. Settlement of Ostrea edulis is determined by the availability of hard substrata rather than by its nature: implications for stock recovery and restoration of the European oyster. Aquatic Conserv 28: 662–671. [CrossRef] [Google Scholar]
- Spärck R. 1925. Studies on the biology of the oyster (Ostrea edulis) in the Limfjorden, with special reference to the influence of temperature on the sex change. Report of the Danish Biological Station. XXX: 3–84. [Google Scholar]
- Spärck R. 1929. Undersøgelser over østersens (Ostrea edulis) biologi. VI-VIII. Ber.: fra Den Danske BioI. Sta. XXXV: 93–103 (In Danish). [Google Scholar]
- Spärck R. 1935. Undersøgelser over østersens biologi i Limfjorden. XI. Om den naturlige østersbestands størrelse og alderssammensætning. Ber.: fra Den Danske BioI. Sta. XL37–39 (In Danish). [Google Scholar]
- Spärck R. 1949. Fluctuations in the stock of oyster (Ostrea edulis) in the Limfjorden in recent time. Rep. Ices Spec Sci Meet Shellfish , pp. 1–6. [Google Scholar]
- Tully O, Clarke S. 2012. The status and management of oyster (Ostrea edulis) in Ireland. Irish Fisheries Investigations No 24. The Marine Institute, Fisheries Ecosystems Advisory Services, Rinville, Oranmore, Co. Galway. [Google Scholar]
- Vaughn C, Hoellein T. 2018. Bivalve impacts in freshwater and marine ecosystems. Annu Rev Ecol Evol Syst 49: 183–208. [Google Scholar]
- White J, Ruesink J, Trimble A. 2009. The nearly forgotten oyster: Ostrea lurida Carpenter 1864 (Olympia Oyster) history and management in Washington state. J Shellfish Res 28: 43–49. [Google Scholar]
- Wilberg MJ, Livings ME, Barkman JS, Morris BT, Robinson JM. 2011. Overfishing, disease, habitat loss, and potential extirpation of oysters in upper Chesapeake Bay. Mar Ecol Prog Ser 436: 131–144. [Google Scholar]
- Zwerschke N, Kochmann J, Ashton EC, Crowe T, Roberts D, O'Connor N. 2018a. Co-occurrence of native Ostrea edulis and non-native Crassostrea gigas revealed by monitoring of intertidal oyster populations. J Mar Biol Assoc UK 98: 2029–2038. [CrossRef] [Google Scholar]
- Zwerschke N, van Rein H, Harrod C, Reddin C, Emmerson MC, Roberts D, O'Connor N. 2018b. Competition between co‐occurring invasive and native consumers switches between habitats. Funct Ecol 32: 2717–2729. [Google Scholar]
Cite this article as: Nielsen P, Petersen JK. 2019. Flat oyster fishery management during a time with fluctuating population size. Aquat. Living Resour. 32: 22
All Tables
Total flat population data (tons) from 2004 to 2018 and total allowable catch (TAC) in tons and as percentage of total population.
All Figures
|
Fig. 1 (A) Location of the Limfjorden, Denmark. (B) The surveyed areas included in the annual stock surveys in the Western part of the Limfjorden, where numbers refers to shellfish production areas and ★ = temperature monitoring station. |
| In the text | |
|
Fig. 2 Harvest of European flat oysters (Ostrea edulis) in numbers (millions) from the Limfjorden from 1852 to 2017. |
| In the text | |
|
Fig. 3 The annual flat oyster (Ostrea edulis) population size, landings and estimated proportion of target oysters (60 g in 2005 and >80 g since 2006) during 2004–2018 in the Limfjorden, Denmark. |
| In the text | |
|
Fig. 4 Size distribution of oysters (Ostrea edulis) in the annual stock surveys done from 2004 to 2018 in the Limfjorden, Denmark. The vertical dotted lines indicate the estimated shell height corresponding to the minimum landing size of 60 g for 2004–2005 and 80 g for 2006–2018. Note: different Y-scale on the 2004 plot. |
| In the text | |
|
Fig. 5 Population structure of oysters (Ostrea edulis) caught in the annual population surveys. Data are presented as the percentage in each shell height size category of pooled data for all sites in surveys carried out 2004–2018. Black bars: small oysters below minimal legal size; Light grey bars: targeted oysters above minimal legal size and below preferred marked-size; Dark grey bars: large oysters above preferred marked size (see text for more details). |
| In the text | |
|
Fig. 6 The estimated average individual weight (g) for the total oyster (Ostrea edulis) population and target oysters (60–175 g in 2004–2005 and 80–175 g in 2006–2018). The horizontal dotted lines indicate the minimum landing sizes (60 or 80 g) of O. edulis for the given years. Data are from the annual stock surveys done in 2004–2018 in the Limfjorden, Denmark. |
| In the text | |
|
Fig. 7 The annual total net mortality incl. fishery (black bars) and fishery related mortality (grey bars) of flat oysters (Ostrea edulis) within each fishing season from 2004 to 2017. Negative values of total net mortality indicate that recruitments were larger than total net mortality. |
| In the text | |
|
Fig. 8 Average estimated summer temperature (June-August) in Nissum Broad 1900 to 2016 as a function of number of flat oysters (Ostrea edulis) landed five years after. |
| In the text | |
Current usage metrics show cumulative count of Article Views (full-text article views including HTML views, PDF and ePub downloads, according to the available data) and Abstracts Views on Vision4Press platform.
Data correspond to usage on the plateform after 2015. The current usage metrics is available 48-96 hours after online publication and is updated daily on week days.
Initial download of the metrics may take a while.