Free Access
Fig. 10
Download original image
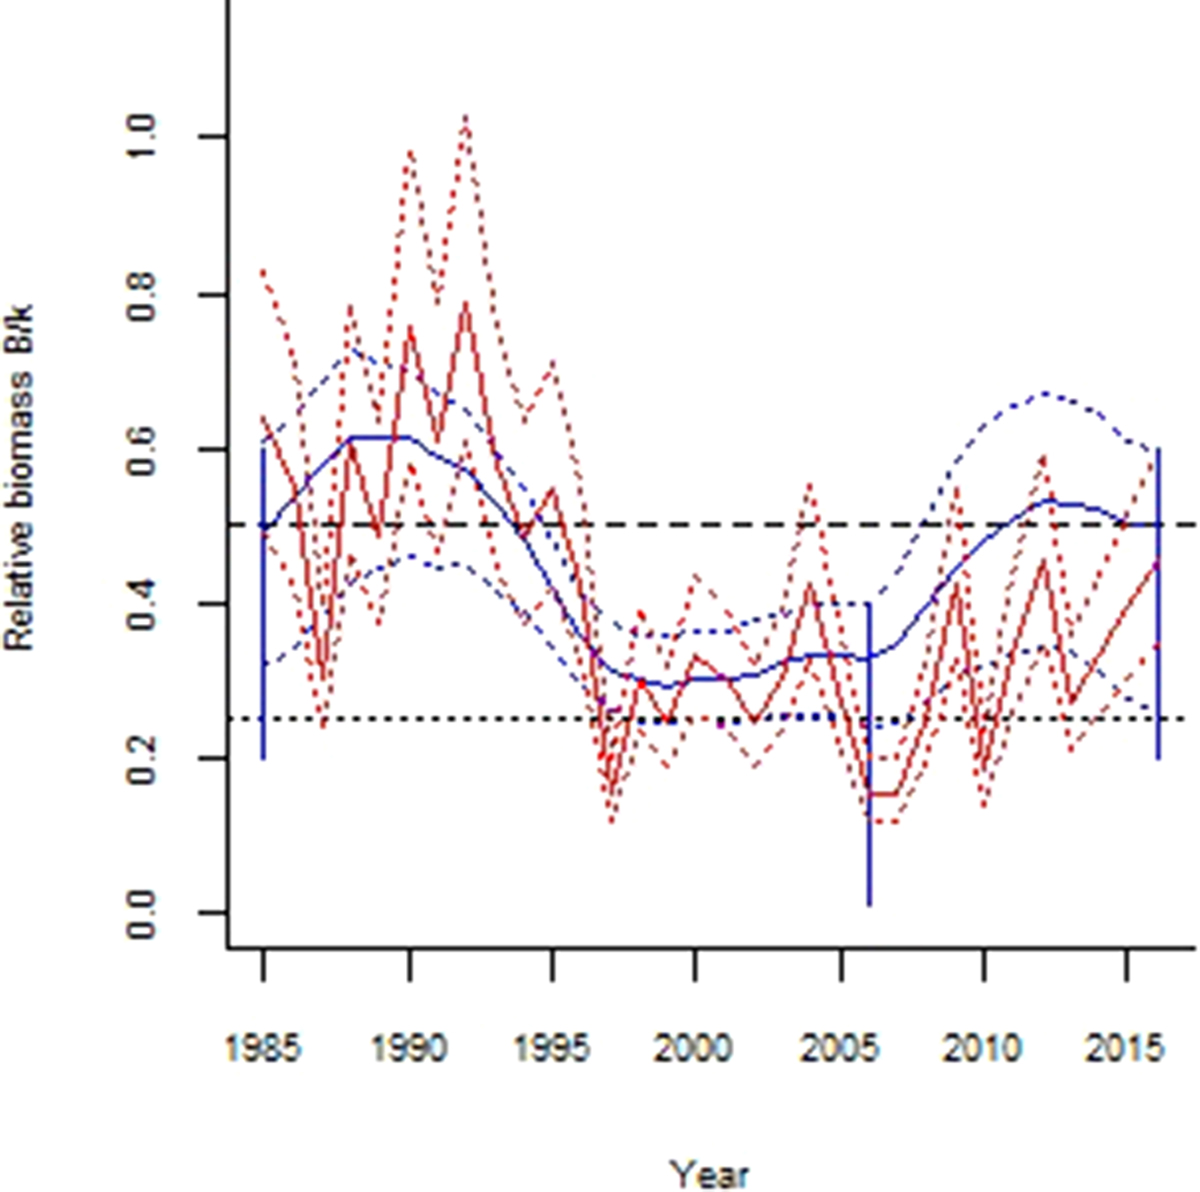
CMSY predictions of relative biomass B/k (bold curve) with 2.5th and 95th percentiles (thin curves) compared to observed biomass (dashed curve) scaled by the respective BSM estimate for k, for S. undosquamis stock in southeastern Arabian Sea.
Current usage metrics show cumulative count of Article Views (full-text article views including HTML views, PDF and ePub downloads, according to the available data) and Abstracts Views on Vision4Press platform.
Data correspond to usage on the plateform after 2015. The current usage metrics is available 48-96 hours after online publication and is updated daily on week days.
Initial download of the metrics may take a while.