Fig. 3
Download original image
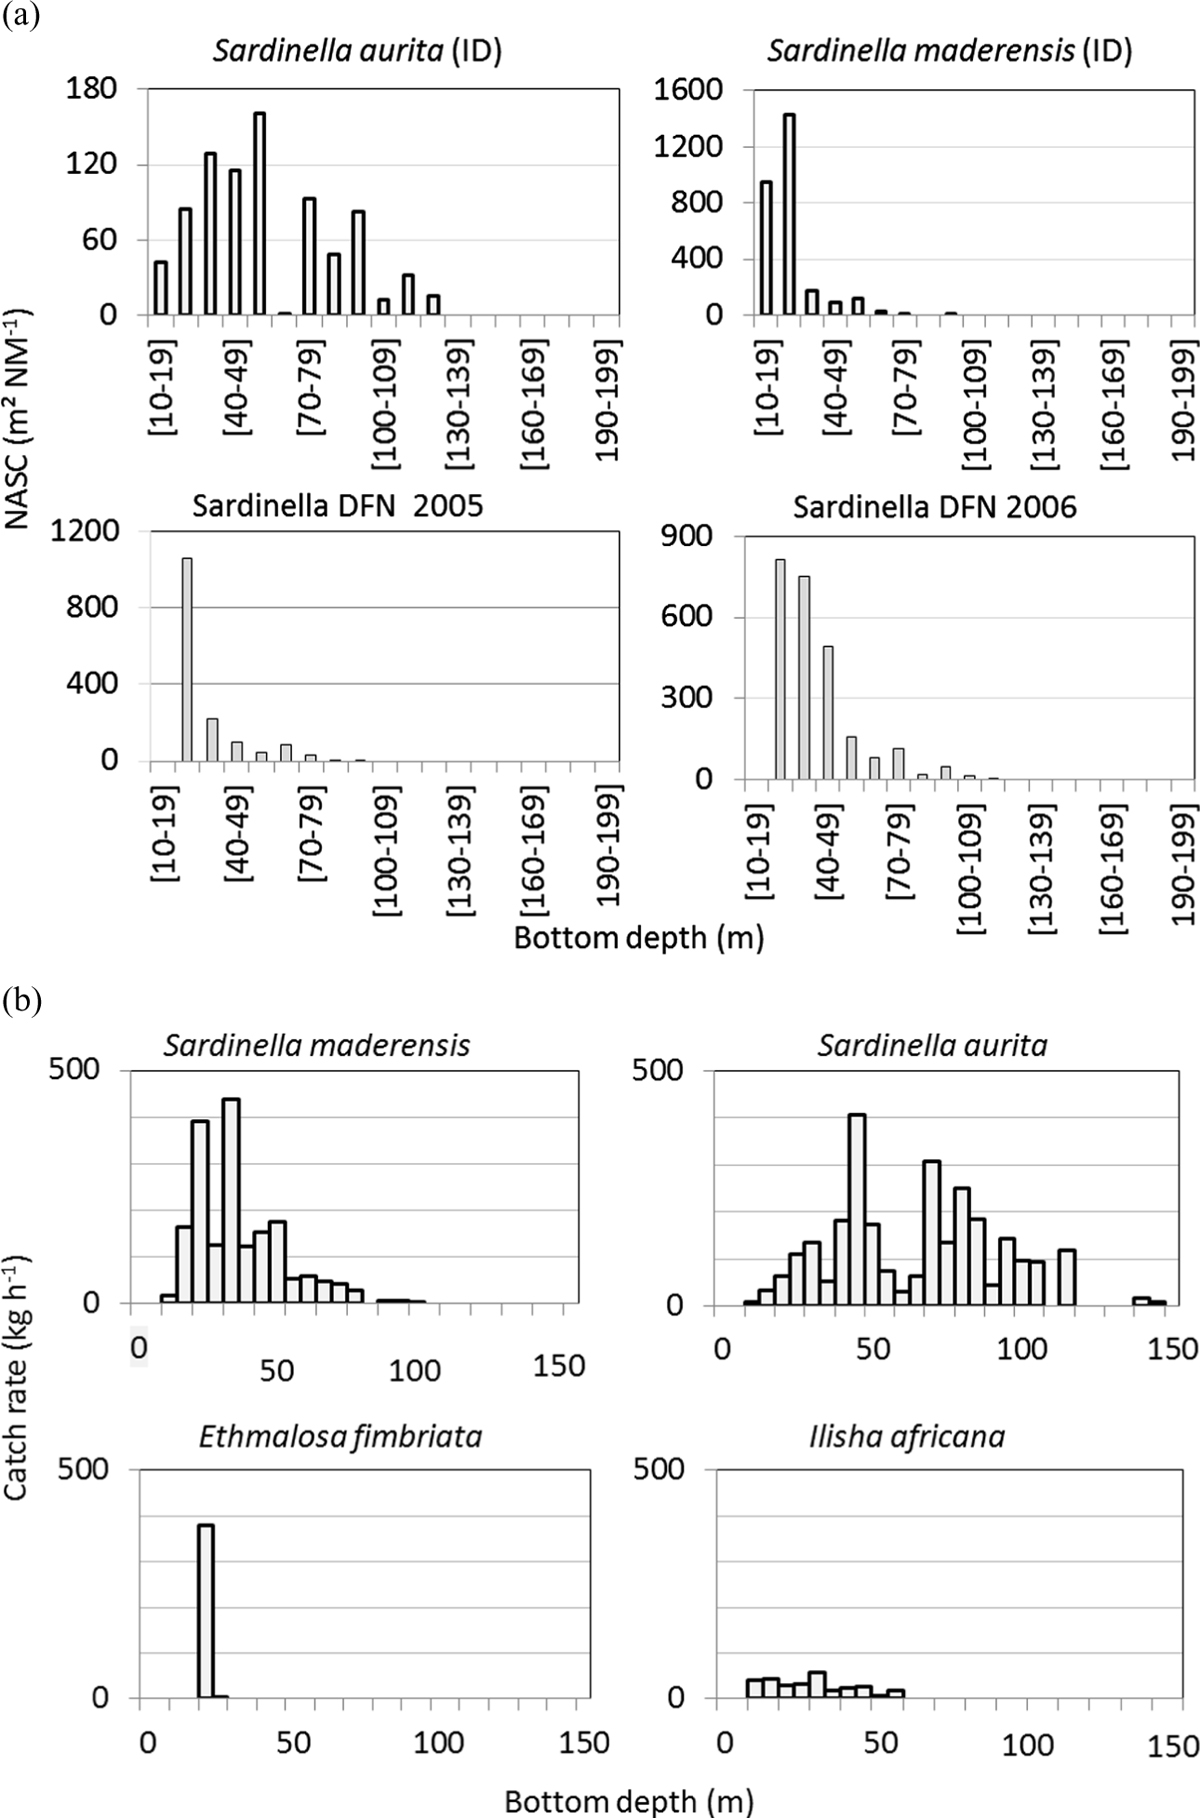
Histograms of the (a) bottom depth distribution of the NASC of Sardinella aurita and S. maderensis from the RV Itaf Deme “ID” (acoustic small pelagic assessment survey covering the Senegambia led in 2004, 2005, and 2007) and pooled NASC of both sardinella from the RV Dr Fridtjof Nansen “DFN” (acoustic small pelagic assessment survey led in 2005 and 2006 with sample (10–19 m) missing); (b) bottom depth distribution of relative catch rates of S. aurita, S. maderensis, Ethmalosa fimbriata and Ilisha africana, from the DFN trawl operation time series (1981–2006; n = 1320).
Current usage metrics show cumulative count of Article Views (full-text article views including HTML views, PDF and ePub downloads, according to the available data) and Abstracts Views on Vision4Press platform.
Data correspond to usage on the plateform after 2015. The current usage metrics is available 48-96 hours after online publication and is updated daily on week days.
Initial download of the metrics may take a while.