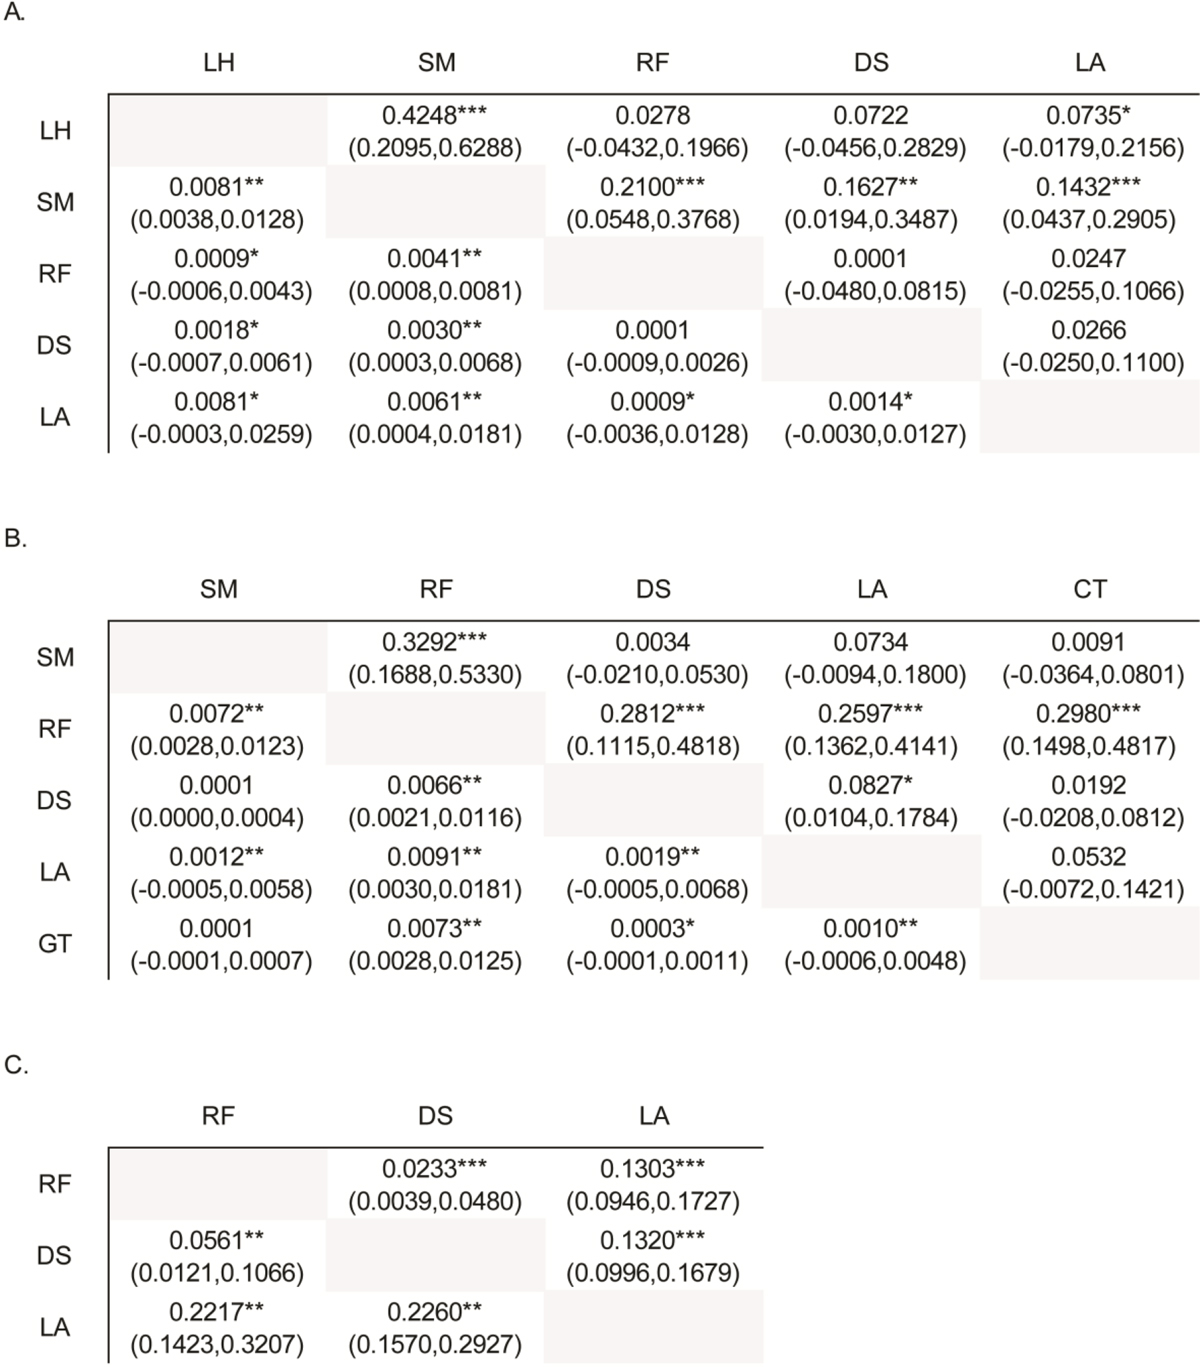
Table 2
Pairwise genetic differentiation for (A) Fucus spiralis, (B) F. guiryi and (C) F. vesiculosus. Mean values of FST with the estimator θ are reported above the diagonal, while mean DJost values are reported below the diagonal. Asterisks indicate significant deviation from null expectations with q-value correction for multiple comparisons: ⁎<0.05; ⁎⁎<0.01; ⁎⁎⁎<0.001. 95% confidence intervals are in brackets. Codes correspond to locations in Table 1.
Current usage metrics show cumulative count of Article Views (full-text article views including HTML views, PDF and ePub downloads, according to the available data) and Abstracts Views on Vision4Press platform.
Data correspond to usage on the plateform after 2015. The current usage metrics is available 48-96 hours after online publication and is updated daily on week days.
Initial download of the metrics may take a while.