Fig. 3
Download original image
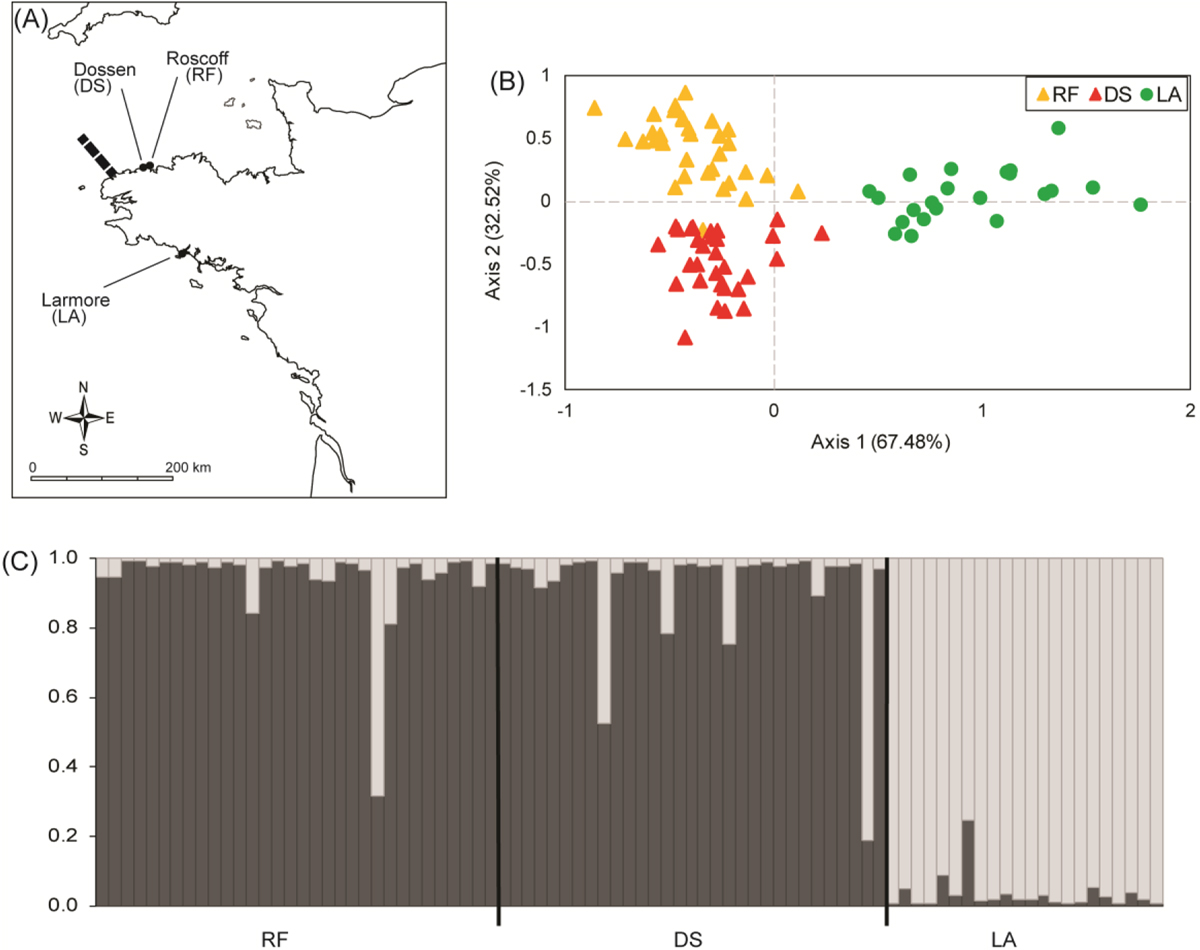
Sampling locations and genetic structure for Fucus vesiculosus. (A) Map of the study area; dots indicate sampled locations; code of each site is in brackets; the biogeographic discontinuity is indicated by a dashed line, following Ayata et al. (2010) and Gallon et al. (2014). (B) Factorial Correspondence Analysis based on allele frequencies at six microsatellite loci. Percentages of inertia are shown between parentheses for each axis. (C) Genetic subdivision into clusters as defined by STRUCTURE where each vertical bar represents an individual. Proportions of multilocus genotypes for each individual assigned to each K cluster (K = 2) is illustrated by different colours. Codes correspond to locations in section A of this same figure.
Current usage metrics show cumulative count of Article Views (full-text article views including HTML views, PDF and ePub downloads, according to the available data) and Abstracts Views on Vision4Press platform.
Data correspond to usage on the plateform after 2015. The current usage metrics is available 48-96 hours after online publication and is updated daily on week days.
Initial download of the metrics may take a while.