Fig. 2
Download original image
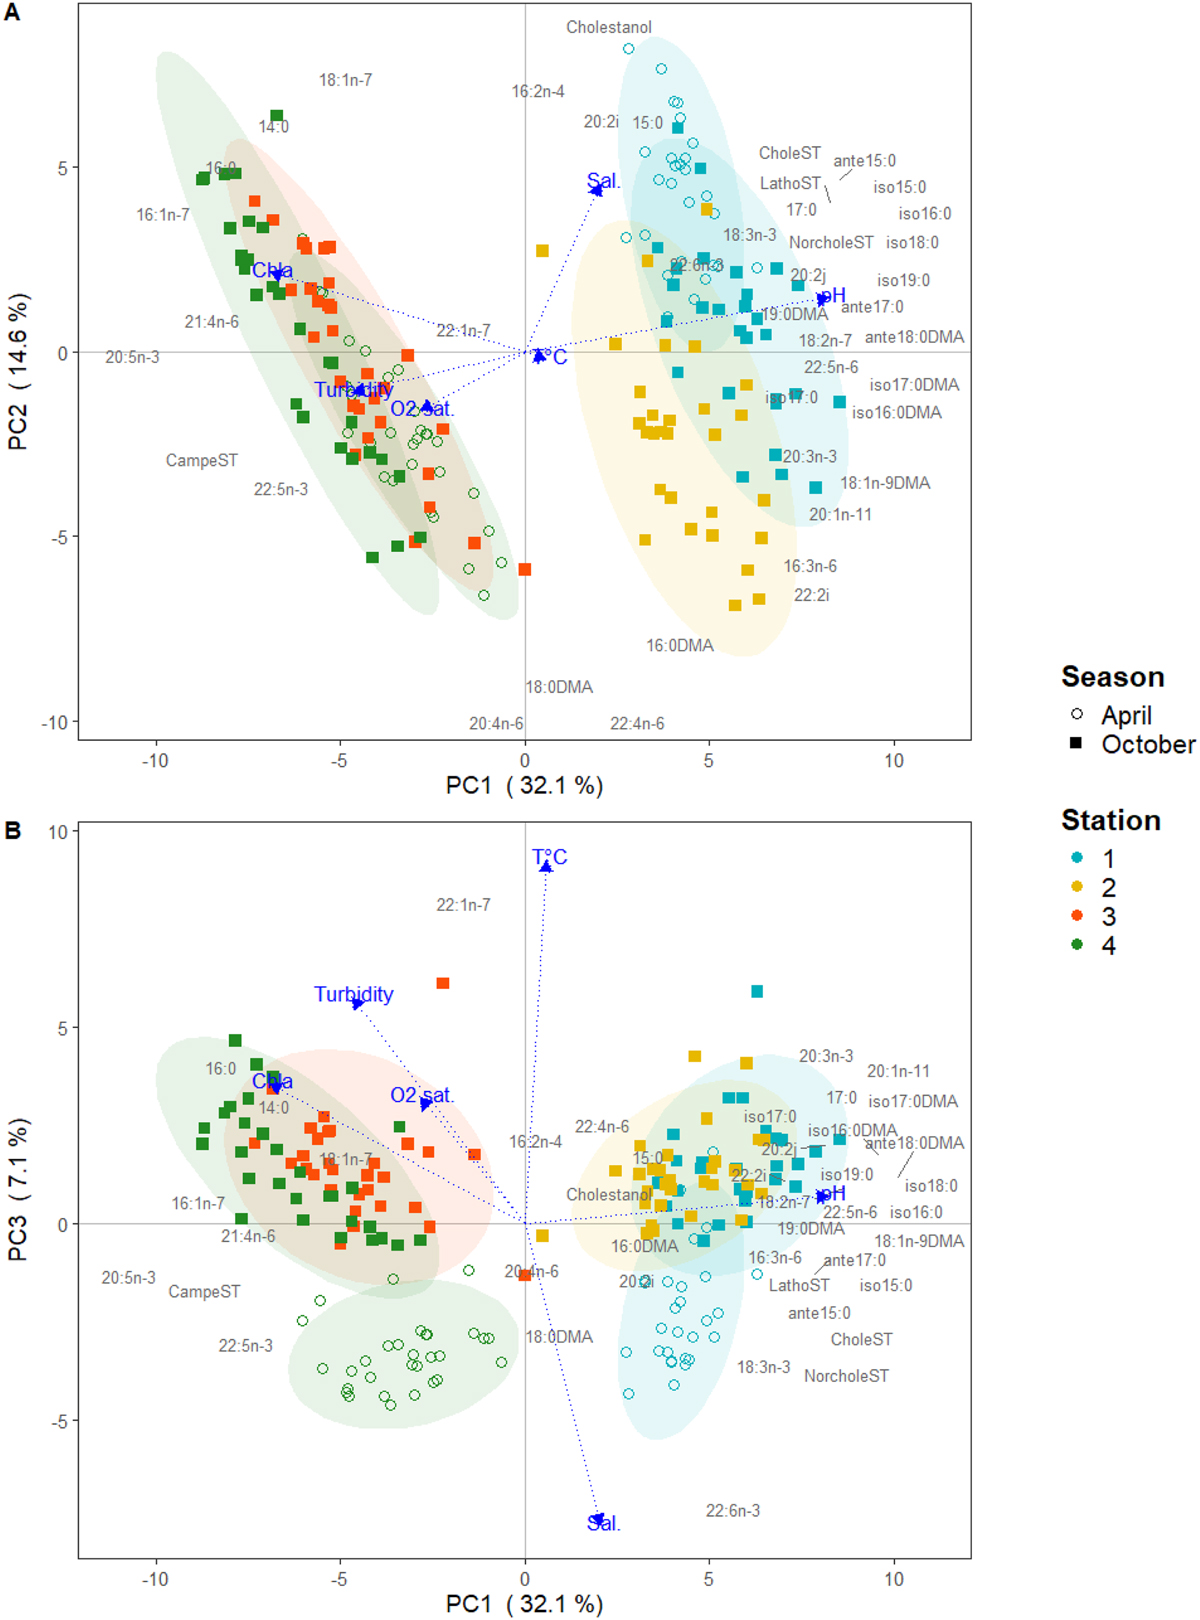
Principal Component Analysis (PCA) of the sterol and FA composition (%) of the S. senilis, collected at 4 stations and 2 seasons in the Sine Saloum delta, Senegal. The analysis also included environmental parameters and stable isotopes values (δ13C and δ15N values). Only the compounds best represented on the first three axes of the PCA (i.e., cos2>0.35) are shown in the figure. The graph of individuals and the relative contributions of variables are shown on dimensions 1 and 2 (Fig. 2A) and 1 and 3 (Fig. 2B). The colors indicate the stations (blue for station 1, yellow for station 2, red for station 3, and green for station 4) while the shape of the points varies according to the season (empty circles for April and full squares for October). Blue arrows represent environmental parameters: T °C corresponds to water temperature, Chla to chlorophyll-a concentration (expressed by arbitrary units, AU), O2 sat. to water oxygen saturation, and Sal. to salinity. ST to sterols.
Current usage metrics show cumulative count of Article Views (full-text article views including HTML views, PDF and ePub downloads, according to the available data) and Abstracts Views on Vision4Press platform.
Data correspond to usage on the plateform after 2015. The current usage metrics is available 48-96 hours after online publication and is updated daily on week days.
Initial download of the metrics may take a while.