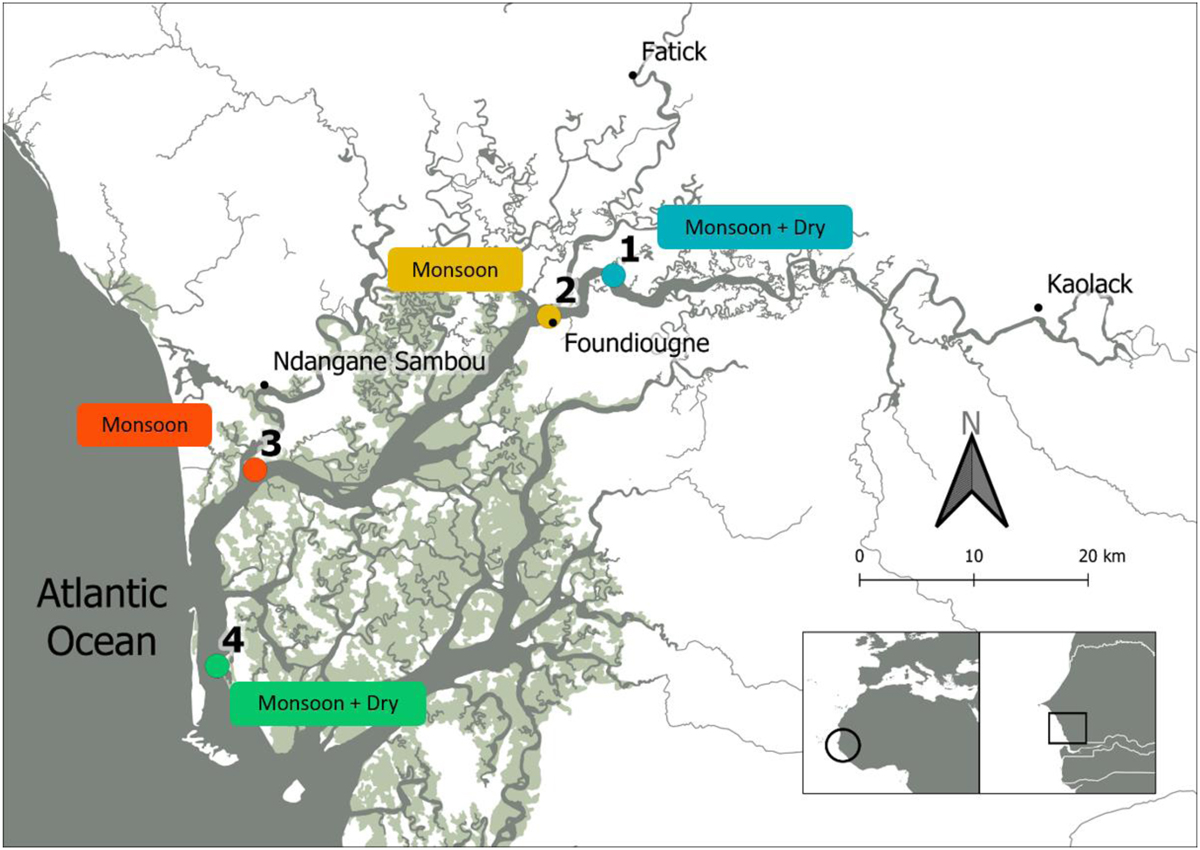
Fig. 1
Download original image
Locations of the sampling stations in the Sine Saloum delta, Senegal. Stations are identified by colored dots (blue for station 1, yellow for station 2, red for station 3 and green for station 4) along with nearby towns in black dots and mangrove in light grey (Shapefile obtained using Géo Senegal). The season at which sampling took place are indicated in colored squares.
Current usage metrics show cumulative count of Article Views (full-text article views including HTML views, PDF and ePub downloads, according to the available data) and Abstracts Views on Vision4Press platform.
Data correspond to usage on the plateform after 2015. The current usage metrics is available 48-96 hours after online publication and is updated daily on week days.
Initial download of the metrics may take a while.