Fig. 3
Download original image
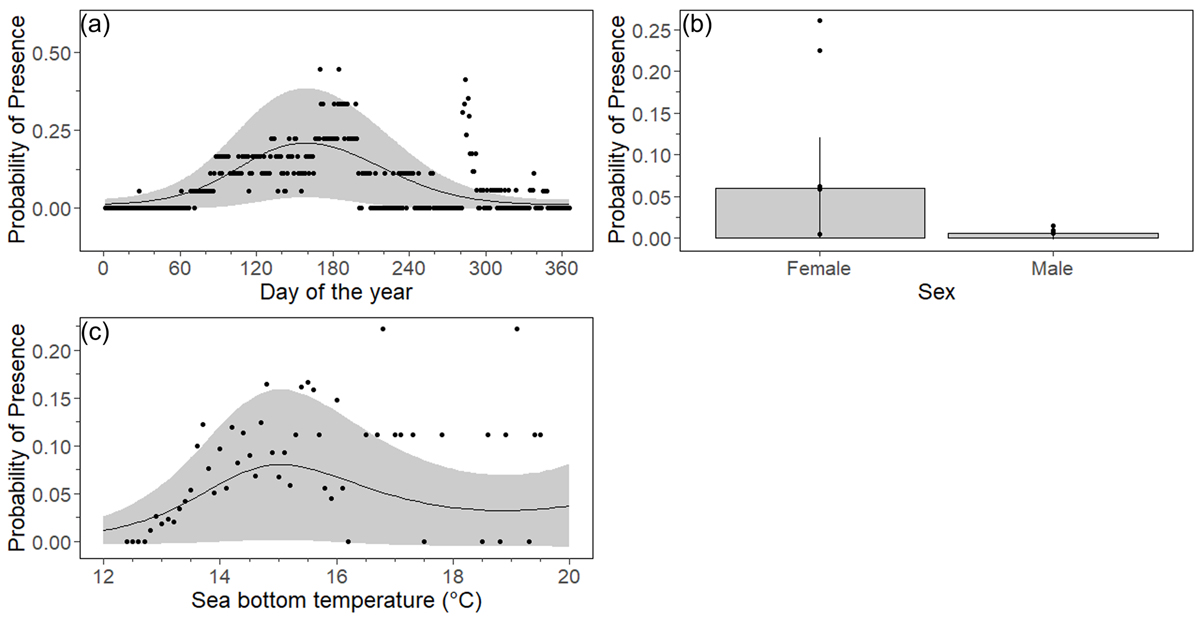
Predicted probability of the presence of Raja clavata in the study area as a function of day of the year (a), sex (b) and sea bottom temperature (c). Black bars (b) and grey shaded areas (a, c) represent the 95% confidence interval. Black dots correspond to the raw data of probability of presence. Values used for predictions: sex = female, sea bottom temperature = 14 °C, day of the year = 260.
Current usage metrics show cumulative count of Article Views (full-text article views including HTML views, PDF and ePub downloads, according to the available data) and Abstracts Views on Vision4Press platform.
Data correspond to usage on the plateform after 2015. The current usage metrics is available 48-96 hours after online publication and is updated daily on week days.
Initial download of the metrics may take a while.