Fig. 6
Download original image
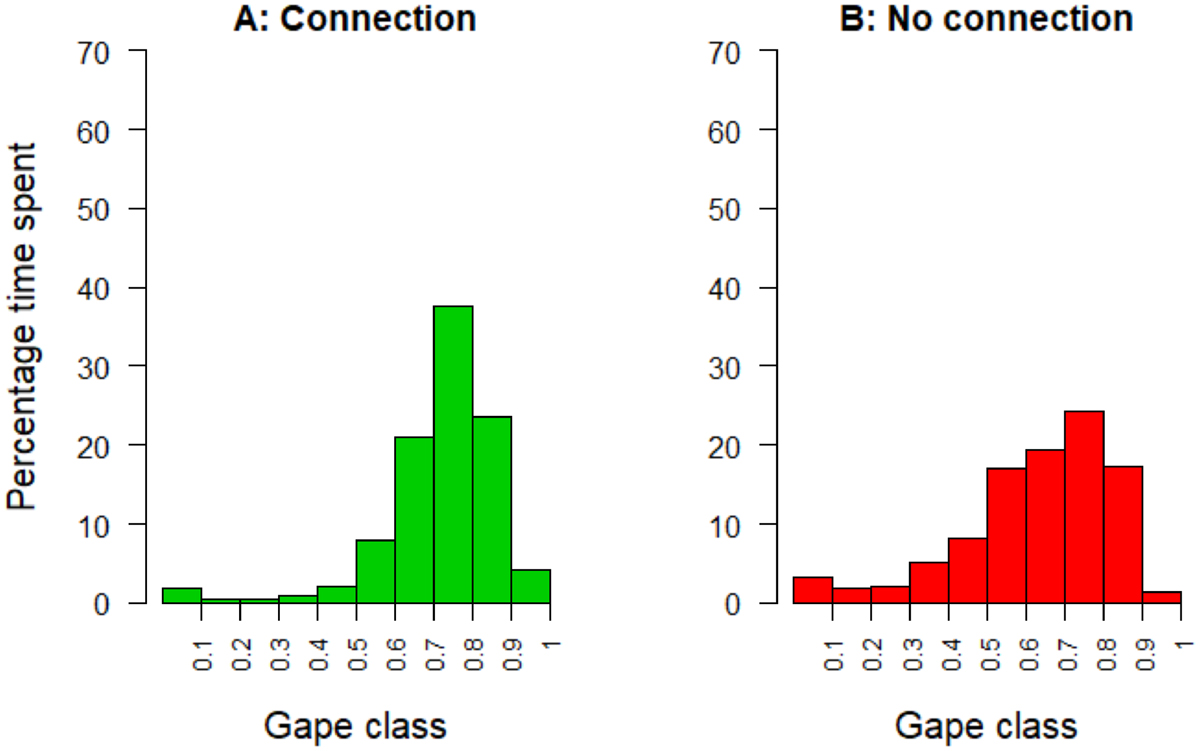
Gape class frequency distribution of oysters in the concrete basin in the Oosterschelde during the period that water inside the basin is (A) connected (green) and (B) not connected (red) to the water outside the basin. Y-axis indicates the percentage of time spent. The x-axis indicates valve opening per gape class (0–0.1, 0.1–0.2,…,0.9–1.0).
Current usage metrics show cumulative count of Article Views (full-text article views including HTML views, PDF and ePub downloads, according to the available data) and Abstracts Views on Vision4Press platform.
Data correspond to usage on the plateform after 2015. The current usage metrics is available 48-96 hours after online publication and is updated daily on week days.
Initial download of the metrics may take a while.