Fig. 7
Download original image
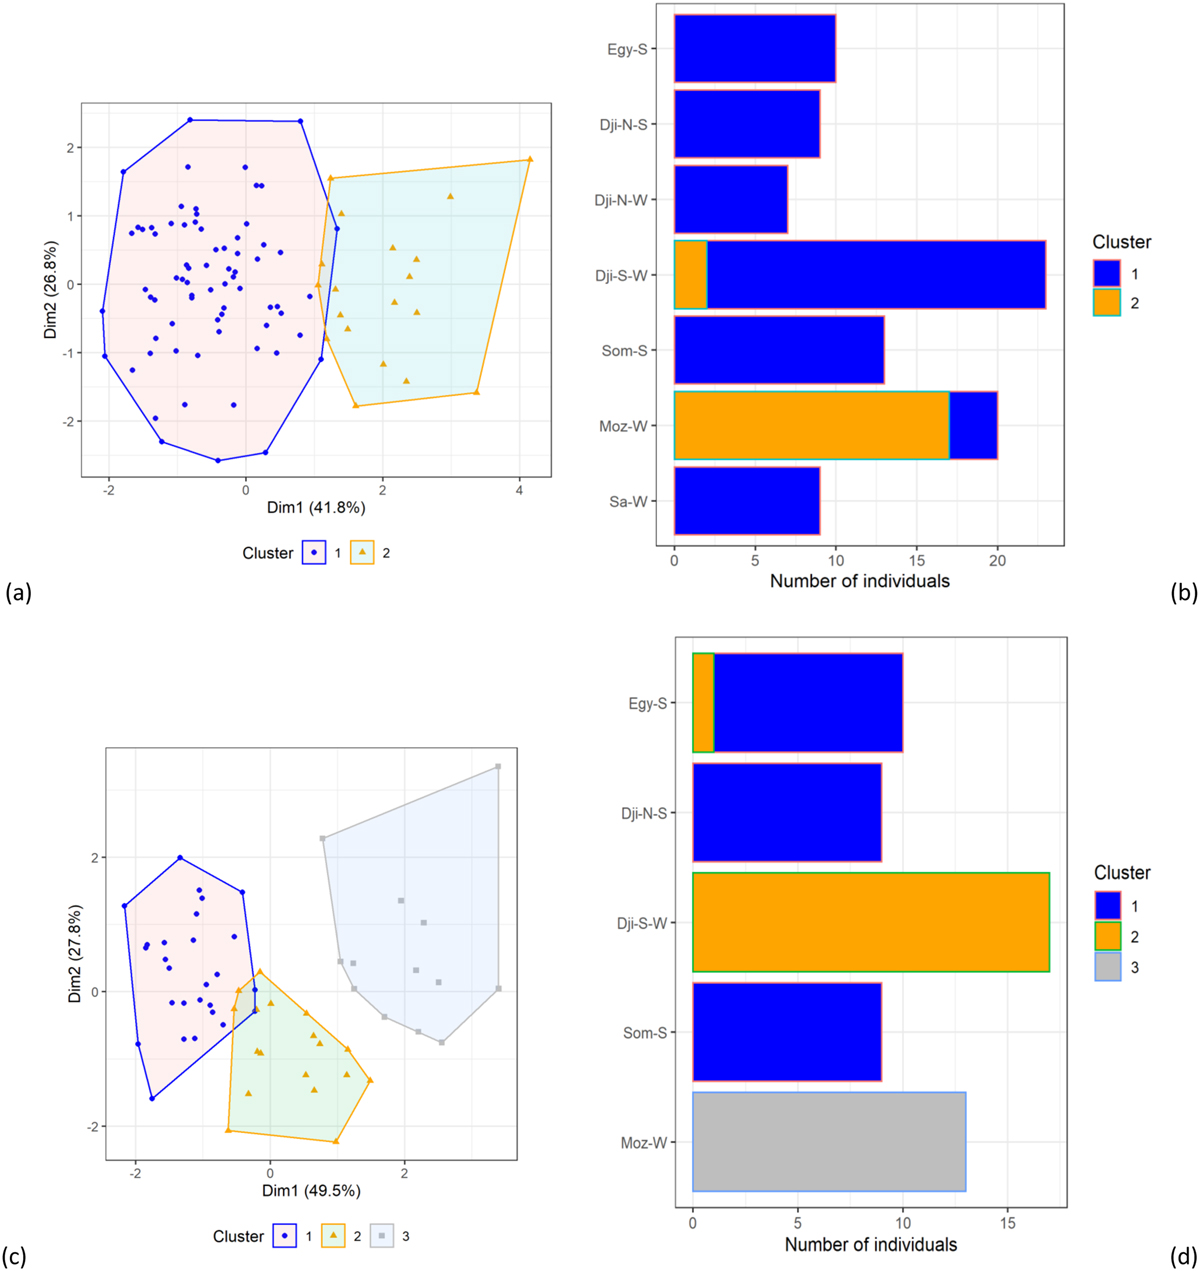
Clusters obtained using agglomerative Ward's hierarchal clustering applied to the last three points of the otolith transects (capture point) including all samples (a) and including only samples of sizes 70-90 cm (c). Barplots on the right (b, d) indicate the number of individuals from each sampling event that were assigned to the differentclusters with (b)corresponding to the clusters in (a), and (d)corresponding to the clusters in (c). The x-axis on the barplot represents the number of individuals for each sampling event colored by their assigned cluster.
Current usage metrics show cumulative count of Article Views (full-text article views including HTML views, PDF and ePub downloads, according to the available data) and Abstracts Views on Vision4Press platform.
Data correspond to usage on the plateform after 2015. The current usage metrics is available 48-96 hours after online publication and is updated daily on week days.
Initial download of the metrics may take a while.