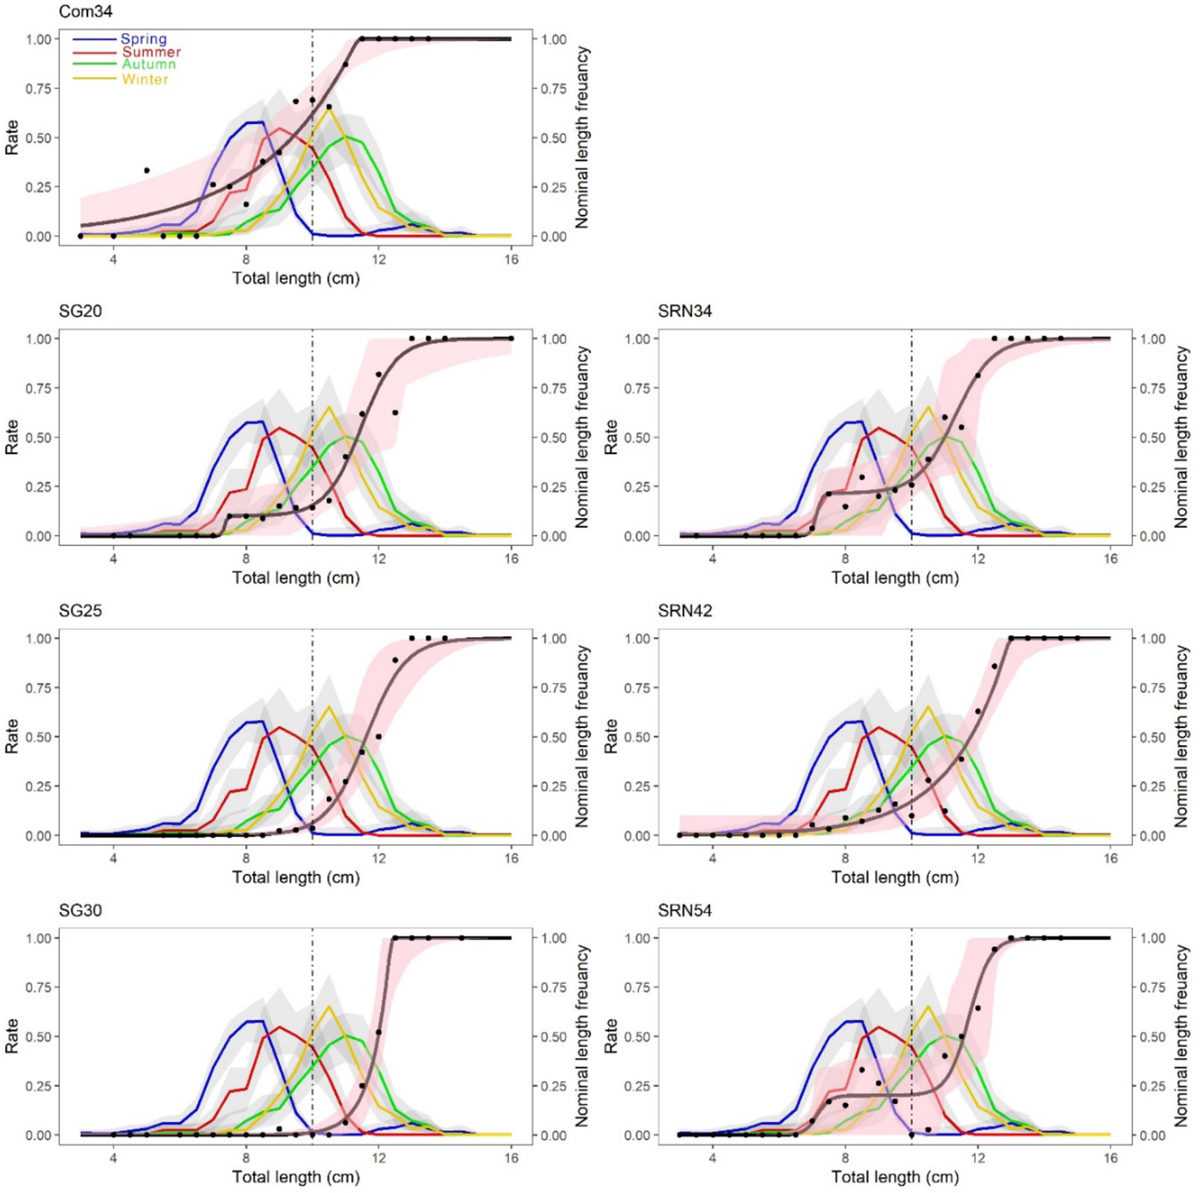
Fig. 3
Download original image
Selectivity curves with Efron's (1982) confidence intervals (black lines represent the selection curve, vertical dashed lines represent the MLS for P. leptodactylus and light pink areas describe the 95% CIs) and the size distribution of the population of P. leptodactylus for the different fishing seasons (light grey areas describe the 95% CIs).
Current usage metrics show cumulative count of Article Views (full-text article views including HTML views, PDF and ePub downloads, according to the available data) and Abstracts Views on Vision4Press platform.
Data correspond to usage on the plateform after 2015. The current usage metrics is available 48-96 hours after online publication and is updated daily on week days.
Initial download of the metrics may take a while.