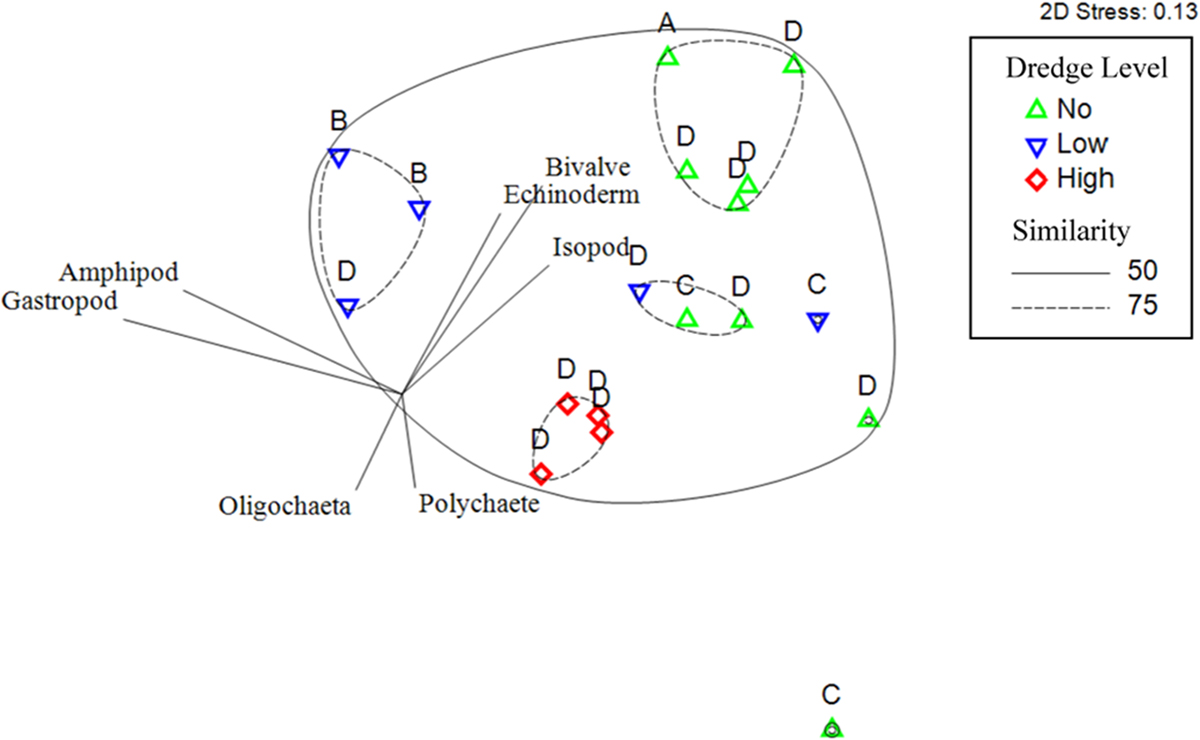
Fig. 6
Download original image
Non metric multidimensional scaling plot of invertebrate communities across each site with trajectories indicating which species has the largest influence on the overall invertebrate community distribution. Symbols represent level of dredge: “high” (>10%), “low” (<10%), and “no” (0%) and letters (A–D) are representative of habitat types. Principle components analysis was used to determine which species group influenced described the invertebrate communities represented here by the vectors.
Current usage metrics show cumulative count of Article Views (full-text article views including HTML views, PDF and ePub downloads, according to the available data) and Abstracts Views on Vision4Press platform.
Data correspond to usage on the plateform after 2015. The current usage metrics is available 48-96 hours after online publication and is updated daily on week days.
Initial download of the metrics may take a while.