Fig. 4
Download original image
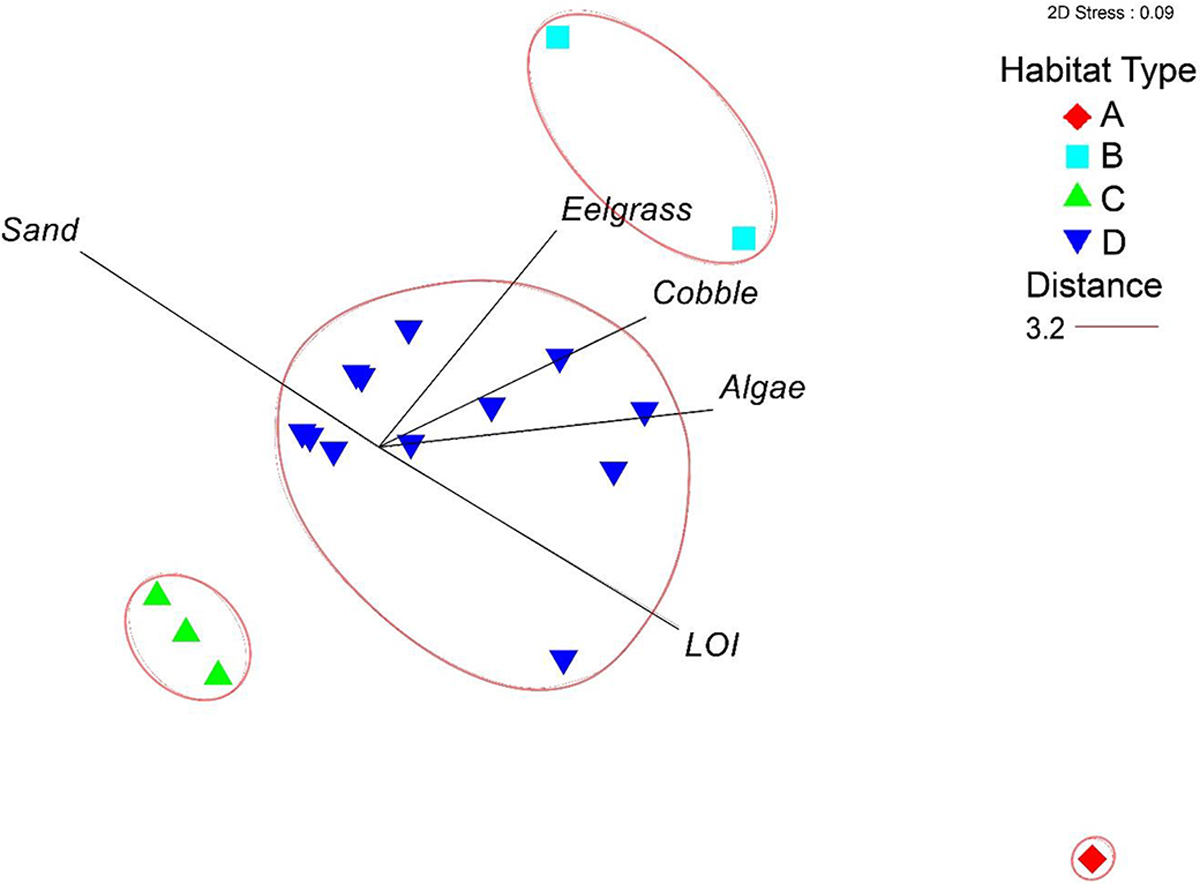
Non metric multidimensional scaling plot showing habitat classification groups identified as habitat A (n = 1): the highest percent LOI and lowest % sand, B (n = 2): having the highest coverage of eelgrass, C (n = 3): sand with absence of algae, cobble, or eelgrass, and D (n = 12): mixed habitat with high percent sand. Classification is based on cluster analysis of all habitat variables.
Current usage metrics show cumulative count of Article Views (full-text article views including HTML views, PDF and ePub downloads, according to the available data) and Abstracts Views on Vision4Press platform.
Data correspond to usage on the plateform after 2015. The current usage metrics is available 48-96 hours after online publication and is updated daily on week days.
Initial download of the metrics may take a while.