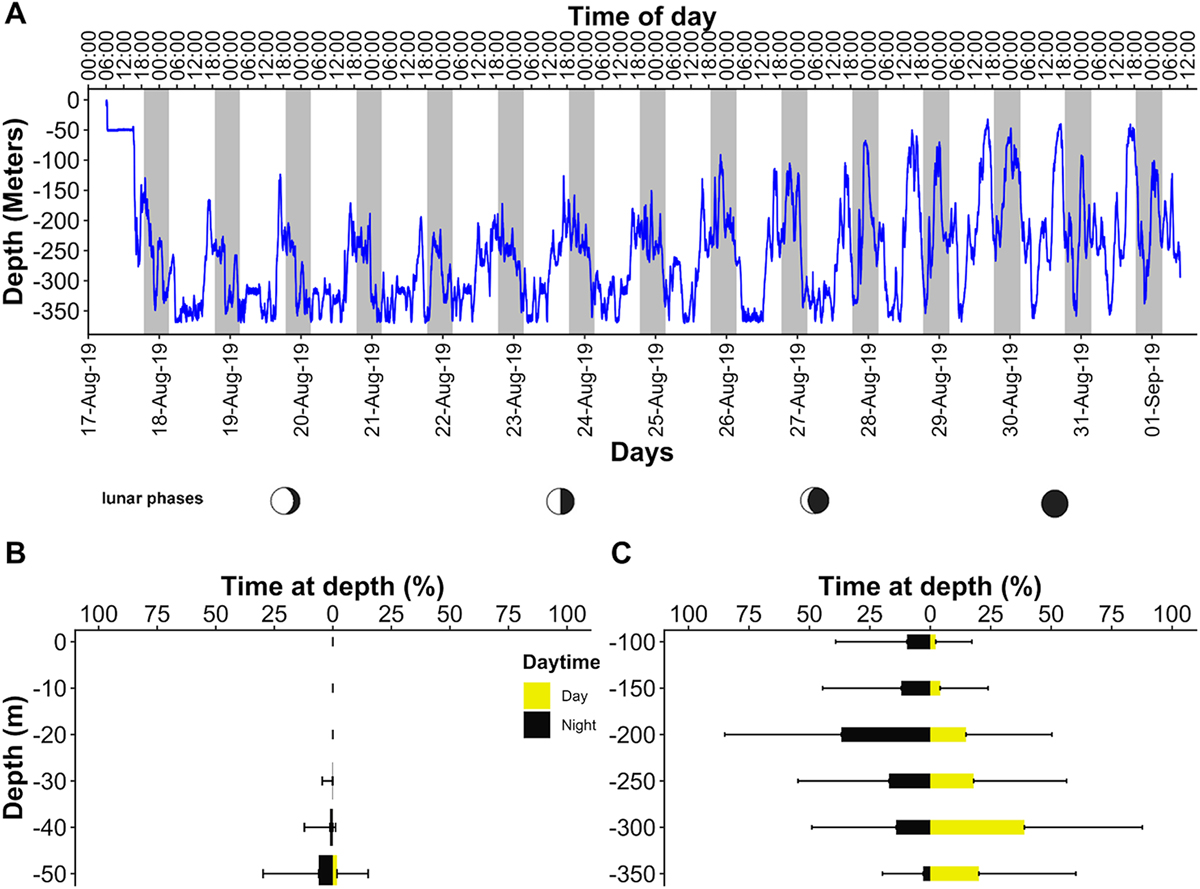
Fig. 4
Download original image
Graphic representation of predator vertical movement. (A) Predator diving behaviour by date (days), time (h) and lunar phases between 17th of August 2019 and 1st of September 2019. Blue line = dive profile, grey area = nautical twilight night event (time between dusk and dawn) and white area = nautical twilight day event (time between dawn and dusk) (bB) percentage of Time at Depth (TAD) bar plot. Depth bins = 0 (thresholds 0–9 m), 10 (thresholds 10–19 m), 20 (thresholds 20–29 m), 30 (thresholds 30–39 m), 40 (thresholds 40–49 m), 50 (thresholds 50–99 m). (C) percentage of Time at Depth (TAD) bar plot between 100 and 350 m with 50 m resolution Depth bins = 100 (thresholds 100–149 m), 150 (thresholds 150–199 m), 200 (thresholds 200–249 m), 250 (thresholds 250–299 m), 300 (thresholds 300–349 m), 350 (thresholds 350–399 m). Yellow colour = daytime, black colour = night-time, error bars = standard deviation (SD).
Current usage metrics show cumulative count of Article Views (full-text article views including HTML views, PDF and ePub downloads, according to the available data) and Abstracts Views on Vision4Press platform.
Data correspond to usage on the plateform after 2015. The current usage metrics is available 48-96 hours after online publication and is updated daily on week days.
Initial download of the metrics may take a while.