Open Access
Fig. 2
Download original image
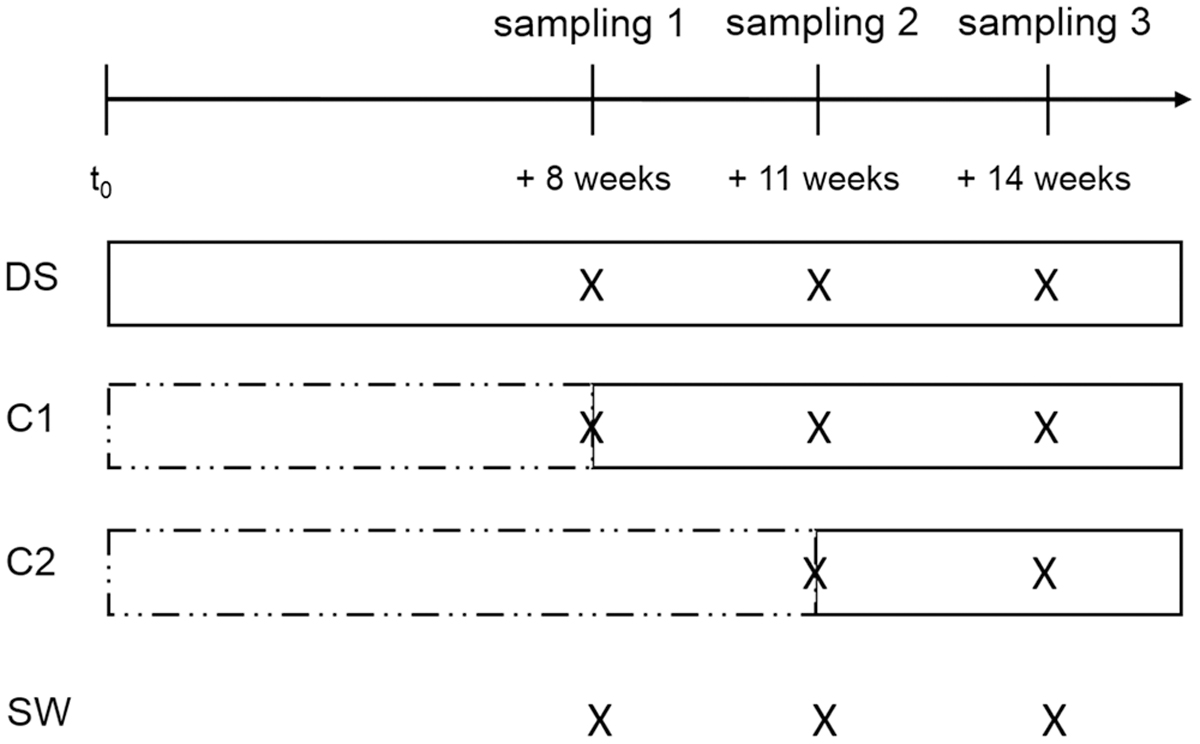
Overview of the experimental design. Treatments: DS = direct seeded line, C1 = collector 1, C2 = collector 2, SW = seawater. X indicates the samplings, broken lines indicate the time of sporophytes grown in laboratory conditions and full lines the time of sporophytes grown in the field.
Current usage metrics show cumulative count of Article Views (full-text article views including HTML views, PDF and ePub downloads, according to the available data) and Abstracts Views on Vision4Press platform.
Data correspond to usage on the plateform after 2015. The current usage metrics is available 48-96 hours after online publication and is updated daily on week days.
Initial download of the metrics may take a while.