Fig. 7
Download original image
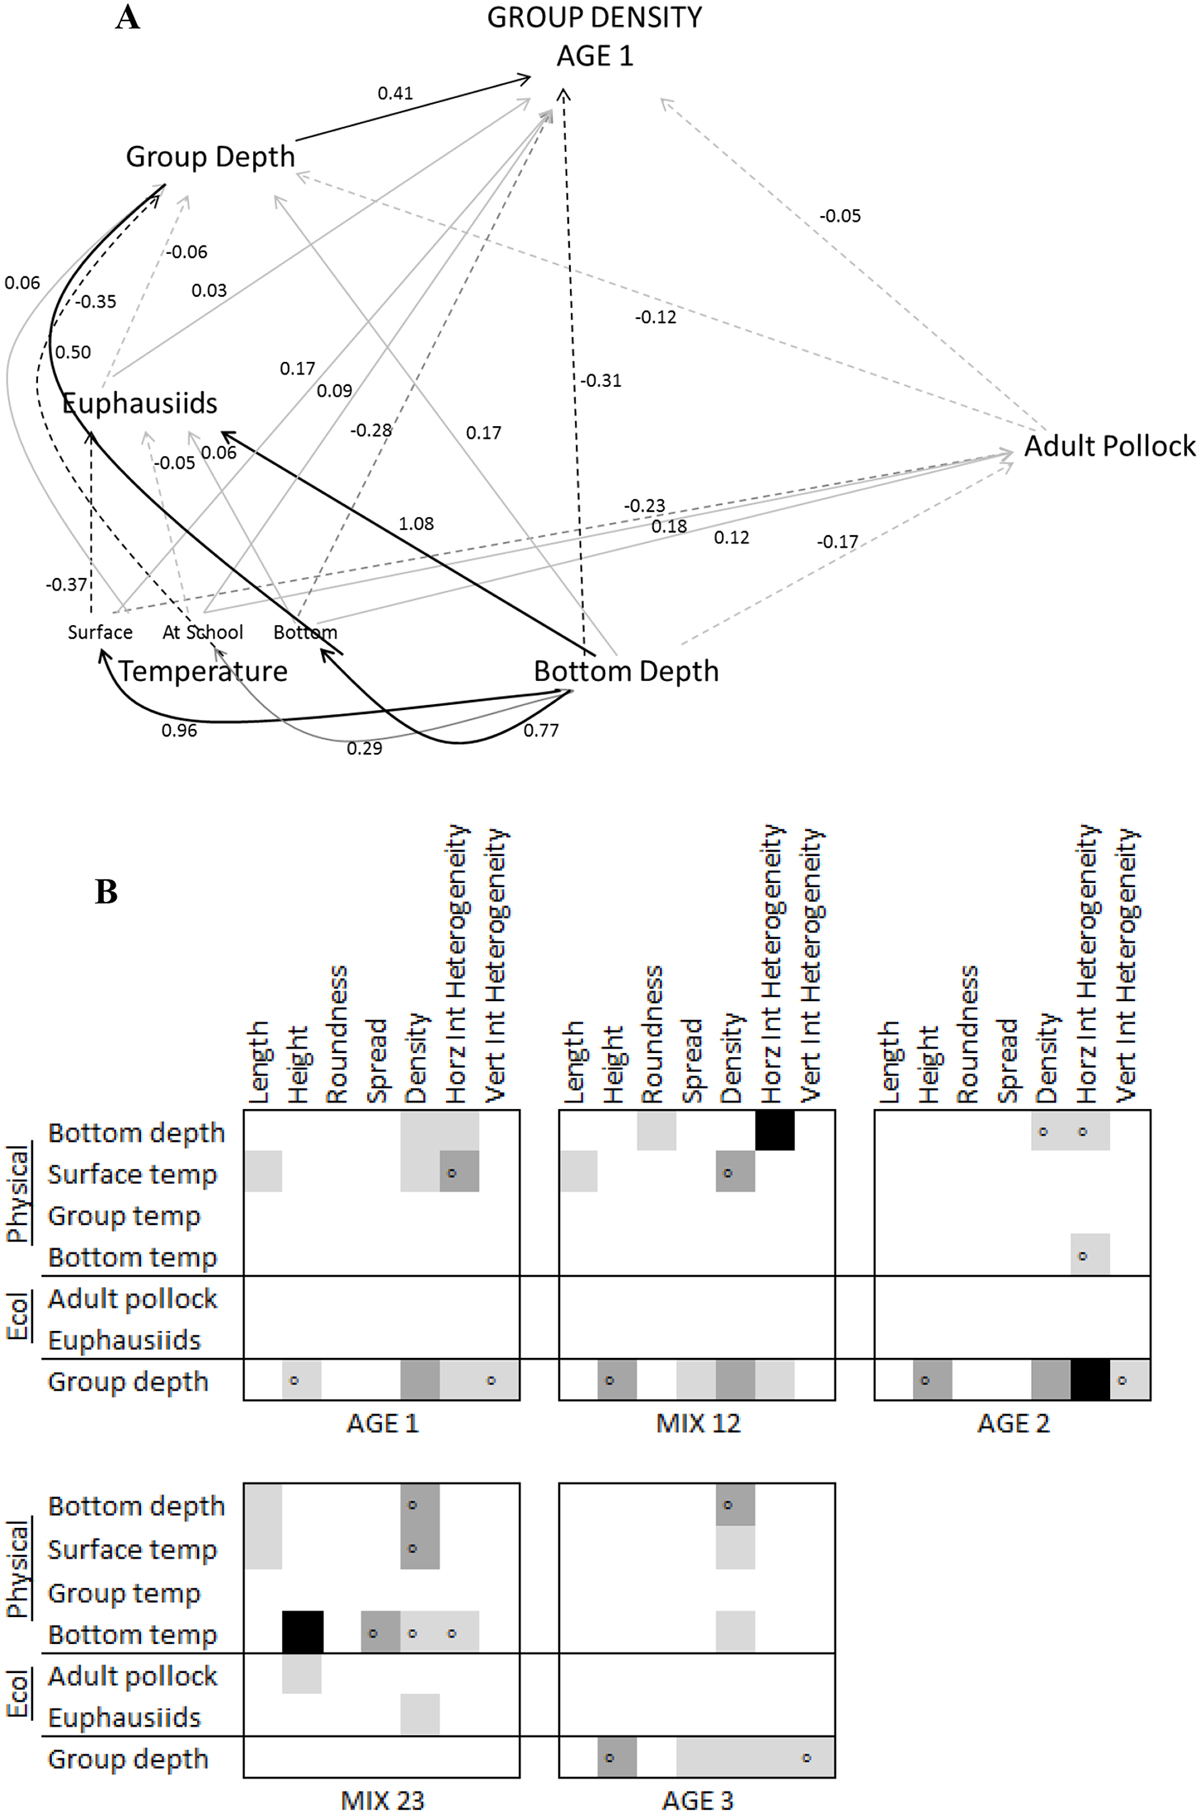
(A) Direct effects of environmental factors on group density of age-1 pollock. This result is intended as an illustrative example of how direct effects culminate into total effects. Similar results for the other 34 path analyses are not shown. Larger effects are indicated by more bold arrows. Solid arrows represent positive effects and dashed arrows represent negative effects. (B) Total effects (direct + indirect) of environmental factors on size, shape, and internal structure of age-1, mix12, age-2, mix23, and age-3 groups of juvenile walleye pollock. No effects (0–0.20) are indicated by white fill, small effects (0.20–0.35) are indicated by light gray fill, medium effects (0.35–0.50) are indicated by dark gray fill, and large effects (>0.50) are indicated by black fill. Positive effects are indicated by a solid fill, and negative effects are indicated by an open circle “∘” within the fill.
Current usage metrics show cumulative count of Article Views (full-text article views including HTML views, PDF and ePub downloads, according to the available data) and Abstracts Views on Vision4Press platform.
Data correspond to usage on the plateform after 2015. The current usage metrics is available 48-96 hours after online publication and is updated daily on week days.
Initial download of the metrics may take a while.