Fig. 6
Download original image
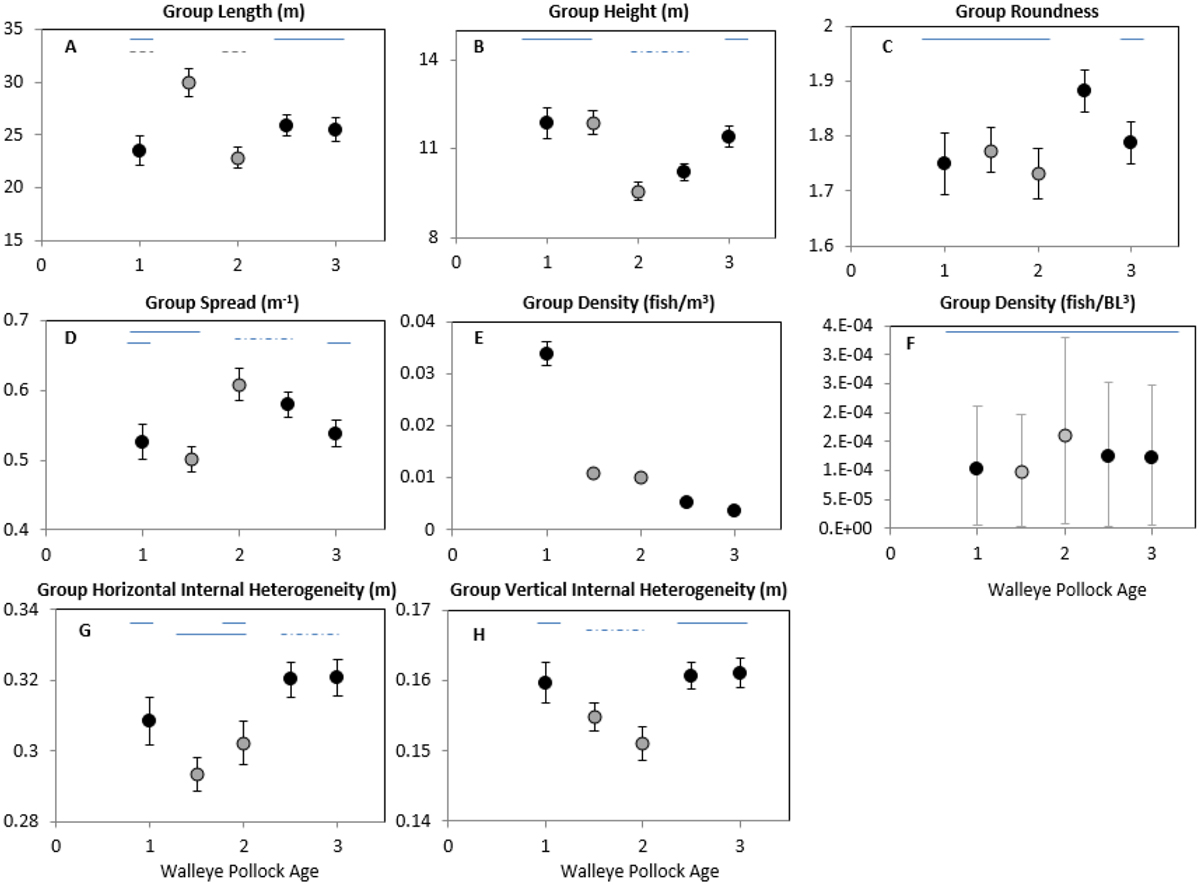
Results of a single-factor ANOVA showing effects of juvenile pollock age on group metrics (A, length; B, height; C, roundness; D, roughness; E, volumetric density; F, density based on body length; G, horizontal internal heterogeneity; and H, vertical internal heterogeneity). The error bars represent 95% confidence intervals about the mean and are sometimes obscured by the symbol. Black circles represent means from 2009, and the gray circles represent means from 2010. Mix 12 results (e.g., groups with 1 and 2 year olds) are plotted between age 1 and age 2, and mix 23 results (e.g., groups with 2 and 3 year olds) are plotted between age 2 and age 3. Lines above the symbols indicate no statistically significant differences were detected between those age groups based on Tukey's multiple comparison tests.
Current usage metrics show cumulative count of Article Views (full-text article views including HTML views, PDF and ePub downloads, according to the available data) and Abstracts Views on Vision4Press platform.
Data correspond to usage on the plateform after 2015. The current usage metrics is available 48-96 hours after online publication and is updated daily on week days.
Initial download of the metrics may take a while.