Fig. 1
Download original image
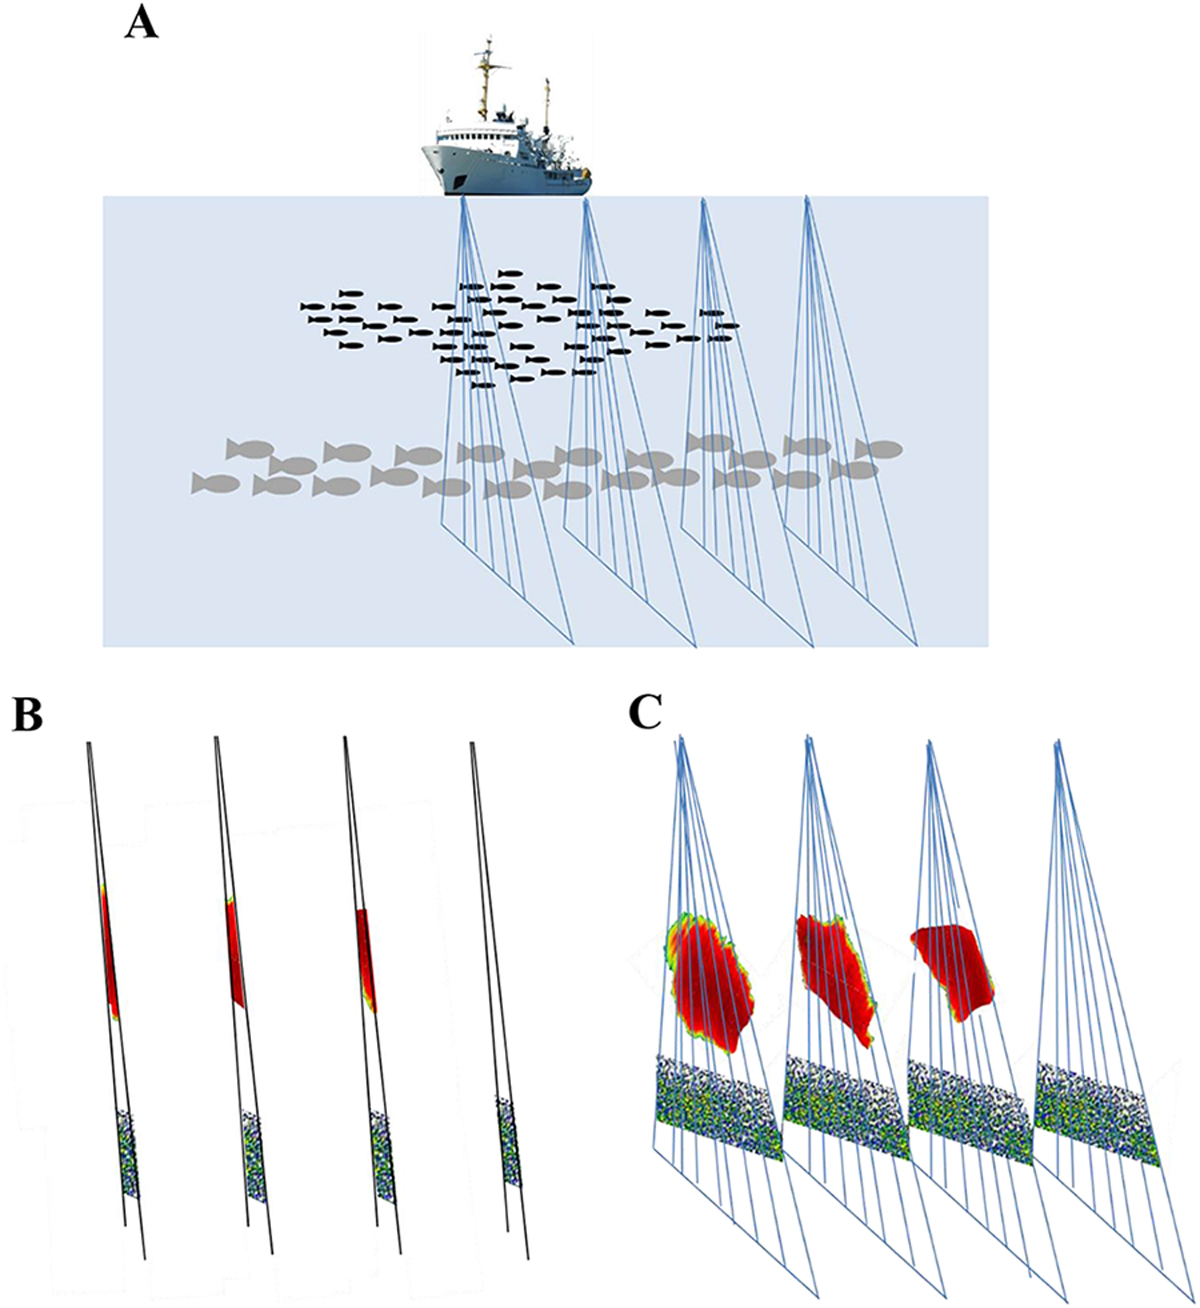
(A) Schematic of the insonification of two fish groups (e.g., juvenile fish − shallower, predator − deeper) with a 7-beam multibeam sonar. In this depiction, part of the juvenile group has been insonified over three consecutive transmitted acoustic signals (i.e., pings) and part of the predators have been insonified over four consecutive transmitted acoustic signals. (B) The associated backscatter characterizes the two-dimensional structure of the insonified part of the groups. (C) The associated backscatter characterizes the three-dimensional structure of the insonified part of the group. The color scale green-to- dark red represents low to high backscatter values, respectively.
Current usage metrics show cumulative count of Article Views (full-text article views including HTML views, PDF and ePub downloads, according to the available data) and Abstracts Views on Vision4Press platform.
Data correspond to usage on the plateform after 2015. The current usage metrics is available 48-96 hours after online publication and is updated daily on week days.
Initial download of the metrics may take a while.